

Reds vs Brewers Live Score (11 Sep, 2026)
Game Information
Stage
STD
Season
2026
First Pitch
Fri, Sep 11, 7:40 pm
Venue
American Family Field
Location
Milwaukee, Wisconsin
Venue Type
Indoor
Broadcast
MLB.TV
Attendance
41,879
Live Situation
0Balls
0Strikes
0Outs
—Pitcher
—At Bat
Pitch Sequence
1
BALL IN PLAY
Cutter
87 MPH
Injury Report



Team Stats
 CIN
MIL


0
Runs
20
2
Hits
23
1
Errors
1
0
Home Runs
4
2
Walks
2
8
Strikeouts
6
Player Box Score
Cincinnati Reds
| Player | H-AB | AB | R | H | RBI | HR | BB | K | #P | AVG | OBP | SLG |
|---|---|---|---|---|---|---|---|---|---|---|---|---|
 Hector Rodriguez | 0-4 | 4 | 0 | 0 | 0 | 0 | 0 | 0 | 16 | .245 | .300 | .422 |
 Elly De La Cruz | 0-3 | 3 | 0 | 0 | 0 | 0 | 1 | 2 | 14 | .282 | .361 | .508 |
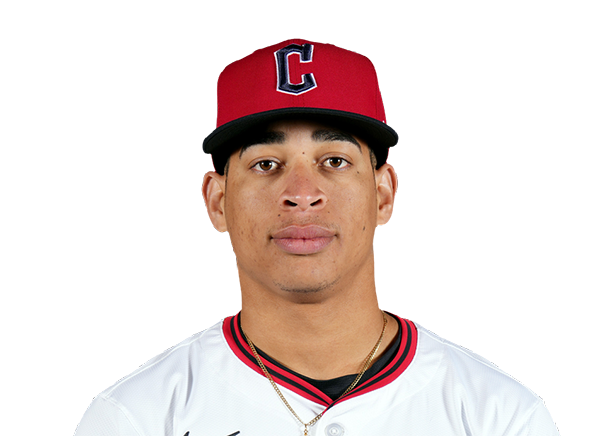 Juan Brito | 0-0 | 0 | 0 | 0 | 0 | 0 | 0 | 0 | 0 | .197 | .270 | .318 |
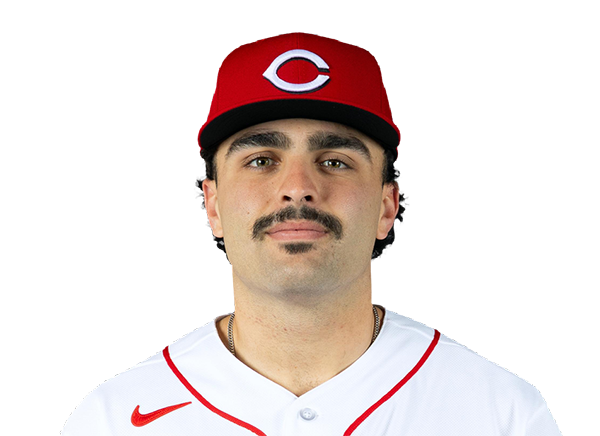 Sal Stewart | 2-4 | 4 | 0 | 2 | 0 | 0 | 0 | 0 | 13 | .268 | .338 | .478 |
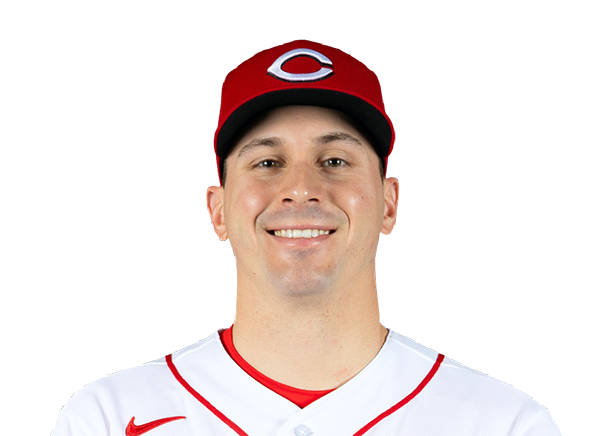 JJ Bleday | 0-3 | 3 | 0 | 0 | 0 | 0 | 0 | 1 | 11 | .212 | .323 | .415 |
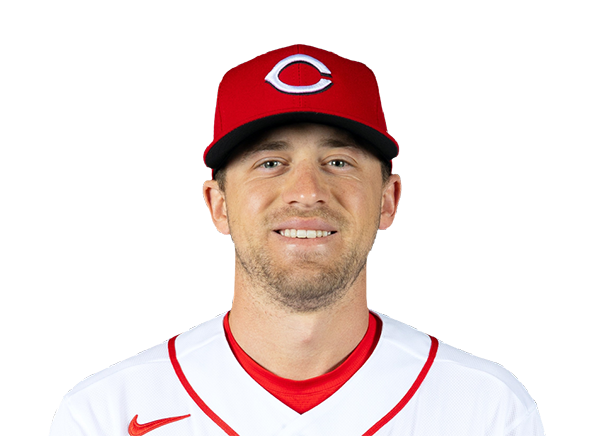 TJ Friedl | 0-1 | 1 | 0 | 0 | 0 | 0 | 0 | 0 | 4 | .162 | .244 | .247 |
 Tyler Stephenson | 0-2 | 2 | 0 | 0 | 0 | 0 | 0 | 0 | 6 | .248 | .331 | .420 |
 Will Banfield | 0-2 | 2 | 0 | 0 | 0 | 0 | 0 | 1 | 5 | .111 | .111 | .111 |
 Eugenio Suarez | 0-2 | 2 | 0 | 0 | 0 | 0 | 1 | 1 | 12 | .207 | .302 | .418 |
 Carlos Jorge | 0-3 | 3 | 0 | 0 | 0 | 0 | 0 | 1 | 9 | .125 | .125 | .125 |
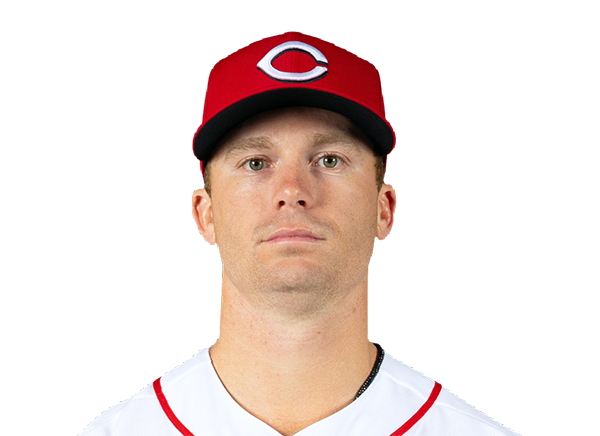 Matt McLain | 0-3 | 3 | 0 | 0 | 0 | 0 | 0 | 1 | 12 | .188 | .281 | .343 |
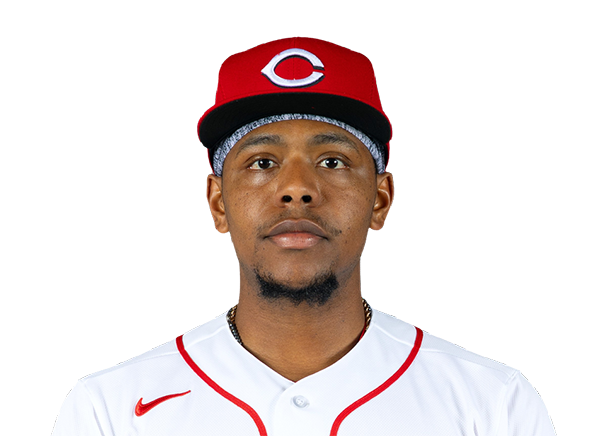 Ke'Bryan Hayes | 0-3 | 3 | 0 | 0 | 0 | 0 | 0 | 1 | 12 | .151 | .209 | .244 |
Milwaukee Brewers
| Player | H-AB | AB | R | H | RBI | HR | BB | K | #P | AVG | OBP | SLG |
|---|---|---|---|---|---|---|---|---|---|---|---|---|
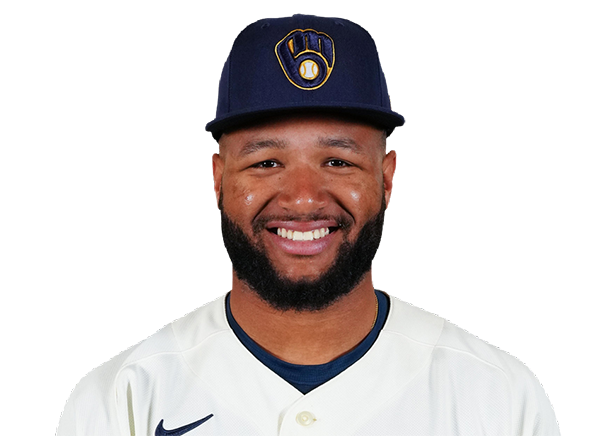 Jackson Chourio | 4-6 | 6 | 3 | 4 | 2 | 0 | 0 | 1 | 17 | .294 | .350 | .498 |
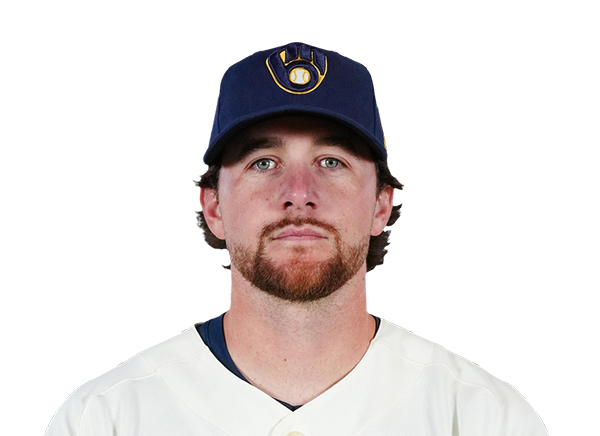 Brice Turang | 3-3 | 3 | 3 | 3 | 4 | 1 | 1 | 0 | 12 | .261 | .359 | .436 |
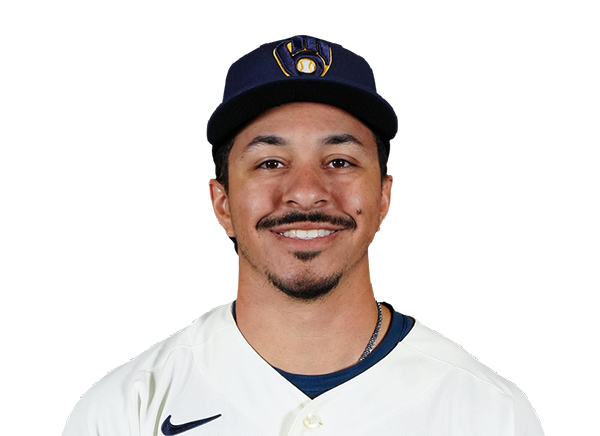 David Hamilton | 0-2 | 2 | 2 | 0 | 0 | 0 | 0 | 0 | 2 | .244 | .315 | .338 |
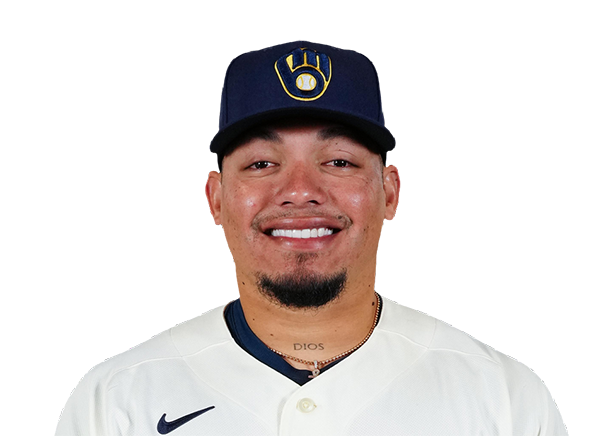 William Contreras | 2-5 | 5 | 2 | 2 | 6 | 1 | 0 | 0 | 12 | .272 | .341 | .415 |
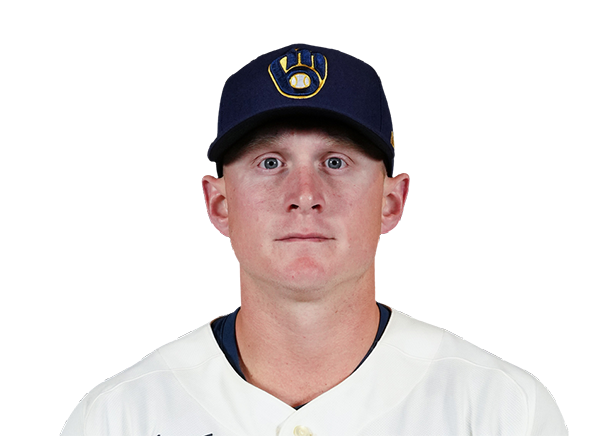 Andrew Vaughn | 2-2 | 2 | 1 | 2 | 1 | 0 | 0 | 0 | 6 | .314 | .398 | .458 |
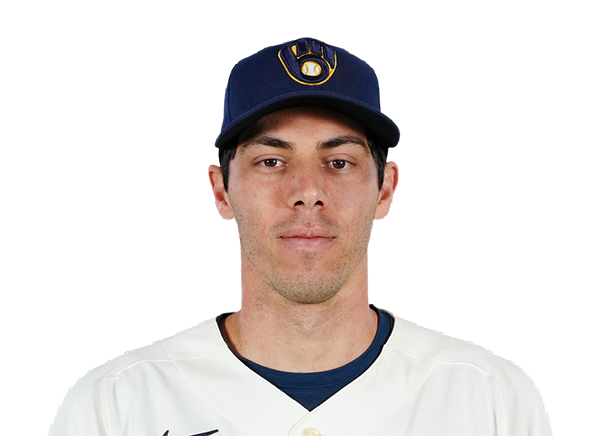 Christian Yelich | 0-4 | 4 | 0 | 0 | 0 | 0 | 0 | 2 | 16 | .239 | .317 | .388 |
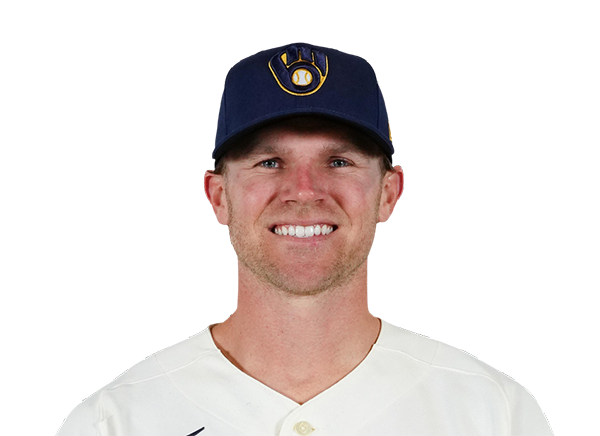 Jake Bauers | 2-5 | 5 | 1 | 2 | 2 | 1 | 0 | 1 | 21 | .270 | .395 | .495 |
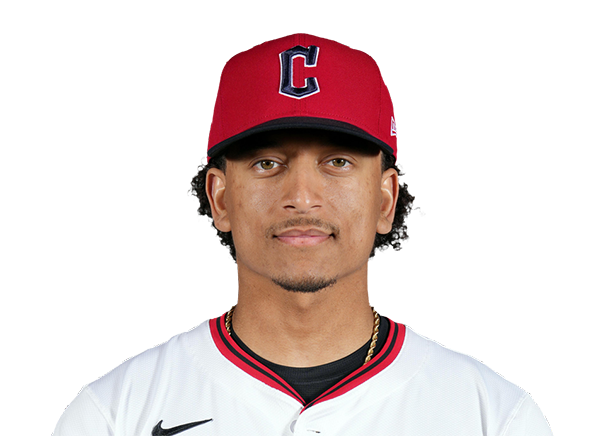 Bo Naylor | 0-0 | 0 | 0 | 0 | 0 | 0 | 0 | 0 | 0 | .148 | .202 | .239 |
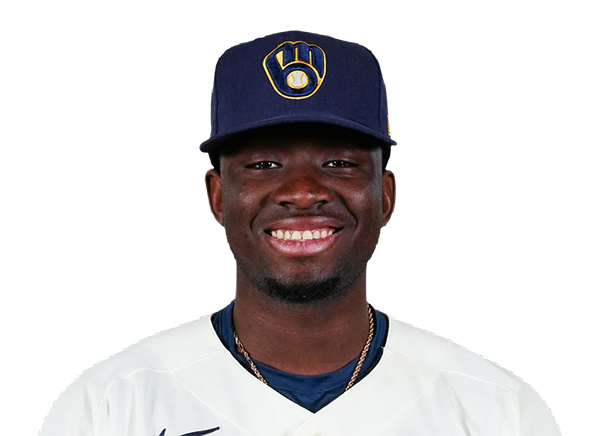 Luis Lara | 2-5 | 5 | 1 | 2 | 0 | 0 | 0 | 1 | 10 | .265 | .335 | .355 |
 Cooper Pratt | 1-4 | 4 | 2 | 1 | 0 | 0 | 1 | 1 | 17 | .263 | .335 | .358 |
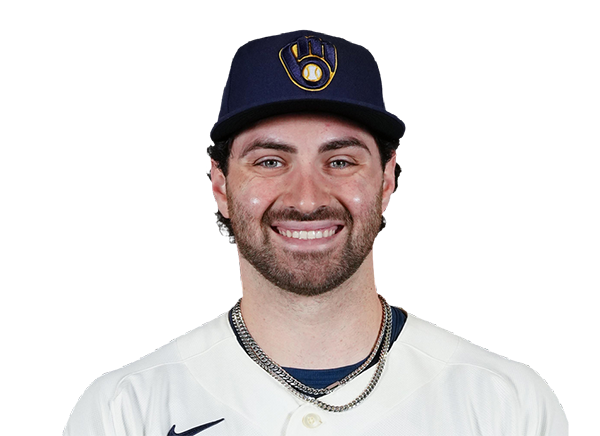 Garrett Mitchell | 3-5 | 5 | 3 | 3 | 4 | 1 | 0 | 0 | 11 | .263 | .353 | .418 |
 Joey Ortiz | 4-5 | 5 | 2 | 4 | 0 | 0 | 0 | 0 | 14 | .263 | .323 | .392 |
Cincinnati Reds
| Player | IP | H | R | ER | BB | K | HR | PC-ST | ERA | PC |
|---|---|---|---|---|---|---|---|---|---|---|
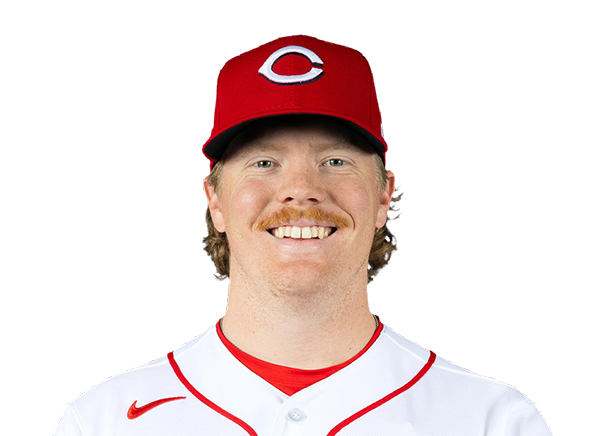 Andrew Abbott | 2.0 | 9 | 8 | 8 | 0 | 0 | 2 | 43-31 | 4.84 | 43 |
|
Julian Garcia | 1.2 | 3 | 1 | 1 | 1 | 1 | 0 | 27-16 | 3.07 | 27 |
 Luis Mey | 1.0 | 8 | 8 | 8 | 1 | 2 | 1 | 38-24 | 6.59 | 38 |
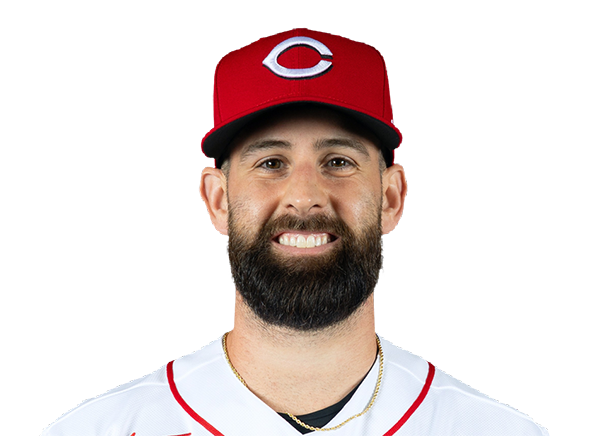 Tejay Antone | 0.1 | 0 | 0 | 0 | 0 | 1 | 0 | 4-3 | 3.51 | 4 |
 Brock Burke | 1.0 | 0 | 0 | 0 | 0 | 1 | 0 | 7-5 | 2.47 | 7 |
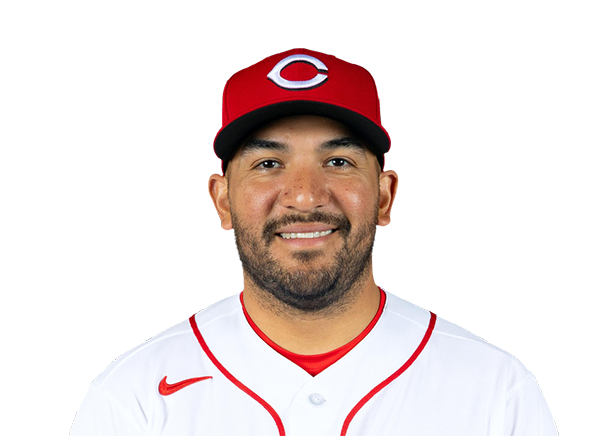 Jose Trevino | 2.0 | 3 | 3 | 3 | 0 | 1 | 1 | 19-15 | 15.00 | 19 |
Milwaukee Brewers
| Player | IP | H | R | ER | BB | K | HR | PC-ST | ERA | PC |
|---|---|---|---|---|---|---|---|---|---|---|
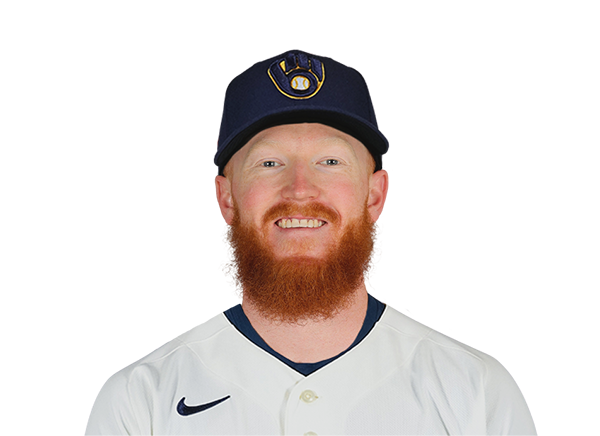 Dustin May | 6.0 | 2 | 0 | 0 | 1 | 6 | 0 | 84-56 | 4.49 | 84 |
 Garrett Stallings | 3.0 | 0 | 0 | 0 | 1 | 2 | 0 | 30-21 | 0.00 | 30 |
H2H / Season Series
MIL20–0
CIN
CIN12–8
MIL
CIN5–3
MIL
CIN7–10
MIL
MIL2–7
CIN
MIL4–2
CIN
MIL7–2
CIN
MIL5–3
CIN
CIN5–6
MIL
CIN0–2
MIL
Last 5 Games
| Date | Opponent | Result |
|---|---|---|
| Sep 11 | @ MIL | L0–20 |
| Sep 9 |  @ LAD | L1–14 |
| Sep 8 | @ LAD | L2–3 |
| Sep 7 | @ LAD | L3–6 |
| Sep 6 | vs MIL | W12–8 |
| Date | Opponent | Result |
|---|---|---|
| Sep 11 | vs CIN | W20–0 |
| Sep 9 |  vs CHC | W8–6 |
| Sep 8 | vs CHC | W4–3 |
| Sep 7 | vs CHC | W4–3 |
| Sep 6 | @ CIN | L8–12 |
Standings
American League
| Team | W | L | PCT | GB | DIFF | STRK |
|---|---|---|---|---|---|---|
1 Rays | 88 | 59 | .599 | - | +58 | W1 |
2 White Sox | 75 | 72 | .510 | 13 | +35 | L4 |
3 Astros | 75 | 73 | .507 | 13.5 | -42 | L1 |
4 Yankees | 85 | 62 | .578 | 3 | +133 | W4 |
5 Red Sox | 80 | 68 | .541 | 8.5 | +81 | L3 |
6 Guardians | 75 | 73 | .507 | 13.5 | -13 | W1 |
7 Blue Jays | 73 | 75 | .493 | 15.5 | -42 | L2 |
8 Rangers | 72 | 76 | .486 | 16.5 | -49 | L3 |
9 Orioles | 72 | 76 | .486 | 16.5 | -24 | W2 |
10 Twins | 69 | 78 | .469 | 19 | -56 | L2 |
11 Mariners | 69 | 79 | .466 | 19.5 | -75 | L1 |
12 Tigers | 68 | 79 | .463 | 20 | +59 | W2 |
13 Royals | 66 | 82 | .446 | 22.5 | -87 | W2 |
14 Athletics | 60 | 88 | .405 | 28.5 | -186 | W2 |
15 Angels | 56 | 91 | .381 | 32 | -74 | L1 |
National League
| Team | W | L | PCT | GB | DIFF | STRK |
|---|---|---|---|---|---|---|
| 1Brewers | 92 | 56 | .622 | - | +192 | W4 |
| 2Dodgers | 90 | 57 | .612 | 1.5 | +173 | W8 |
3 Braves | 87 | 61 | .588 | 5 | +111 | W2 |
| 4Cubs | 82 | 66 | .554 | 10 | +138 | W1 |
5 Phillies | 82 | 66 | .554 | 10 | +36 | L2 |
6 Padres | 79 | 68 | .537 | 12.5 | +19 | W5 |
7 Diamondbacks | 79 | 69 | .534 | 13 | +7 | W1 |
8 Pirates | 74 | 74 | .500 | 18 | +26 | L1 |
9 Cardinals | 73 | 75 | .493 | 19 | -8 | W1 |
10 Marlins | 72 | 76 | .486 | 20 | +3 | L4 |
| 11Reds | 69 | 78 | .469 | 22.5 | -142 | L4 |
12 Mets | 68 | 79 | .463 | 23.5 | -42 | L1 |
13 Nationals | 68 | 81 | .456 | 24.5 | +1 | W1 |
14 Giants | 62 | 86 | .419 | 30 | -74 | L1 |
15 Rockies | 55 | 92 | .374 | 36.5 | -158 | L5 |
CIN
VS
MIL
Pitchers
Andrew Abbott
Catchers
Tyler Stephenson
Infielders
Elly De La Cruz
Sal Stewart
Matt McLain
Ke'Bryan Hayes
Outfielders
Hector Rodriguez
JJ Bleday
Carlos Jorge
Designated Hitters
Eugenio Suarez
Pitchers
Dustin May
Catchers
William Contreras
Infielders
Brice Turang
Jake Bauers
Cooper Pratt
Joey Ortiz
Outfielders
Jackson Chourio
Luis Lara
Garrett Mitchell
Designated Hitters
Andrew Vaughn
Reds
VS
Brewers
Batting
147
Team Games Played
148
4889
At Bats
5036
1119
Hits
1303
585
Runs Batted In
720
196
Home Runs
141
102
Stolen Bases
143
.229
Batting Average
.259
611
Runs
762
203
Doubles
259
12
Triples
25
1934
Total Bases
2035
522
Walks
611
1404
Strikeouts
1244
.307
On Base Percentage
.341
.396
Slugging Percentage
.404
.703
OBP Pct + SLG Pct
.745
147
Games Played
148
147
Games Started
148
47
Hit By Pitch
38
0.0
Wins Above Replacement
0.0
0.0
Offensive Wins Above Replacement
0.0
31
Caught Stealing
45
1
Is Qualified
1
611.9
Runs Created
722.9
4.2
Runs Created Per 27 Outs
5.0
.095
Walks Per Plate Appearance
.106
0.37
Walk To Strikeout Ratio
0.49
.167
Isolated Power
.145
.288
Secondary Average
.286
3.94
Pitches Per Plate Appearance
3.99
411
Extra Base Hits
425
5512
Plate Appearances
5766
24.9
At Bats Per Home Run
35.7
15
Sacrifice Hit
33
36
Sacrifice Flies
41
Pitching
147
Team Games Played
148
45
Quality Starts
51
69
Wins
92
78
Losses
56
39
Saves
47
81
Holds
77
1275
Hits
1084
700
Earned runs
519
192
Home Runs
156
604
Walks
477
1192
Strikeouts
1414
8.2
Strikeouts Per 9 Innings
9.6
153.2
Pitches Per Start
146.1
1.44
Walks Plus Hits Per Inning Pitched
1.18
4.84
Earned Run Average
3.53
78
Losses
56
1301.0
Innings pitched
1321.2
.469
Win Percentage
.622
61
Save Opportunities
65
.254
Opponent Batting Average
.221
.341
Opponent's On-base pct.
.297
.428
Opponent's Slugging pct.
.363
.768
Opponent's OPB Pct + SLG Pct
.660
5011
At Bats
4896
233
Doubles
196
30
Triples
14
76
Batters Hit
60
135
Stolen Bases
69
147
Games Played
148
0
Complete Games
1
8
Shutouts
10
43
Wild Pitches
47
724
Runs Batted In
546
3
Balks
6
1301.0
Innings pitched
1321.2
8.2
Strikeouts Per 9 Innings
9.6
31
Caught Stealing
29
147
Games Started
148
0.0
Wins Above Replacement
0.0
1
Is Qualified
1
753
Runs
570
700
Earned Runs
519
2144
Total Bases
1776
Fielding
147
Team Games Played
148
1301
Full Innings
1322
5162
Total Chances
5189
3903
Putouts
3965
1175
Assists
1157
84
Errors
67
203
Double Plays
259
0.984
Fielding Percentage
0.987
35.1
Range Factor
34.9
0.0
Zone Rating
0.0
147
Games Played
148
0
Games Started
0
0.0
Defensive Wins Above Replacement
0.0
1
Qualified
1