

Reds vs Dodgers Live Score (8 Sep, 2026)
Game Information
Stage
STD
Season
2026
First Pitch
Mon, Sep 7, 9:10 pm
Venue
Dodger Stadium
Location
Los Angeles, California
Venue Type
Outdoor
Broadcast
MLB.TV
Attendance
50,293
Live Situation
0Balls
0Strikes
0Outs
—Pitcher
—At Bat
Pitch Sequence
1
BALL IN PLAY
Cutter
94 MPH
Injury Report




Team Stats
 CIN
LAD


3
Runs
6
7
Hits
3
2
Errors
0
2
Home Runs
1
1
Walks
6
14
Strikeouts
9
Player Box Score
Cincinnati Reds
| Player | H-AB | AB | R | H | RBI | HR | BB | K | #P | AVG | OBP | SLG |
|---|---|---|---|---|---|---|---|---|---|---|---|---|
 Hector Rodriguez | 2-4 | 4 | 1 | 2 | 0 | 0 | 0 | 1 | 15 | .275 | .333 | .473 |
 Elly De La Cruz | 2-4 | 4 | 1 | 2 | 1 | 1 | 0 | 2 | 11 | .281 | .361 | .498 |
 Sal Stewart | 0-3 | 3 | 0 | 0 | 0 | 0 | 1 | 2 | 15 | .266 | .338 | .480 |
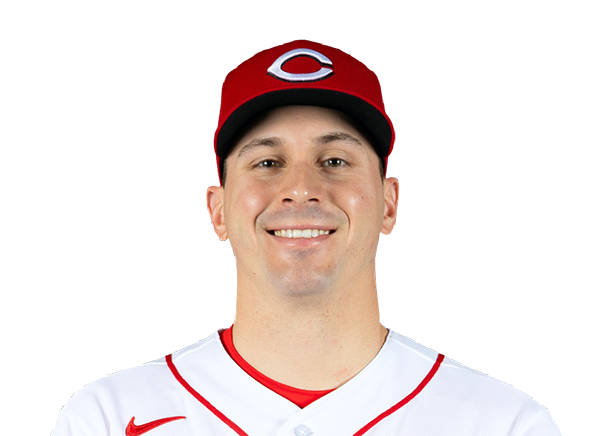 JJ Bleday | 0-3 | 3 | 0 | 0 | 0 | 0 | 0 | 2 | 12 | .217 | .328 | .424 |
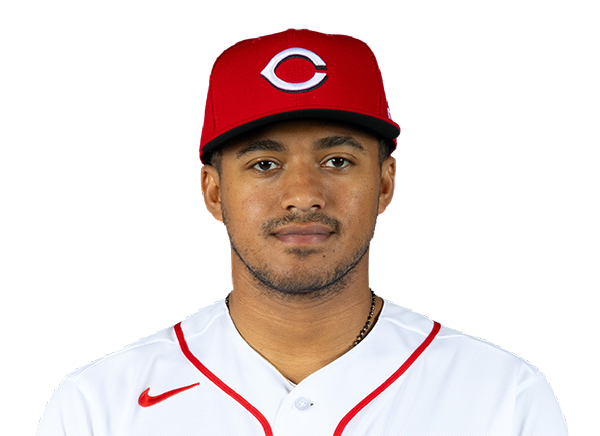 Dane Myers | 0-1 | 1 | 0 | 0 | 1 | 0 | 0 | 0 | 6 | .268 | .358 | .382 |
 Tyler Stephenson | 0-4 | 4 | 0 | 0 | 0 | 0 | 0 | 1 | 18 | .246 | .327 | .421 |
 Eugenio Suarez | 1-4 | 4 | 1 | 1 | 1 | 1 | 0 | 2 | 13 | .209 | .302 | .424 |
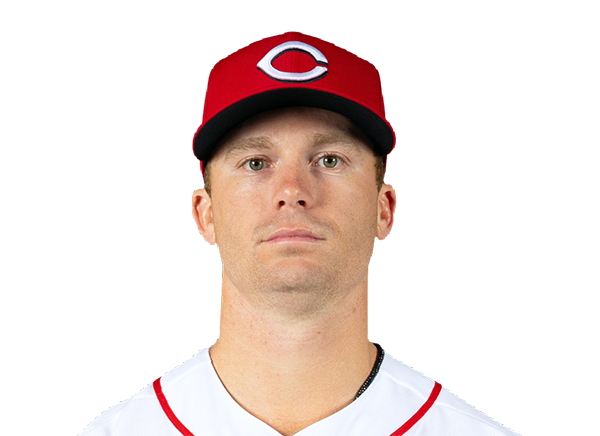 Matt McLain | 0-4 | 4 | 0 | 0 | 0 | 0 | 0 | 2 | 18 | .188 | .283 | .346 |
 Carlos Jorge | 2-4 | 4 | 0 | 2 | 0 | 0 | 0 | 0 | 8 | .222 | .222 | .222 |
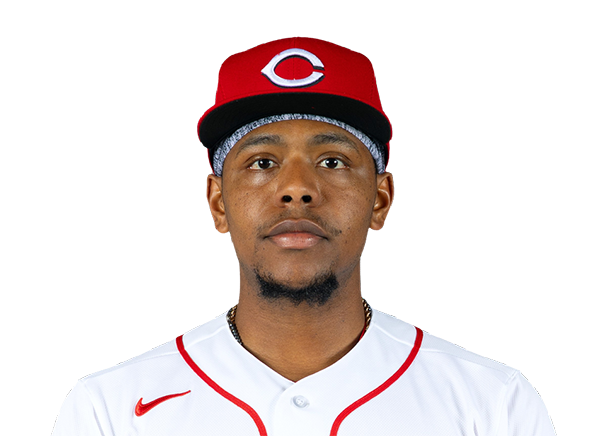 Ke'Bryan Hayes | 0-3 | 3 | 0 | 0 | 0 | 0 | 0 | 2 | 10 | .151 | .210 | .246 |
Los Angeles Dodgers
| Player | H-AB | AB | R | H | RBI | HR | BB | K | #P | AVG | OBP | SLG |
|---|---|---|---|---|---|---|---|---|---|---|---|---|
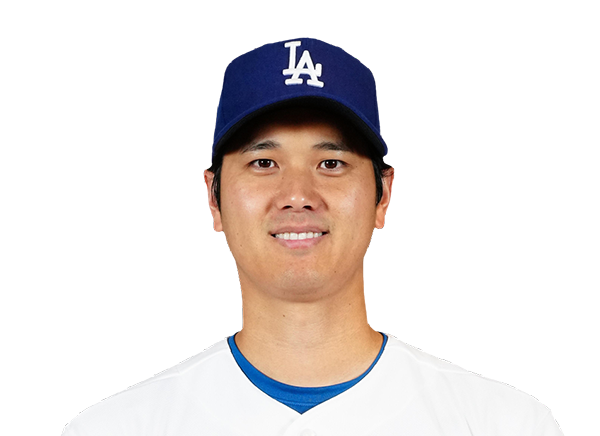 Shohei Ohtani | 0-3 | 3 | 0 | 0 | 0 | 0 | 1 | 2 | 17 | .277 | .380 | .522 |
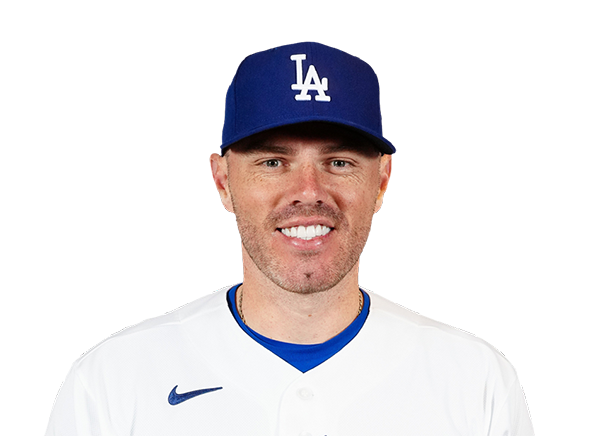 Freddie Freeman | 0-3 | 3 | 1 | 0 | 0 | 0 | 1 | 0 | 20 | .299 | .378 | .457 |
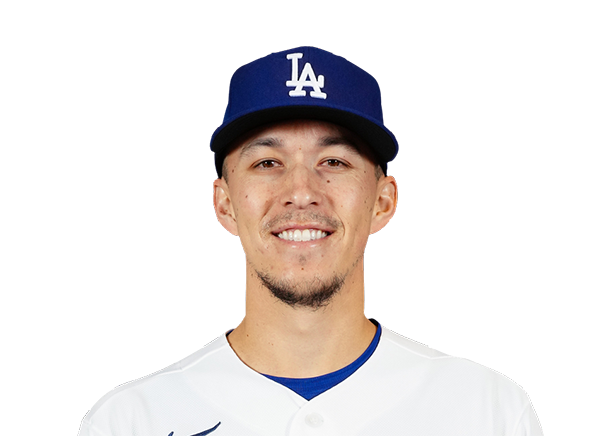 Tommy Edman | 0-4 | 4 | 0 | 0 | 0 | 0 | 0 | 0 | 12 | .272 | .347 | .413 |
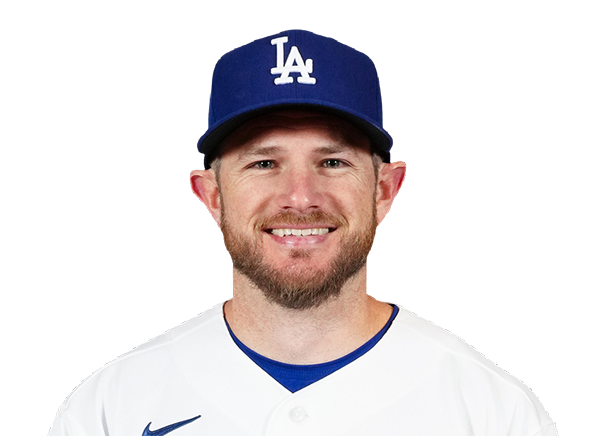 Max Muncy | 1-2 | 2 | 2 | 1 | 0 | 0 | 2 | 0 | 16 | .251 | .350 | .489 |
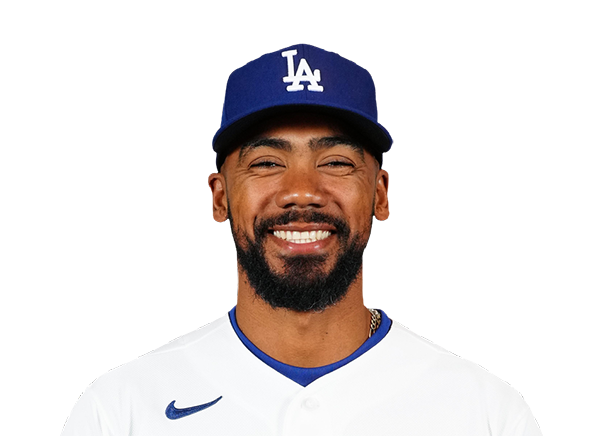 Teoscar Hernandez | 2-3 | 3 | 2 | 2 | 3 | 1 | 1 | 1 | 8 | .261 | .327 | .413 |
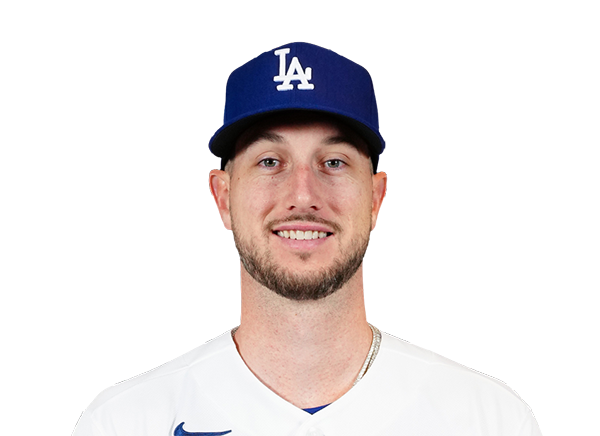 Kyle Tucker | 0-4 | 4 | 0 | 0 | 0 | 0 | 0 | 1 | 16 | .221 | .321 | .351 |
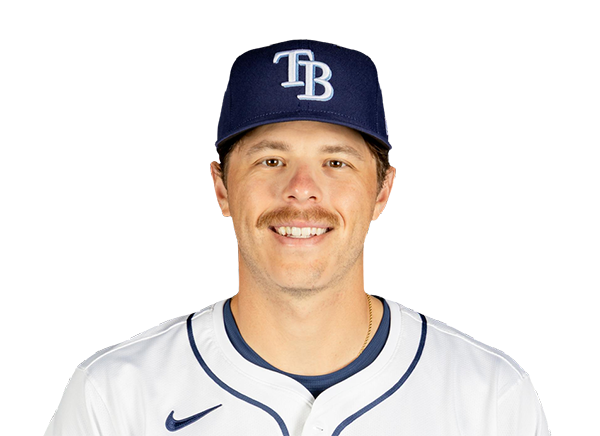 Hunter Feduccia | 0-3 | 3 | 0 | 0 | 0 | 0 | 0 | 3 | 17 | .237 | .313 | .340 |
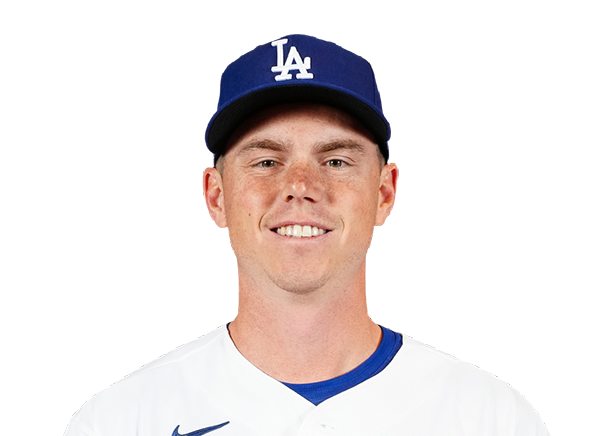 Will Smith | 0-0 | 0 | 0 | 0 | 1 | 0 | 0 | 0 | 5 | .237 | .329 | .363 |
 Alex Call | 0-2 | 2 | 1 | 0 | 0 | 0 | 1 | 1 | 19 | .250 | .365 | .324 |
 Alex Freeland | 0-1 | 1 | 0 | 0 | 0 | 0 | 0 | 1 | 6 | .222 | .306 | .300 |
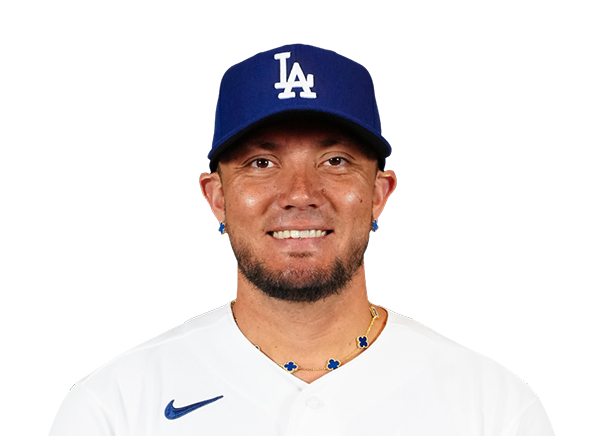 Miguel Rojas | 0-2 | 2 | 0 | 0 | 0 | 0 | 0 | 0 | 3 | .267 | .309 | .385 |
Cincinnati Reds
| Player | IP | H | R | ER | BB | K | HR | PC-ST | ERA | PC |
|---|---|---|---|---|---|---|---|---|---|---|
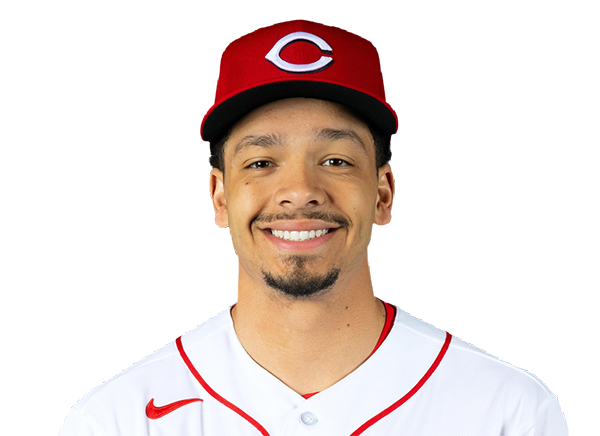 Chase Burns | 3.0 | 0 | 0 | 0 | 1 | 5 | 0 | 44-26 | 2.73 | 44 |
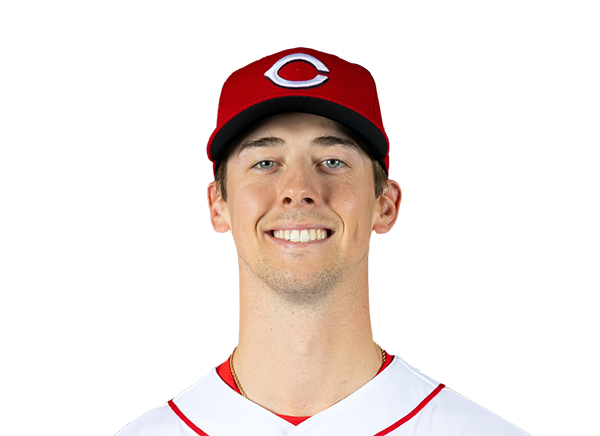 Brandon Williamson | 4.1 | 3 | 6 | 3 | 5 | 4 | 1 | 86-51 | 5.97 | 86 |
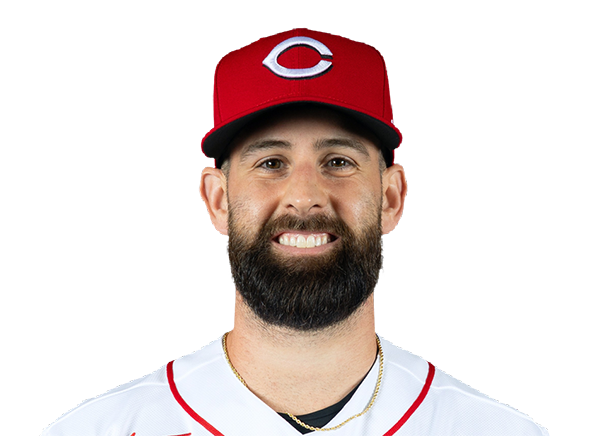 Tejay Antone | 0.2 | 0 | 0 | 0 | 0 | 0 | 0 | 9-6 | 3.54 | 9 |
Los Angeles Dodgers
| Player | IP | H | R | ER | BB | K | HR | PC-ST | ERA | PC |
|---|---|---|---|---|---|---|---|---|---|---|
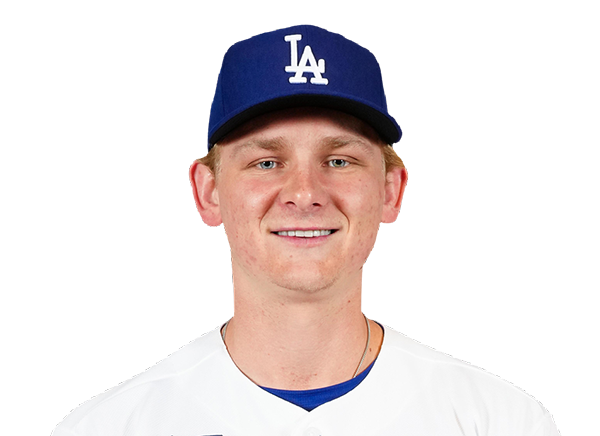 Emmet Sheehan | 5.2 | 3 | 1 | 1 | 1 | 10 | 1 | 82-57 | 5.08 | 82 |
 Alex Vesia | 0.1 | 0 | 0 | 0 | 0 | 1 | 0 | 4-4 | 2.98 | 4 |
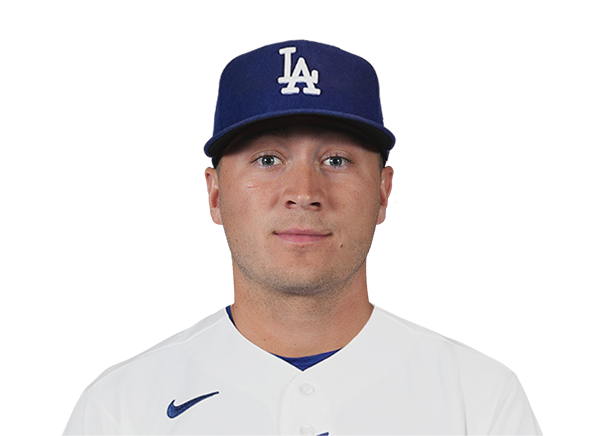 Seth Halvorsen | 1.0 | 2 | 1 | 1 | 0 | 0 | 1 | 14-10 | 6.00 | 14 |
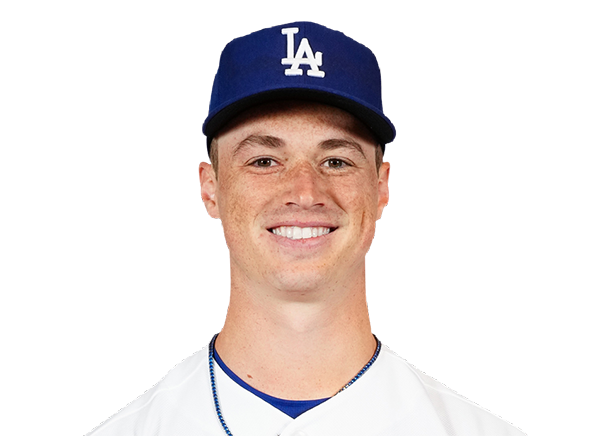 Jack Dreyer | 1.0 | 2 | 1 | 1 | 0 | 1 | 0 | 17-11 | 2.98 | 17 |
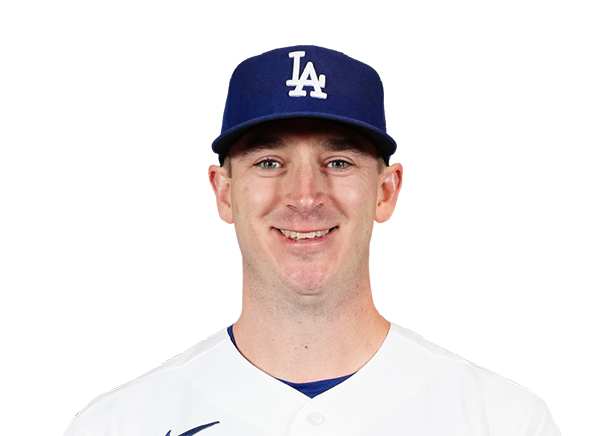 Evan Phillips | 1.0 | 0 | 0 | 0 | 0 | 2 | 0 | 9-7 | 3.48 | 9 |
H2H / Season Series
LAD6–3
CIN
LAD9–5
CIN
CIN14–13
LAD
Last 5 Games
| Date | Opponent | Result |
|---|---|---|
| Sep 7 | @ LAD | L3–6 |
| Sep 6 |  vs MIL | W12–8 |
| Sep 5 | vs MIL | W5–3 |
| Sep 4 | vs MIL | L7–10 |
| Sep 2 |  vs SD | W7–3 |
| Date | Opponent | Result |
|---|---|---|
| Sep 7 | vs CIN | W6–3 |
| Sep 6 |  vs WSH | W7–5 |
| Sep 5 | vs WSH | W6–5 |
| Sep 4 | vs WSH | W5–3 |
| Sep 3 |  vs STL | W3–2 |
Standings
American League
| Team | W | L | PCT | GB | DIFF | STRK |
|---|---|---|---|---|---|---|
1 Rays | 85 | 58 | .594 | - | +47 | L1 |
2 White Sox | 75 | 68 | .524 | 10 | +49 | W1 |
3 Astros | 73 | 71 | .507 | 12.5 | -38 | L2 |
4 Yankees | 81 | 62 | .566 | 4 | +117 | L1 |
5 Red Sox | 80 | 65 | .552 | 6 | +89 | W5 |
6 Guardians | 73 | 72 | .503 | 13 | -16 | L1 |
7 Blue Jays | 72 | 73 | .497 | 14 | -39 | L2 |
8 Rangers | 71 | 73 | .493 | 14.5 | -44 | W1 |
9 Orioles | 70 | 75 | .483 | 16 | -27 | W1 |
10 Twins | 68 | 76 | .472 | 17.5 | -49 | L2 |
11 Mariners | 67 | 77 | .465 | 18.5 | -71 | W1 |
12 Tigers | 66 | 78 | .458 | 19.5 | +51 | W1 |
13 Royals | 64 | 81 | .441 | 22 | -89 | L1 |
14 Athletics | 58 | 87 | .400 | 28 | -187 | W1 |
15 Angels | 54 | 90 | .375 | 31.5 | -80 | L2 |
National League
| Team | W | L | PCT | GB | DIFF | STRK |
|---|---|---|---|---|---|---|
| 1Brewers | 89 | 56 | .614 | - | +169 | W1 |
| 2Dodgers | 87 | 57 | .604 | 1.5 | +155 | W5 |
3 Braves | 85 | 59 | .590 | 3.5 | +119 | L1 |
4 Phillies | 81 | 63 | .563 | 7.5 | +35 | W1 |
5 Cubs | 81 | 64 | .559 | 8 | +131 | L2 |
6 Diamondbacks | 77 | 68 | .531 | 12 | 0 | W3 |
| 7Padres | 76 | 68 | .528 | 12.5 | +9 | W2 |
8 Marlins | 72 | 73 | .497 | 17 | +10 | L1 |
| 9Cardinals | 72 | 73 | .497 | 17 | -10 | L1 |
10 Pirates | 71 | 73 | .493 | 17.5 | +26 | W1 |
| 11Reds | 69 | 75 | .479 | 19.5 | -108 | L1 |
| 12Nationals | 67 | 79 | .459 | 22.5 | +8 | L5 |
13 Mets | 66 | 78 | .458 | 22.5 | -43 | W2 |
14 Giants | 60 | 85 | .414 | 29 | -74 | W1 |
15 Rockies | 55 | 88 | .385 | 33 | -140 | L1 |
CIN
VS
LAD
Pitchers
Chase Burns
Catchers
Tyler Stephenson
Infielders
Elly De La Cruz
Sal Stewart
Matt McLain
Ke'Bryan Hayes
Outfielders
Hector Rodriguez
JJ Bleday
Carlos Jorge
Designated Hitters
Eugenio Suarez
Pitchers
Emmet Sheehan
Catchers
Hunter Feduccia
Infielders
Freddie Freeman
Tommy Edman
Max Muncy
Alex Freeland
Outfielders
Teoscar Hernandez
Kyle Tucker
Alex Call
Designated Hitters
Shohei Ohtani
Reds
VS
Dodgers
Batting
144
Team Games Played
144
4796
At Bats
4845
1105
Hits
1240
580
Runs Batted In
669
194
Home Runs
175
100
Stolen Bases
61
.230
Batting Average
.256
608
Runs
711
202
Doubles
235
12
Triples
15
1913
Total Bases
2030
516
Walks
547
1375
Strikeouts
1137
.309
On Base Percentage
.336
.399
Slugging Percentage
.419
.708
OBP Pct + SLG Pct
.755
144
Games Played
144
144
Games Started
144
47
Hit By Pitch
58
0.0
Wins Above Replacement
0.0
0.0
Offensive Wins Above Replacement
0.0
31
Caught Stealing
18
1
Is Qualified
1
609.4
Runs Created
689.9
4.3
Runs Created Per 27 Outs
4.9
.095
Walks Per Plate Appearance
.099
0.38
Walk To Strikeout Ratio
0.48
.168
Isolated Power
.163
.290
Secondary Average
.285
3.95
Pitches Per Plate Appearance
3.93
408
Extra Base Hits
425
5413
Plate Appearances
5512
24.7
At Bats Per Home Run
27.7
15
Sacrifice Hit
14
36
Sacrifice Flies
45
Pitching
144
Team Games Played
144
45
Quality Starts
74
69
Wins
87
75
Losses
57
39
Saves
42
81
Holds
91
1231
Hits
1046
663
Earned runs
525
183
Home Runs
161
592
Walks
443
1169
Strikeouts
1327
8.2
Strikeouts Per 9 Innings
9.4
153.3
Pitches Per Start
143.8
1.43
Walks Plus Hits Per Inning Pitched
1.17
4.67
Earned Run Average
3.70
75
Losses
57
1277.0
Innings pitched
1275.2
.479
Win Percentage
.604
61
Save Opportunities
62
.251
Opponent Batting Average
.220
.338
Opponent's On-base pct.
.294
.421
Opponent's Slugging pct.
.373
.759
Opponent's OPB Pct + SLG Pct
.667
4898
At Bats
4745
223
Doubles
215
29
Triples
13
74
Batters Hit
61
135
Stolen Bases
93
144
Games Played
144
0
Complete Games
1
8
Shutouts
11
41
Wild Pitches
34
690
Runs Batted In
529
3
Balks
4
1277.0
Innings pitched
1275.2
8.2
Strikeouts Per 9 Innings
9.4
30
Caught Stealing
24
144
Games Started
144
0.0
Wins Above Replacement
0.0
1
Is Qualified
1
716
Runs
556
663
Earned Runs
525
2061
Total Bases
1770
Fielding
144
Team Games Played
144
1277
Full Innings
1276
5064
Total Chances
5037
3831
Putouts
3827
1150
Assists
1154
83
Errors
56
202
Double Plays
235
0.984
Fielding Percentage
0.989
35.1
Range Factor
35.1
0.0
Zone Rating
0.0
144
Games Played
144
0
Games Started
0
0.0
Defensive Wins Above Replacement
0.0
1
Qualified
1