

Reds vs Marlins Live Score (8 Apr, 2026)
Game Information
Stage
Standard
Season
2026
First Pitch
Wed, Apr 8, 6:40 pm
Venue
loanDepot park
Location
Miami, Florida
Attendance
8,639
Live Situation
1Balls
3Strikes
0Outs
—Pitcher
—At Bat
Pitch Sequence
1
STRIKE LOOKING
Four-seam FB
97 MPH
2
BALL
Four-seam FB
97 MPH
3
STRIKE FOUL
Cutter
85 MPH
4
STRIKE FOUL
Four-seam FB
98 MPH
5
STRIKE LOOKING
Cutter
86 MPH
Injury Report
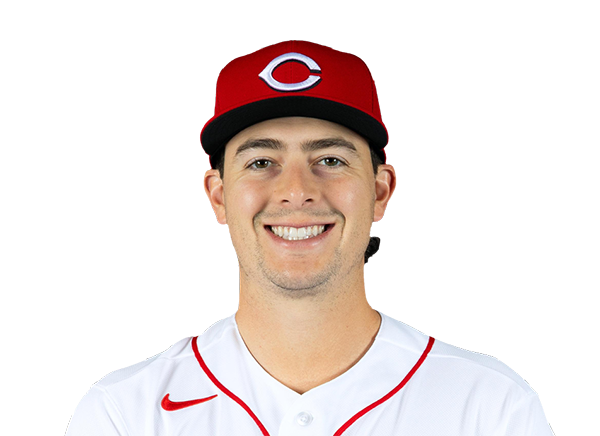

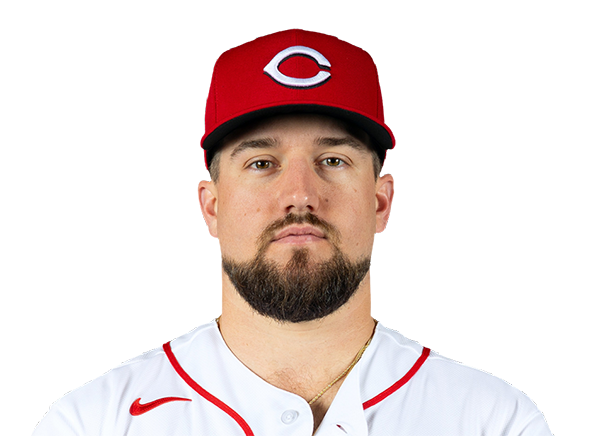
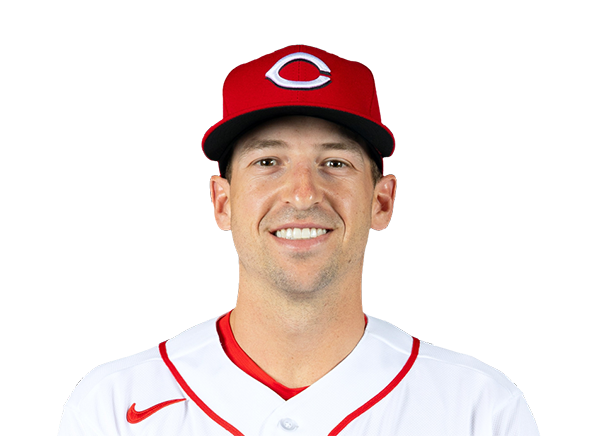

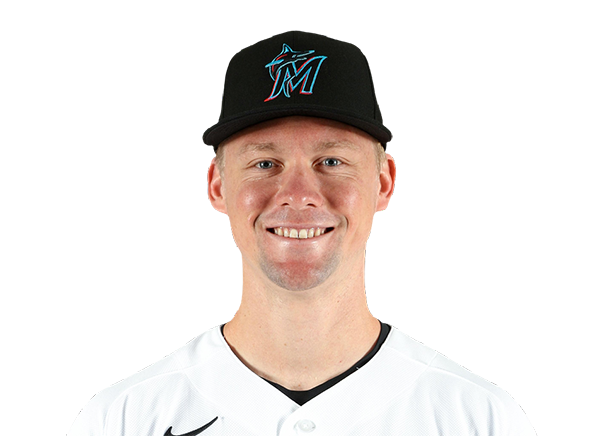
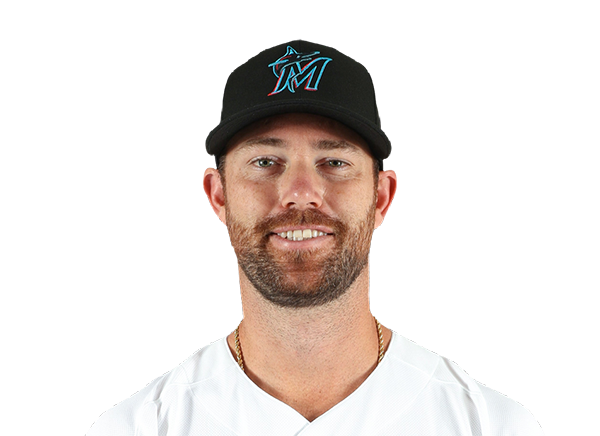
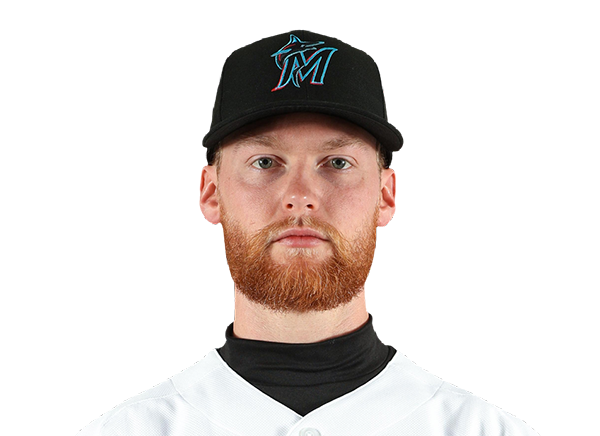
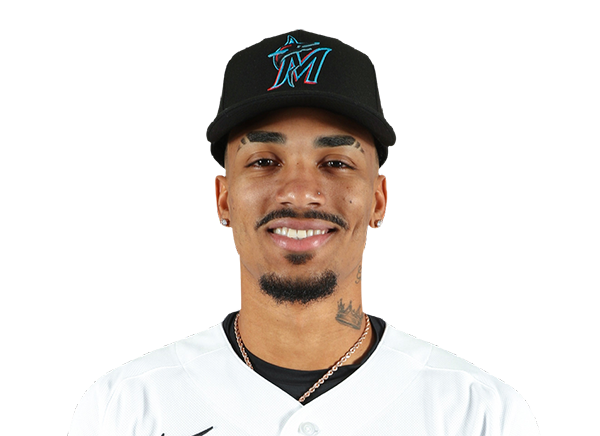

Team Stats
 CIN
MIA


4
Runs
7
9
Hits
12
2
Errors
1
1
Home Runs
2
2
Walks
2
11
Strikeouts
6
Player Box Score
Cincinnati Reds
| Player | H-AB | AB | R | H | RBI | HR | BB | K | #P | AVG | OBP | SLG |
|---|---|---|---|---|---|---|---|---|---|---|---|---|
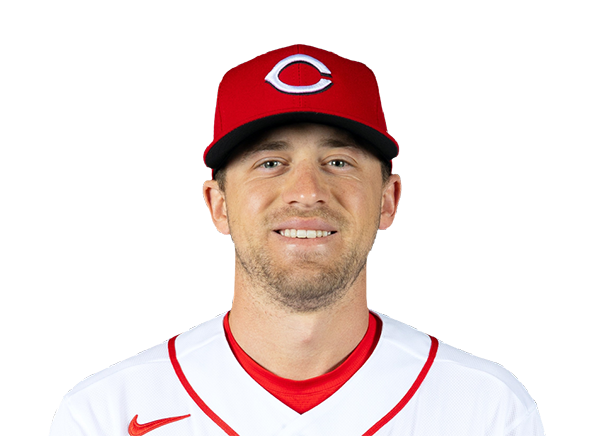 TJ Friedl | 3-5 | 5 | 0 | 3 | 0 | 0 | 0 | 0 | 23 | .186 | .314 | .186 |
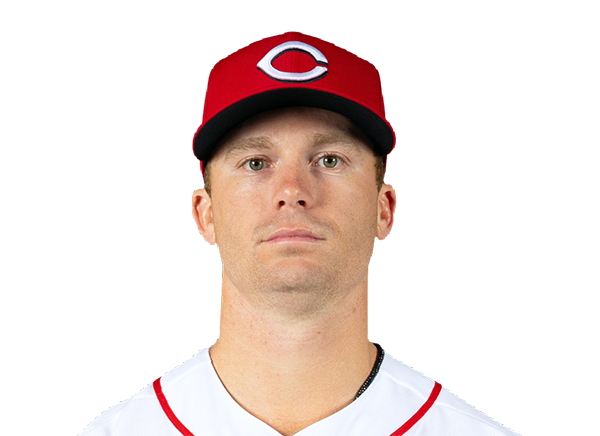 Matt McLain | 0-4 | 4 | 1 | 0 | 0 | 0 | 0 | 1 | 18 | .217 | .345 | .283 |
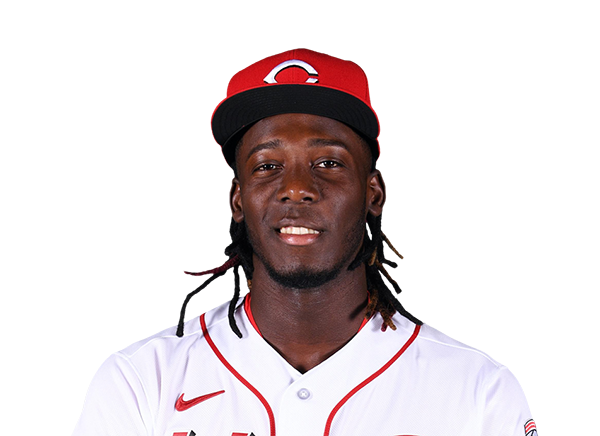 Elly De La Cruz | 0-3 | 3 | 1 | 0 | 0 | 0 | 1 | 1 | 16 | .234 | .321 | .447 |
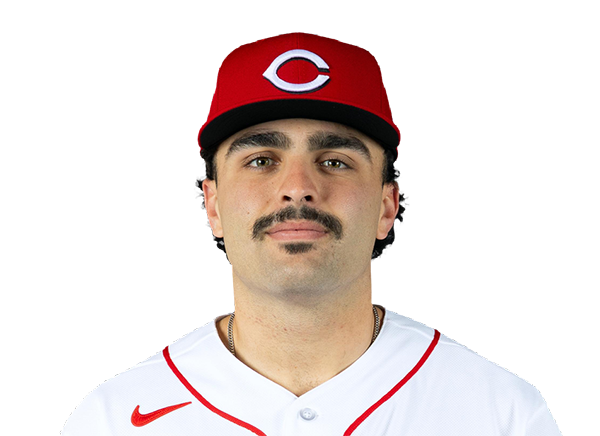 Sal Stewart | 2-4 | 4 | 2 | 2 | 2 | 1 | 0 | 0 | 22 | .366 | .471 | .683 |
 Eugenio Suarez | 2-4 | 4 | 0 | 2 | 1 | 0 | 0 | 1 | 12 | .222 | .271 | .378 |
 Will Benson | 0-4 | 4 | 0 | 0 | 0 | 0 | 0 | 3 | 20 | .192 | .222 | .308 |
 Tyler Stephenson | 1-3 | 3 | 0 | 1 | 0 | 0 | 1 | 1 | 21 | .167 | .242 | .367 |
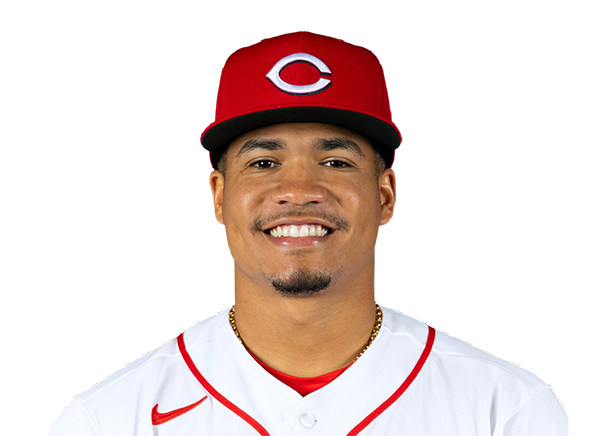 Noelvi Marte | 1-4 | 4 | 0 | 1 | 0 | 0 | 0 | 1 | 10 | .150 | .227 | .150 |
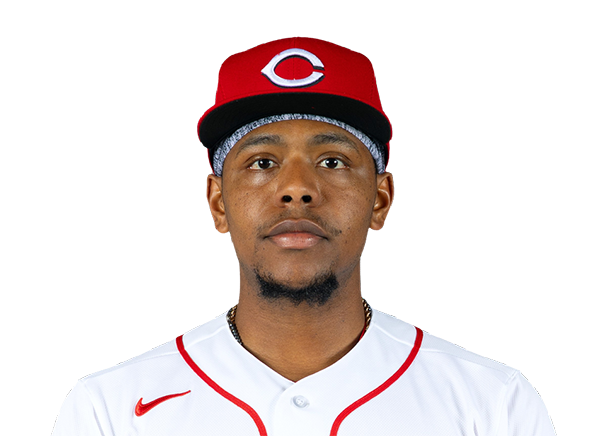 Ke'Bryan Hayes | 0-3 | 3 | 0 | 0 | 0 | 0 | 0 | 2 | 11 | .097 | .152 | .097 |
 Nathaniel Lowe | 0-1 | 1 | 0 | 0 | 0 | 0 | 0 | 1 | 4 | .273 | .273 | .364 |
Miami Marlins
| Player | H-AB | AB | R | H | RBI | HR | BB | K | #P | AVG | OBP | SLG |
|---|---|---|---|---|---|---|---|---|---|---|---|---|
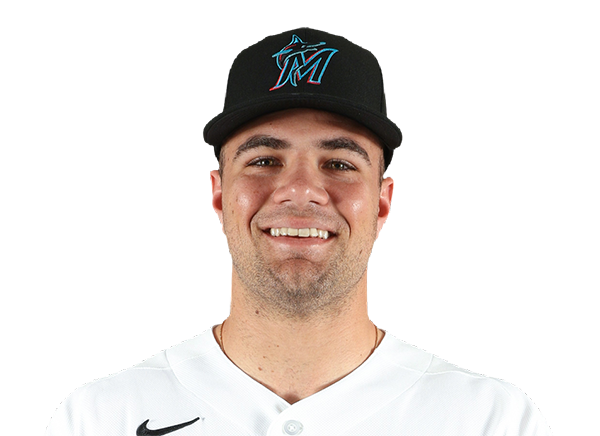 Jakob Marsee | 2-4 | 4 | 1 | 2 | 1 | 0 | 0 | 0 | 15 | .174 | .278 | .239 |
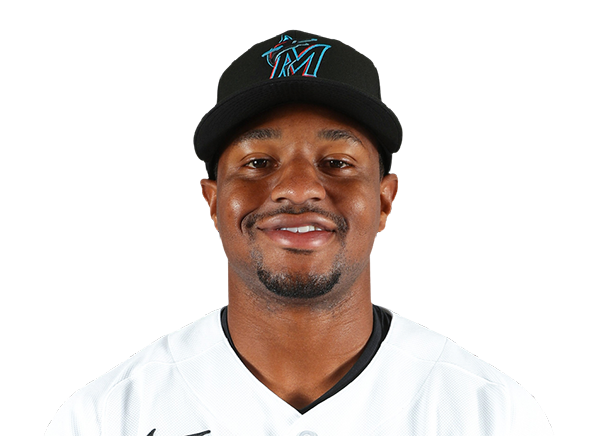 Xavier Edwards | 2-4 | 4 | 1 | 2 | 1 | 0 | 1 | 1 | 24 | .400 | .438 | .533 |
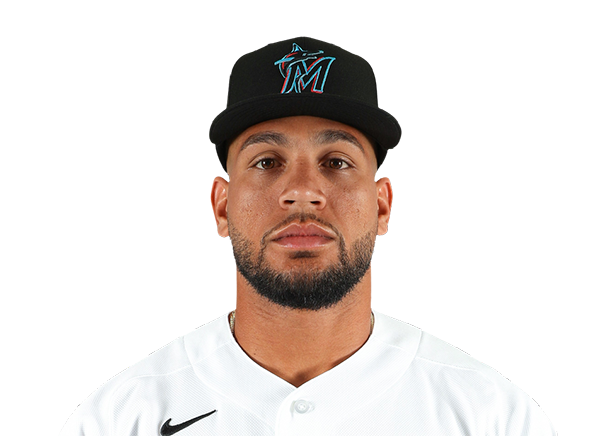 Agustin Ramirez | 1-4 | 4 | 1 | 1 | 1 | 0 | 0 | 0 | 15 | .231 | .362 | .359 |
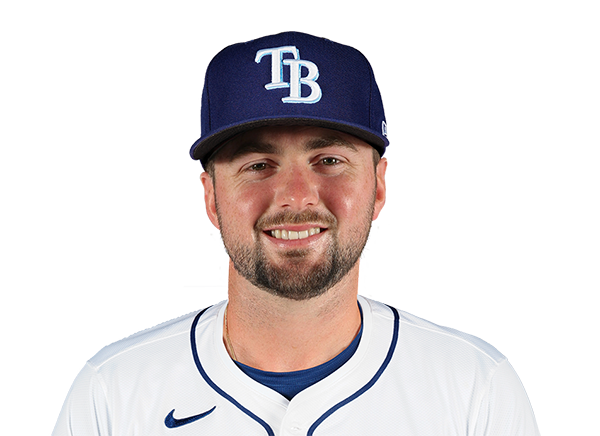 Liam Hicks | 2-4 | 4 | 1 | 2 | 1 | 0 | 0 | 0 | 22 | .323 | .389 | .645 |
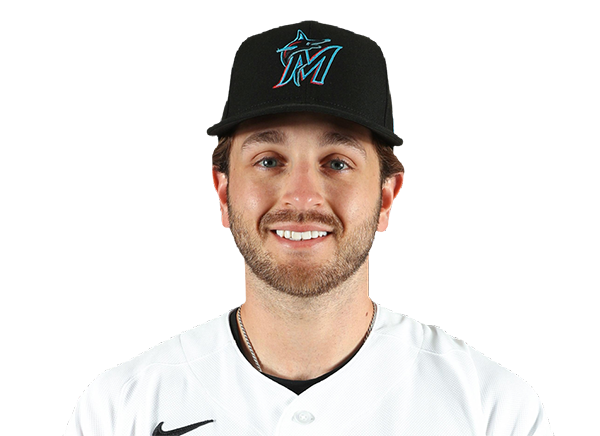 Connor Norby | 2-4 | 4 | 1 | 2 | 1 | 1 | 0 | 1 | 19 | .206 | .357 | .353 |
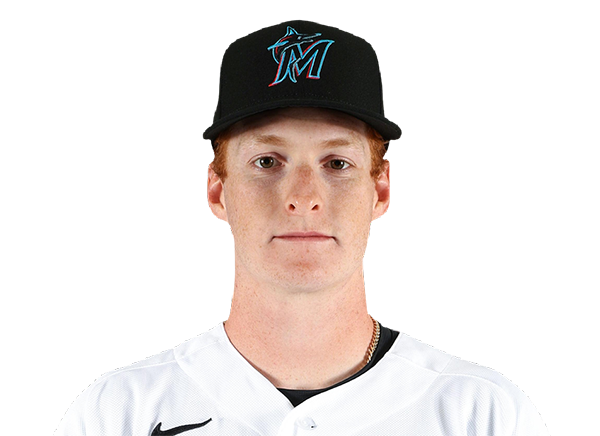 Owen Caissie | 0-3 | 3 | 0 | 0 | 0 | 0 | 0 | 1 | 15 | .267 | .343 | .533 |
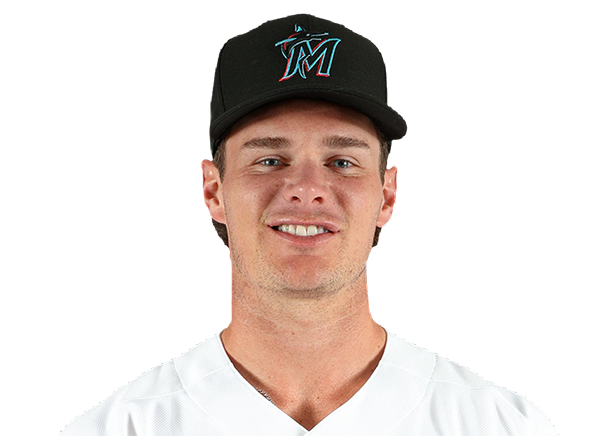 Griffin Conine | 2-4 | 4 | 2 | 2 | 2 | 1 | 0 | 1 | 13 | .300 | .391 | .650 |
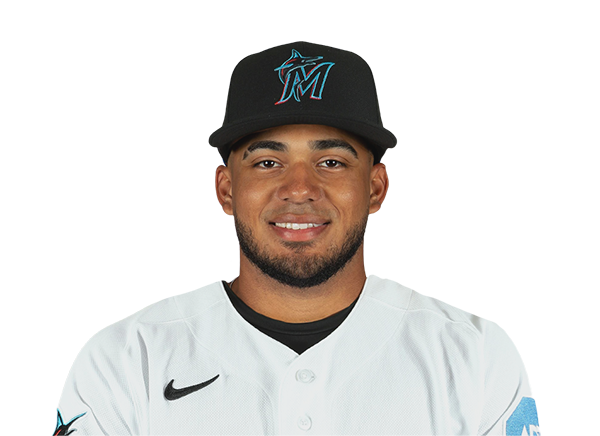 Leo Jimenez | 1-2 | 2 | 0 | 1 | 0 | 0 | 1 | 0 | 11 | .273 | .333 | .273 |
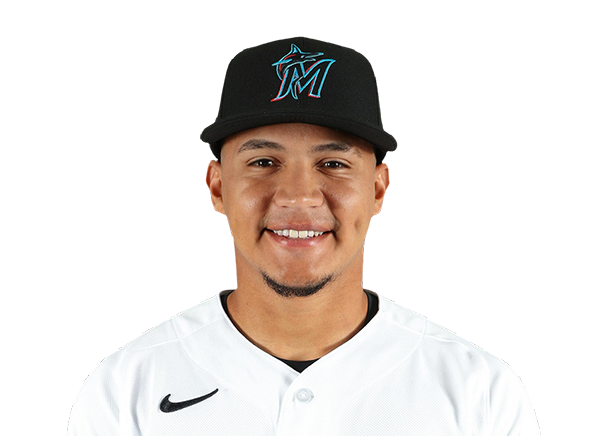 Javier Sanoja | 0-1 | 1 | 0 | 0 | 0 | 0 | 0 | 0 | 4 | .357 | .379 | .464 |
 Graham Pauley | 0-4 | 4 | 0 | 0 | 0 | 0 | 0 | 2 | 12 | .190 | .190 | .333 |
Cincinnati Reds
| Player | IP | H | R | ER | BB | K | HR | PC-ST | ERA | PC |
|---|---|---|---|---|---|---|---|---|---|---|
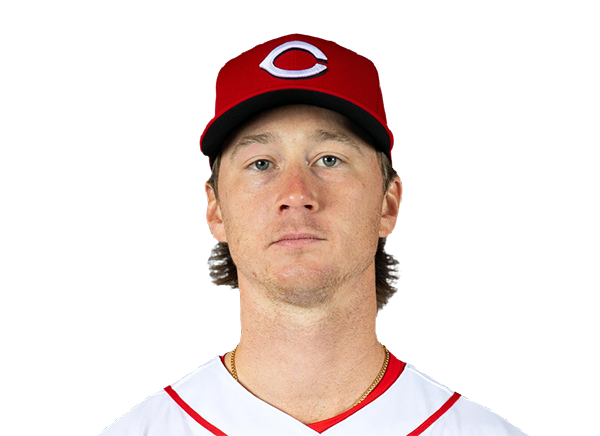 Brady Singer | 2.2 | 10 | 6 | 5 | 0 | 3 | 1 | 73-48 | 7.71 | 73 |
 Sam Moll | 2.1 | 0 | 0 | 0 | 0 | 2 | 0 | 28-18 | 0.00 | 28 |
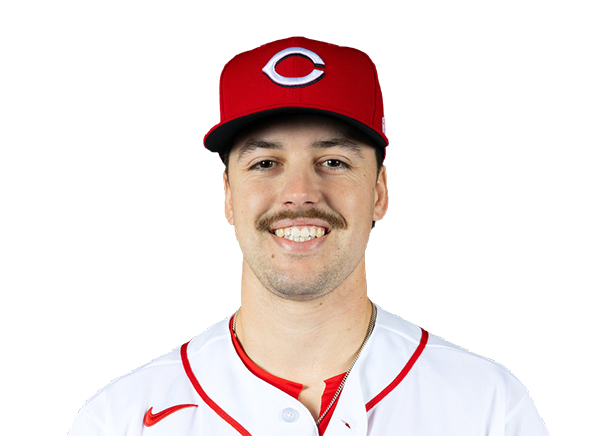 Connor Phillips | 2.0 | 1 | 1 | 1 | 2 | 0 | 1 | 39-22 | 3.86 | 39 |
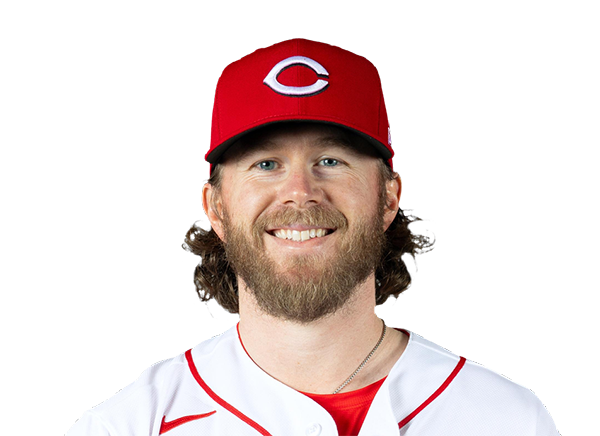 Pierce Johnson | 1.0 | 1 | 0 | 0 | 0 | 1 | 0 | 10-7 | 5.40 | 10 |
Miami Marlins
| Player | IP | H | R | ER | BB | K | HR | PC-ST | ERA | PC |
|---|---|---|---|---|---|---|---|---|---|---|
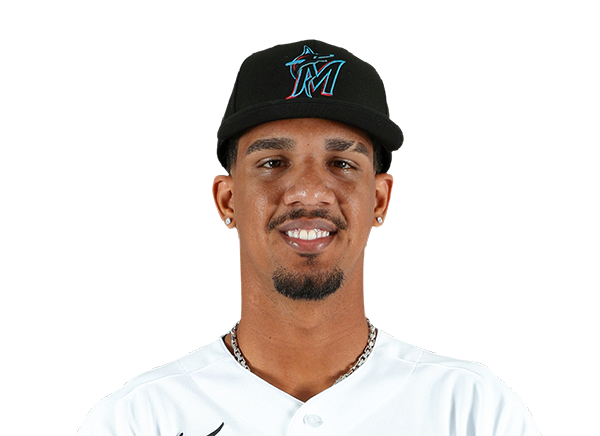 Eury Perez | 5.0 | 6 | 4 | 2 | 2 | 6 | 1 | 95-63 | 5.06 | 95 |
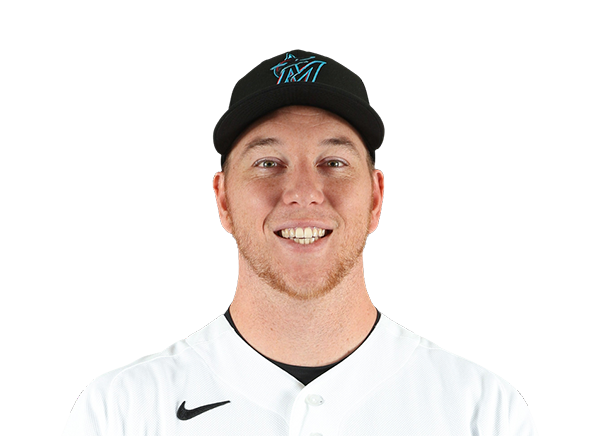 Ryan Gusto | 1.0 | 0 | 0 | 0 | 0 | 1 | 0 | 12-8 | 0.00 | 12 |
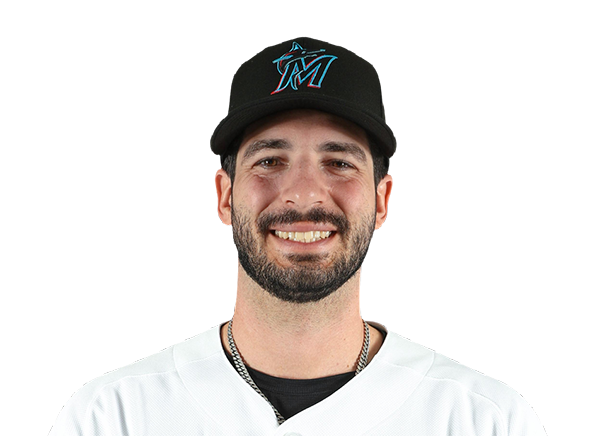 Andrew Nardi | 1.0 | 1 | 0 | 0 | 0 | 0 | 0 | 10-8 | 2.25 | 10 |
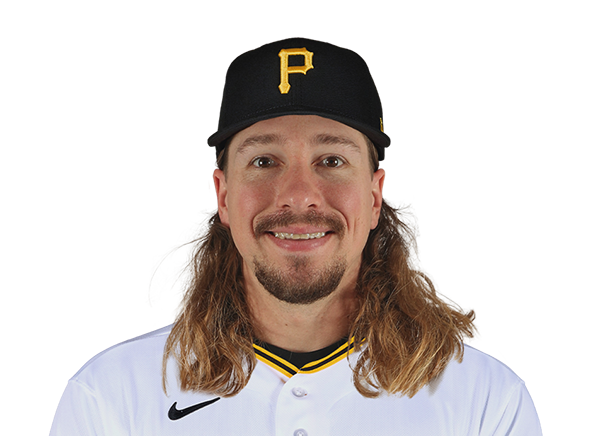 Lake Bachar | 1.0 | 0 | 0 | 0 | 0 | 2 | 0 | 18-11 | 5.40 | 18 |
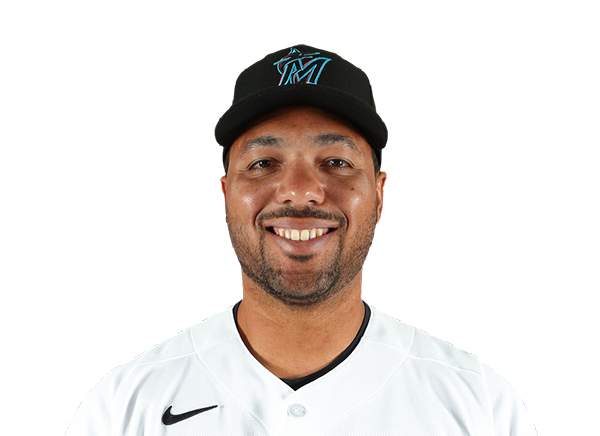 Michael Petersen | 1.0 | 2 | 0 | 0 | 0 | 2 | 0 | 22-17 | 5.40 | 22 |
H2H / Season Series
CIN1–7
MIA
CIN4–8
MIA
CIN1–0
MIA
MIA8–1
CIN
MIA7–4
CIN
MIA3–6
CIN
MIA0–2
CIN
Last 5 Games
| Date | Opponent | Result |
|---|---|---|
| Aug 21 |  @ ARI | L0–9 |
| Aug 20 |  vs STL | L9–10 |
| Aug 19 | vs STL | W5–4 |
| Aug 18 | vs STL | L0–3 |
| Aug 17 | vs STL | W6–5 |
| Date | Opponent | Result |
|---|---|---|
| Aug 22 |  vs WSH | W4–2 |
| Aug 21 | vs WSH | W3–2 |
| Aug 19 |  @ PHI | L1–4 |
| Aug 18 | @ PHI | L4–6 |
| Aug 17 | @ PHI | L5–6 |
Standings
American League
| Team | W | L | PCT | GB | DIFF | STRK |
|---|---|---|---|---|---|---|
1 Rays | 76 | 52 | .594 | - | +43 | L2 |
2 White Sox | 67 | 61 | .523 | 9 | +47 | W1 |
3 Astros | 65 | 64 | .504 | 11.5 | -42 | W1 |
4 Yankees | 73 | 56 | .566 | 3.5 | +95 | L1 |
5 Red Sox | 69 | 59 | .539 | 7 | +97 | W1 |
6 Rangers | 64 | 66 | .492 | 13 | -48 | L1 |
7 Blue Jays | 64 | 67 | .489 | 13.5 | -50 | W1 |
8 Twins | 63 | 66 | .488 | 13.5 | -45 | L1 |
9 Guardians | 63 | 66 | .488 | 13.5 | -15 | W2 |
10 Orioles | 62 | 67 | .481 | 14.5 | -34 | W1 |
11 Tigers | 61 | 68 | .473 | 15.5 | +77 | L4 |
12 Mariners | 61 | 68 | .473 | 15.5 | -45 | W1 |
13 Royals | 57 | 74 | .435 | 20.5 | -95 | W7 |
14 Angels | 52 | 78 | .400 | 25 | -68 | W1 |
15 Athletics | 49 | 80 | .380 | 27.5 | -189 | L5 |
National League
| Team | W | L | PCT | GB | DIFF | STRK |
|---|---|---|---|---|---|---|
1 Brewers | 81 | 49 | .623 | - | +163 | W3 |
2 Dodgers | 78 | 51 | .605 | 2.5 | +146 | W4 |
3 Braves | 75 | 55 | .577 | 6 | +108 | L2 |
4 Cubs | 74 | 55 | .574 | 6.5 | +99 | L2 |
| 5Phillies | 72 | 58 | .554 | 9 | +25 | W8 |
6 Padres | 69 | 60 | .535 | 11.5 | +7 | W1 |
| 7Diamondbacks | 68 | 61 | .527 | 12.5 | +13 | W2 |
| 8Marlins | 66 | 64 | .508 | 15 | +17 | W2 |
| 9Cardinals | 66 | 65 | .504 | 15.5 | 0 | L2 |
10 Pirates | 63 | 67 | .485 | 18 | +30 | L1 |
| 11Reds | 61 | 68 | .473 | 19.5 | -98 | L2 |
| 12Nationals | 61 | 70 | .466 | 20.5 | +14 | L3 |
13 Mets | 58 | 71 | .450 | 22.5 | -44 | L1 |
14 Giants | 52 | 76 | .406 | 28 | -78 | L2 |
15 Rockies | 50 | 78 | .391 | 30 | -130 | L4 |
CIN
VS
MIA
Pitchers
Brady Singer
Sam Moll
Connor Phillips
Pierce Johnson
Catchers
Tyler Stephenson
Infielders
Matt McLain
Elly De La Cruz
Sal Stewart
Ke'Bryan Hayes
Outfielders
TJ Friedl
Will Benson
Noelvi Marte
Designated Hitters
Eugenio Suarez
Other Players
Nathaniel Lowe
Pitchers
Eury Perez
Ryan Gusto
Andrew Nardi
Lake Bachar
Michael Petersen
Catchers
Liam Hicks
Infielders
Xavier Edwards
Connor Norby
Leo Jimenez
Javier Sanoja
Graham Pauley
Outfielders
Jakob Marsee
Owen Caissie
Griffin Conine
Designated Hitters
Agustin Ramirez
Reds
VS
Marlins
Batting
129
Team Games Played
129
4274
At Bats
4283
962
Hits
1068
499
Runs Batted In
540
165
Home Runs
131
89
Stolen Bases
131
.225
Batting Average
.249
523
Runs
563
182
Doubles
202
11
Triples
28
1661
Total Bases
1719
461
Walks
438
1228
Strikeouts
1053
.305
On Base Percentage
.326
.389
Slugging Percentage
.401
.693
OBP Pct + SLG Pct
.728
129
Games Played
129
129
Games Started
129
41
Hit By Pitch
69
0.0
Wins Above Replacement
0.0
0.0
Offensive Wins Above Replacement
0.0
30
Caught Stealing
42
1
Is Qualified
1
519.2
Runs Created
580.7
4.1
Runs Created Per 27 Outs
4.6
.096
Walks Per Plate Appearance
.090
0.38
Walk To Strikeout Ratio
0.42
.164
Isolated Power
.152
.285
Secondary Average
.275
3.94
Pitches Per Plate Appearance
3.81
358
Extra Base Hits
361
4821
Plate Appearances
4849
25.9
At Bats Per Home Run
32.7
14
Sacrifice Hit
19
28
Sacrifice Flies
39
Pitching
129
Team Games Played
129
43
Quality Starts
45
61
Wins
65
68
Losses
64
33
Saves
29
73
Holds
69
1083
Hits
989
575
Earned runs
495
160
Home Runs
129
536
Walks
429
1043
Strikeouts
1062
8.2
Strikeouts Per 9 Innings
8.5
153.5
Pitches Per Start
143.3
1.41
Walks Plus Hits Per Inning Pitched
1.25
4.51
Earned Run Average
3.94
68
Losses
64
1147.0
Innings pitched
1130.0
.473
Win Percentage
.504
53
Save Opportunities
46
.247
Opponent Batting Average
.233
.336
Opponent's On-base pct.
.311
.410
Opponent's Slugging pct.
.376
.746
Opponent's OPB Pct + SLG Pct
.686
4376
At Bats
4249
191
Doubles
182
21
Triples
19
65
Batters Hit
64
124
Stolen Bases
109
129
Games Played
129
0
Complete Games
1
8
Shutouts
12
37
Wild Pitches
37
600
Runs Batted In
519
2
Balks
4
1147.0
Innings pitched
1130.0
8.2
Strikeouts Per 9 Innings
8.5
26
Caught Stealing
33
129
Games Started
129
0.0
Wins Above Replacement
0.0
1
Is Qualified
1
621
Runs
548
575
Earned Runs
495
1796
Total Bases
1596
Fielding
129
Team Games Played
129
1147
Full Innings
1130
4552
Total Chances
4538
3441
Putouts
3390
1040
Assists
1066
71
Errors
82
182
Double Plays
202
0.984
Fielding Percentage
0.982
35.2
Range Factor
35.5
0.0
Zone Rating
0.0
129
Games Played
129
0
Games Started
0
0.0
Defensive Wins Above Replacement
0.0
1
Qualified
1