

Reds vs Nationals Live Score (9 Aug, 2026)
Game Information
Stage
Standard
Season
2026
First Pitch
Sun, Aug 9, 12:15 pm
Venue
Nationals Park
Location
Washington, District of Columbia
Attendance
21,375
Home Runs
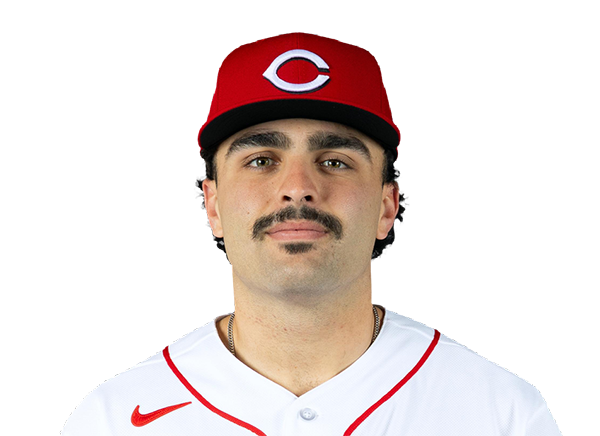
Sal Stewart
25 HR
.255 AVG
87 RBI
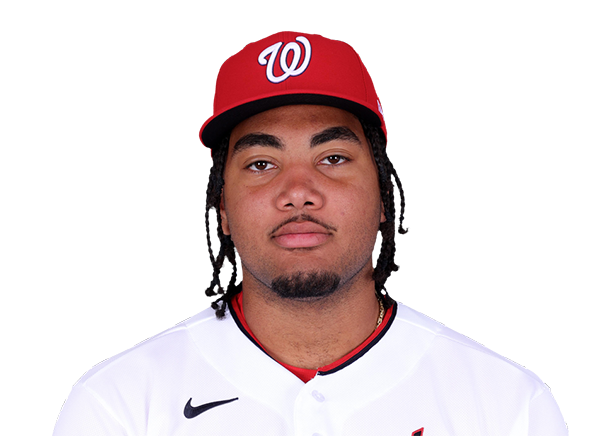
James Wood
30 HR
.265 AVG
73 RBI
Batting Average
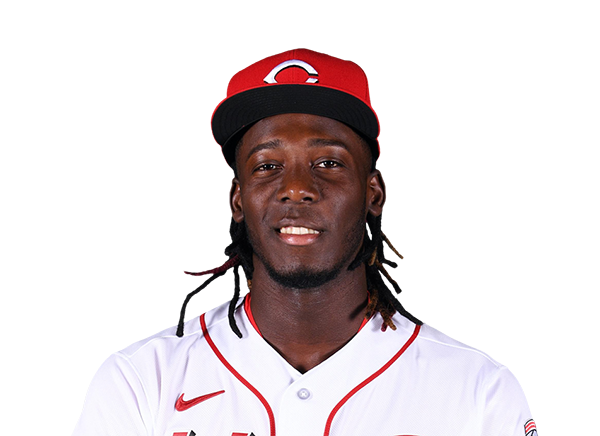
Elly De La Cruz
.274 AVG
.356 OBP
.504 SLG
CJ Abrams
.288 AVG
.361 OBP
.548 SLG

Runs Batted In
Sal Stewart
87 RBI
25 HR
.255 AVG
CJ Abrams
89 RBI
28 HR
.288 AVG
Earned Run Average
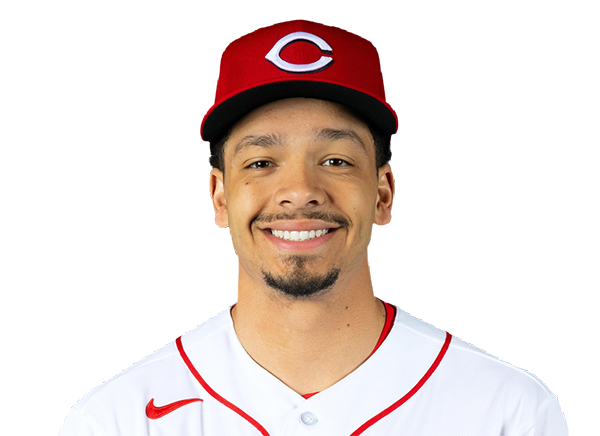
Chase Burns
2.61 ERA
13 W
143 K
Cade Cavalli
3.57 ERA
9 W
141 K
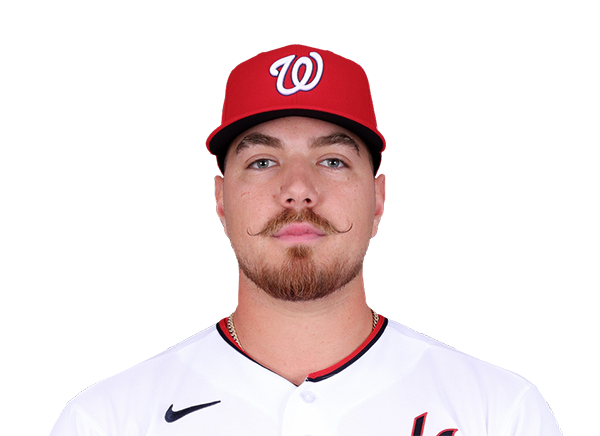
Wins
Chase Burns
13 W
2.61 ERA
143 K
Cade Cavalli
9 W
3.57 ERA
141 K
Strikeouts
Chase Burns
143 K
13 W
2.61 ERA
Cade Cavalli
141 K
9 W
3.57 ERA
Injury Report



Team Stats
 CIN
WSH


Array
Runs
Array
4
Hits
13
1
Errors
0
—
Home Runs
—
—
Walks
—
—
Strikeouts
—
Standings
American League
| Team | W | L | PCT | GB | DIFF | STRK |
|---|---|---|---|---|---|---|
1 Rays | 76 | 53 | .589 | - | +42 | L3 |
2 White Sox | 67 | 62 | .519 | 9 | +42 | L1 |
3 Astros | 65 | 65 | .500 | 11.5 | -43 | L1 |
4 Yankees | 73 | 56 | .566 | 3 | +95 | L1 |
5 Red Sox | 70 | 59 | .543 | 6 | +98 | W2 |
6 Rangers | 64 | 66 | .492 | 12.5 | -48 | L1 |
7 Guardians | 64 | 66 | .492 | 12.5 | -14 | W3 |
8 Blue Jays | 64 | 67 | .489 | 13 | -50 | W1 |
9 Twins | 63 | 67 | .485 | 13.5 | -47 | L2 |
10 Orioles | 63 | 67 | .485 | 13.5 | -33 | W2 |
11 Mariners | 62 | 68 | .477 | 14.5 | -44 | W2 |
12 Tigers | 61 | 68 | .473 | 15 | +77 | L4 |
13 Royals | 57 | 74 | .435 | 20 | -95 | W7 |
14 Angels | 52 | 78 | .400 | 24.5 | -68 | W1 |
15 Athletics | 50 | 80 | .385 | 26.5 | -188 | W1 |
National League
| Team | W | L | PCT | GB | DIFF | STRK |
|---|---|---|---|---|---|---|
1 Brewers | 81 | 49 | .623 | - | +163 | W3 |
2 Dodgers | 79 | 51 | .608 | 2 | +147 | W5 |
3 Braves | 75 | 55 | .577 | 6 | +108 | L2 |
4 Cubs | 74 | 56 | .569 | 7 | +98 | L3 |
5 Phillies | 72 | 58 | .554 | 9 | +25 | W8 |
6 Padres | 70 | 60 | .538 | 11 | +9 | W2 |
7 Diamondbacks | 68 | 62 | .523 | 13 | +7 | L1 |
8 Marlins | 66 | 64 | .508 | 15 | +17 | W2 |
9 Cardinals | 66 | 65 | .504 | 15.5 | 0 | L2 |
10 Pirates | 63 | 68 | .481 | 18.5 | +29 | L2 |
| 11Reds | 62 | 68 | .477 | 19 | -92 | W1 |
| 12Nationals | 61 | 70 | .466 | 20.5 | +14 | L3 |
13 Mets | 59 | 71 | .454 | 22 | -39 | W1 |
14 Giants | 52 | 77 | .403 | 28.5 | -79 | L3 |
15 Rockies | 50 | 79 | .388 | 30.5 | -131 | L5 |
CIN
VS
WSH
Pitchers

Brady Singer
Catchers

Tyler Stephenson
Infielders
Elly De La Cruz
Sal Stewart

Matt McLain
Ke'Bryan Hayes
Outfielders

JJ Bleday
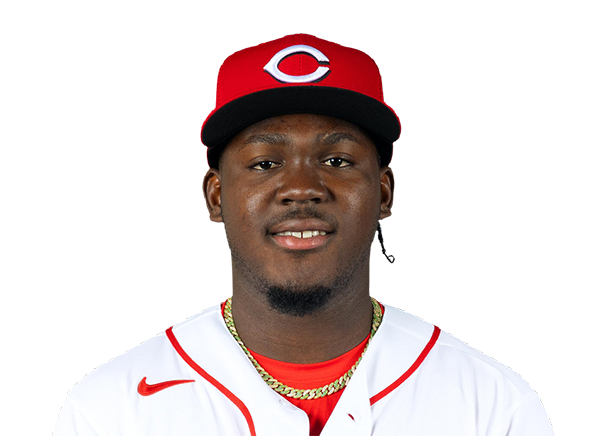
Hector Rodriguez
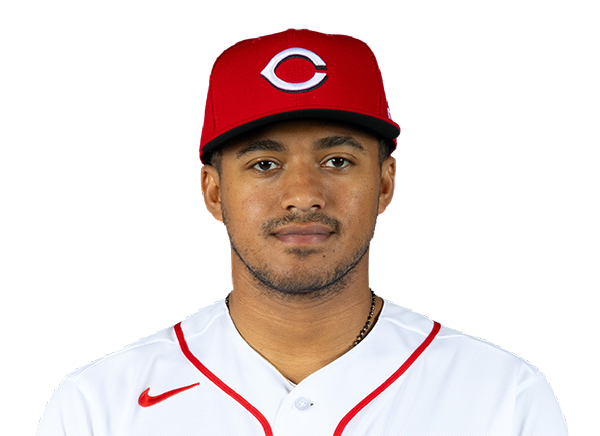
Dane Myers
Designated Hitters

Eugenio Suarez
Pitchers
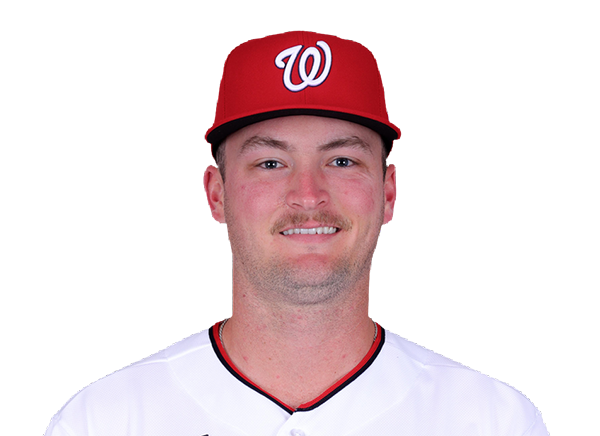
Brad Lord
Catchers
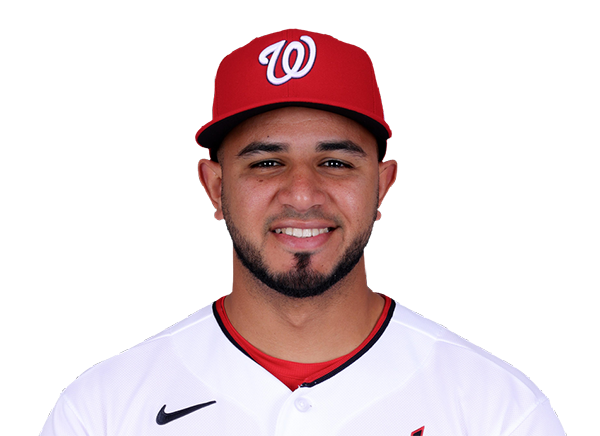
Keibert Ruiz
Infielders
CJ Abrams
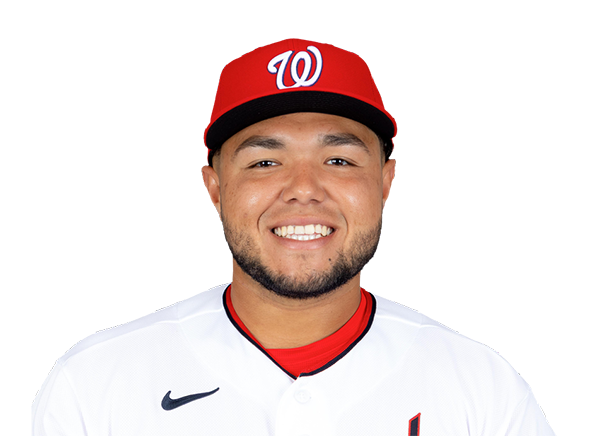
Abimelec Ortiz
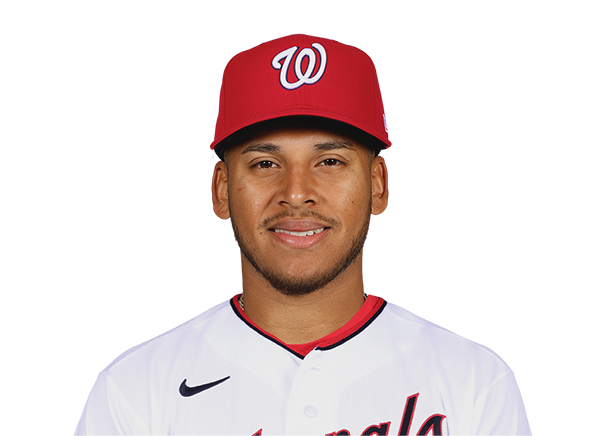
Jorbit Vivas
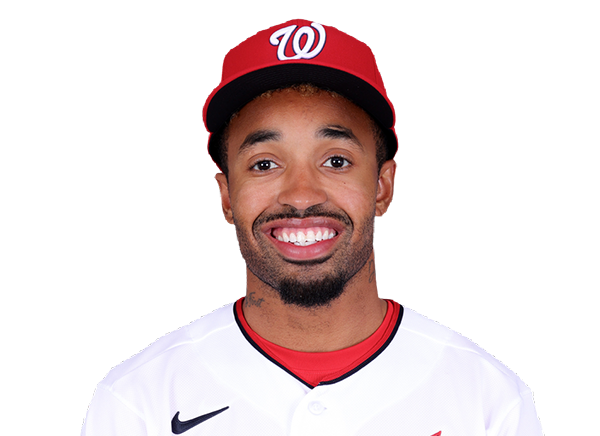
Nasim Nunez
Outfielders
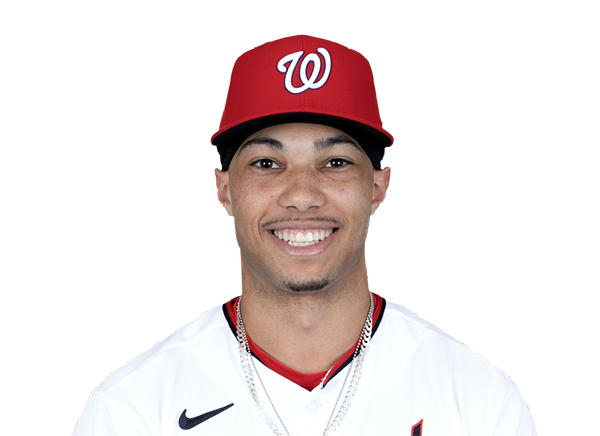
Daylen Lile

Dylan Crews
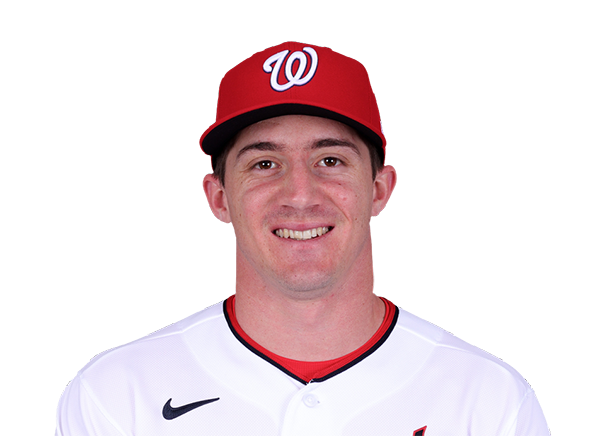
Jacob Young
Designated Hitters
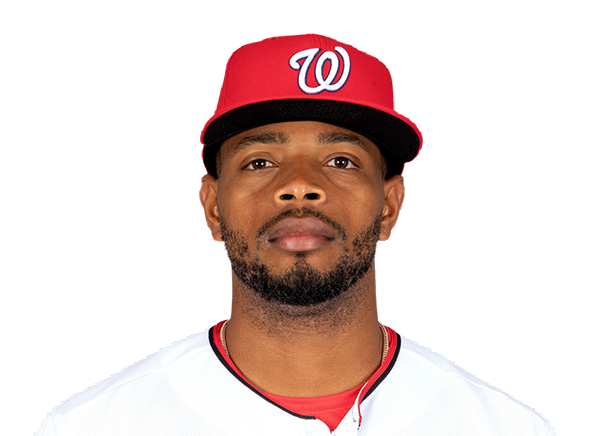
Jose Tena
Reds
VS
Nationals
Batting
117
Team Games Played
120
3893
At Bats
4113
890
Hits
1034
459
Runs Batted In
614
154
Home Runs
171
85
Stolen Bases
130
.229
Batting Average
.251
482
Runs
643
172
Doubles
209
11
Triples
25
1546
Total Bases
1806
424
Walks
424
1113
Strikeouts
996
.309
On Base Percentage
.328
.397
Slugging Percentage
.439
.706
OBP Pct + SLG Pct
.767
117
Games Played
120
117
Games Started
120
37
Hit By Pitch
57
0.0
Wins Above Replacement
0.0
0.0
Offensive Wins Above Replacement
0.0
26
Caught Stealing
29
1
Is Qualified
1
489.7
Runs Created
610.8
4.2
Runs Created Per 27 Outs
5.1
.096
Walks Per Plate Appearance
.091
0.38
Walk To Strikeout Ratio
0.43
.169
Isolated Power
.188
.293
Secondary Average
.315
3.93
Pitches Per Plate Appearance
3.81
337
Extra Base Hits
405
4396
Plate Appearances
4639
25.3
At Bats Per Home Run
24.1
14
Sacrifice Hit
14
25
Sacrifice Flies
28
Pitching
117
Team Games Played
120
40
Quality Starts
27
56
Wins
59
61
Losses
61
29
Saves
33
66
Holds
63
971
Hits
1068
517
Earned runs
560
146
Home Runs
165
490
Walks
417
936
Strikeouts
904
8.1
Strikeouts Per 9 Innings
7.6
152.8
Pitches Per Start
151.1
1.41
Walks Plus Hits Per Inning Pitched
1.39
4.48
Earned Run Average
4.71
61
Losses
61
1039.0
Innings pitched
1070.2
.479
Win Percentage
.492
47
Save Opportunities
64
.246
Opponent Batting Average
.259
.334
Opponent's On-base pct.
.333
.409
Opponent's Slugging pct.
.430
.743
Opponent's OPB Pct + SLG Pct
.763
3950
At Bats
4125
166
Doubles
194
20
Triples
8
55
Batters Hit
63
111
Stolen Bases
86
117
Games Played
120
0
Complete Games
0
7
Shutouts
3
31
Wild Pitches
42
538
Runs Batted In
597
2
Balks
1
1039.0
Innings pitched
1070.2
8.1
Strikeouts Per 9 Innings
7.6
24
Caught Stealing
27
117
Games Started
120
0.0
Wins Above Replacement
0.0
1
Is Qualified
1
556
Runs
619
517
Earned Runs
560
1615
Total Bases
1773
Fielding
117
Team Games Played
120
1039
Full Innings
1071
4130
Total Chances
4422
3117
Putouts
3212
950
Assists
1122
63
Errors
88
172
Double Plays
209
0.985
Fielding Percentage
0.980
35.2
Range Factor
36.4
0.0
Zone Rating
0.0
117
Games Played
120
0
Games Started
0
0.0
Defensive Wins Above Replacement
0.0
1
Qualified
1