

Reds vs White Sox Live Score (12 Aug, 2026)
Game Information
Stage
Standard
Season
2026
First Pitch
Wed, Aug 12, 7:40 pm
Venue
Rate Field
Location
Chicago, Illinois
Attendance
24,099
Home Runs
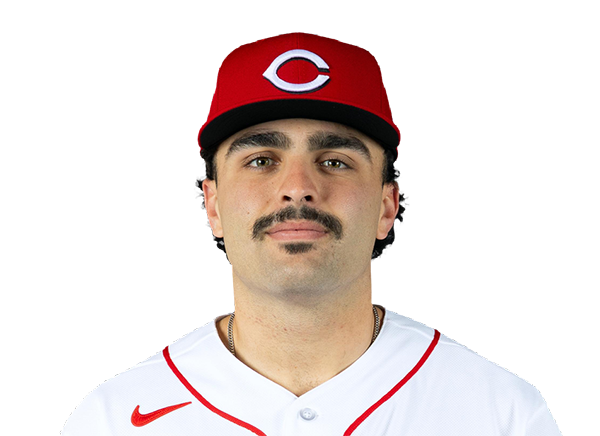
Sal Stewart
25 HR
.254 AVG
87 RBI
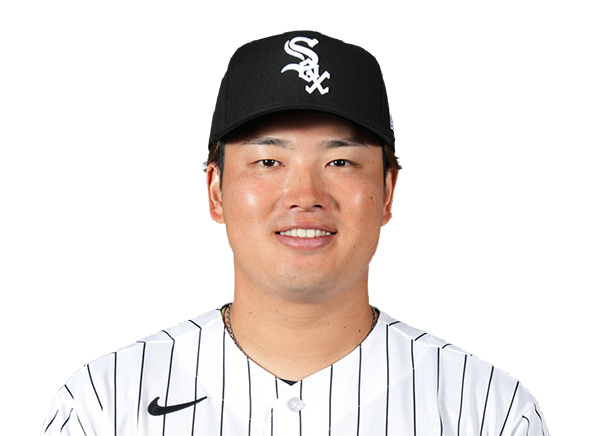
Munetaka Murakami
26 HR
.237 AVG
54 RBI
Batting Average
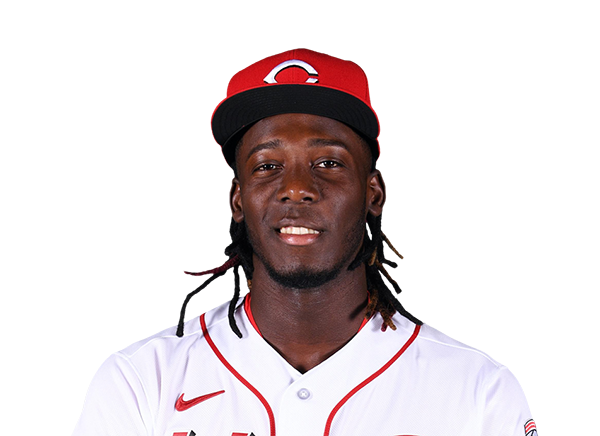
Elly De La Cruz
.271 AVG
.351 OBP
.496 SLG
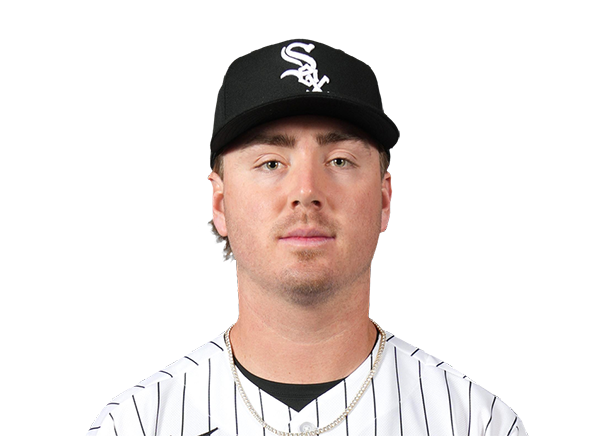
Chase Meidroth
.274 AVG
.350 OBP
.404 SLG
Runs Batted In
Sal Stewart
87 RBI
25 HR
.254 AVG
Miguel Vargas
68 RBI
25 HR
.235 AVG
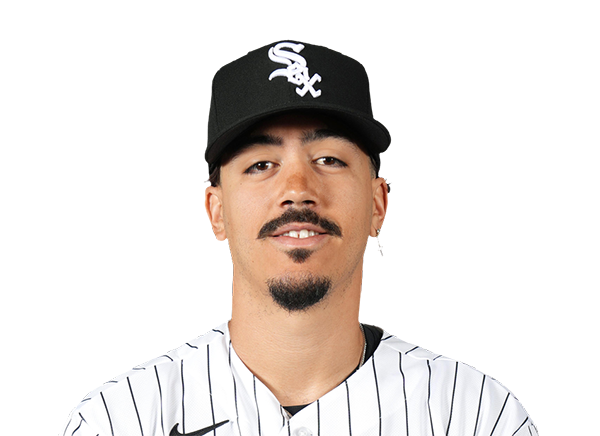
Earned Run Average
Chase Burns
2.61 ERA
13 W
143 K
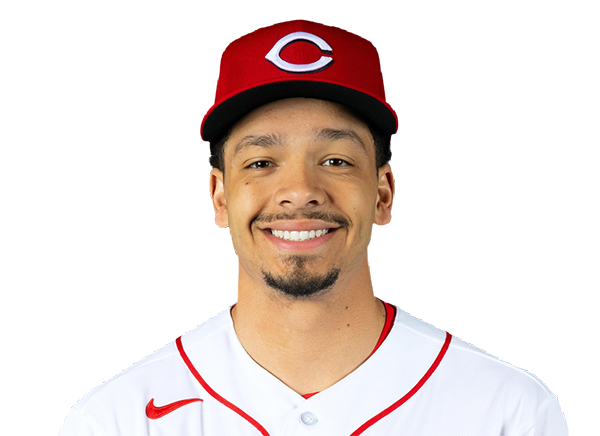
Sean Burke
2.99 ERA
7 W
152 K
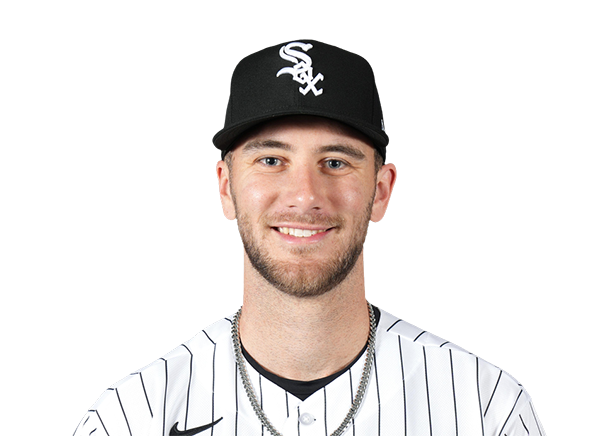
Wins
Chase Burns
13 W
2.61 ERA
143 K
Davis Martin
9 W
4.17 ERA
108 K
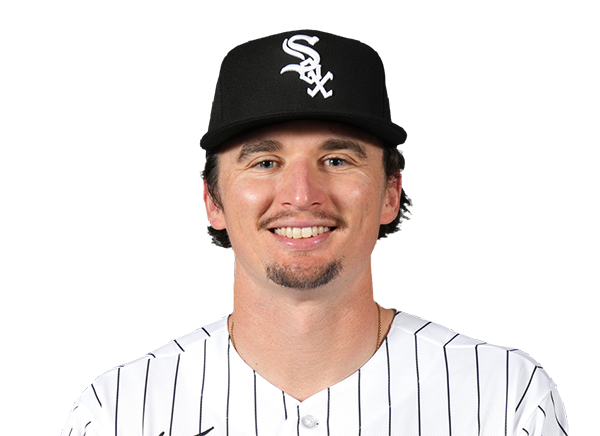
Strikeouts
Chase Burns
143 K
13 W
2.61 ERA
Sean Burke
152 K
7 W
2.99 ERA
Injury Report

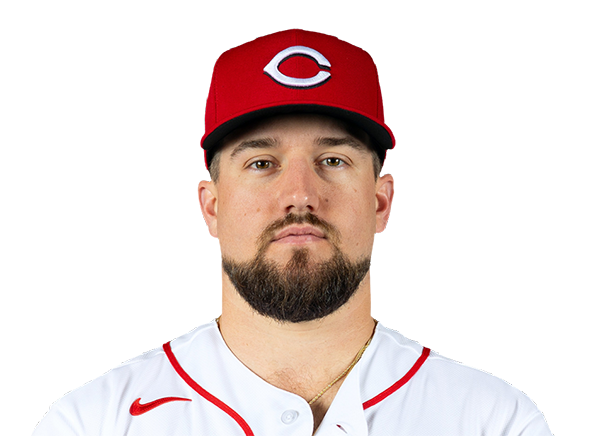
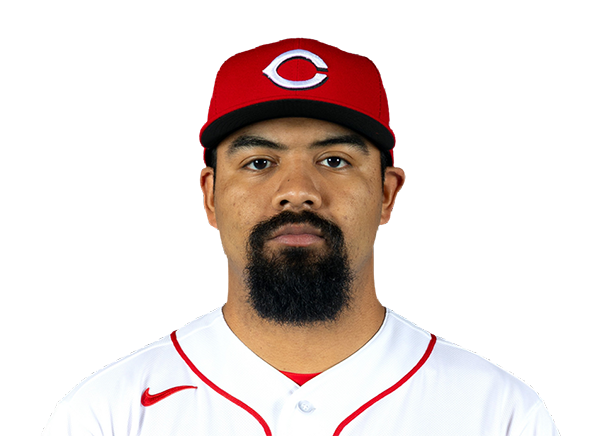
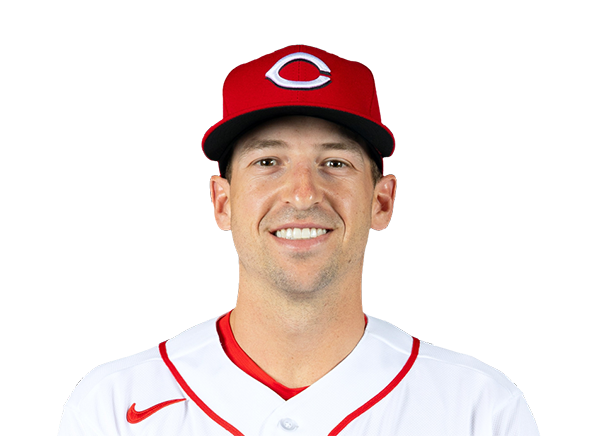

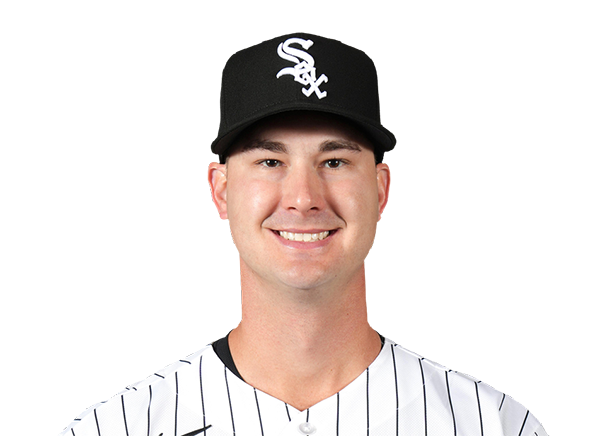


Team Stats
 CIN
CHW


Array
Runs
Array
2
Hits
11
0
Errors
0
—
Home Runs
—
—
Walks
—
—
Strikeouts
—
Standings
American League
| Team | W | L | PCT | GB | DIFF | STRK |
|---|---|---|---|---|---|---|
1 Rays | 76 | 53 | .589 | - | +42 | L3 |
| 2White Sox | 67 | 62 | .519 | 9 | +42 | L1 |
3 Astros | 65 | 65 | .500 | 11.5 | -43 | L1 |
4 Yankees | 73 | 56 | .566 | 3 | +95 | L1 |
5 Red Sox | 70 | 59 | .543 | 6 | +98 | W2 |
6 Rangers | 64 | 66 | .492 | 12.5 | -48 | L1 |
7 Blue Jays | 64 | 67 | .489 | 13 | -50 | W1 |
8 Twins | 63 | 66 | .488 | 13 | -45 | L1 |
9 Guardians | 63 | 66 | .488 | 13 | -15 | W2 |
10 Orioles | 63 | 67 | .485 | 13.5 | -33 | W2 |
11 Mariners | 62 | 68 | .477 | 14.5 | -44 | W2 |
12 Tigers | 61 | 68 | .473 | 15 | +77 | L4 |
13 Royals | 57 | 74 | .435 | 20 | -95 | W7 |
14 Angels | 52 | 78 | .400 | 24.5 | -68 | W1 |
15 Athletics | 50 | 80 | .385 | 26.5 | -188 | W1 |
National League
| Team | W | L | PCT | GB | DIFF | STRK |
|---|---|---|---|---|---|---|
1 Brewers | 81 | 49 | .623 | - | +163 | W3 |
2 Dodgers | 79 | 51 | .608 | 2 | +147 | W5 |
3 Braves | 75 | 55 | .577 | 6 | +108 | L2 |
4 Cubs | 74 | 56 | .569 | 7 | +98 | L3 |
5 Phillies | 72 | 58 | .554 | 9 | +25 | W8 |
6 Padres | 69 | 60 | .535 | 11.5 | +7 | W1 |
7 Diamondbacks | 68 | 61 | .527 | 12.5 | +13 | W2 |
8 Marlins | 66 | 64 | .508 | 15 | +17 | W2 |
9 Cardinals | 66 | 65 | .504 | 15.5 | 0 | L2 |
10 Pirates | 63 | 68 | .481 | 18.5 | +29 | L2 |
| 11Reds | 61 | 68 | .473 | 19.5 | -98 | L2 |
12 Nationals | 61 | 70 | .466 | 20.5 | +14 | L3 |
13 Mets | 59 | 71 | .454 | 22 | -39 | W1 |
14 Giants | 52 | 77 | .403 | 28.5 | -79 | L3 |
15 Rockies | 50 | 78 | .391 | 30 | -130 | L4 |
CIN
VS
CHW
Pitchers
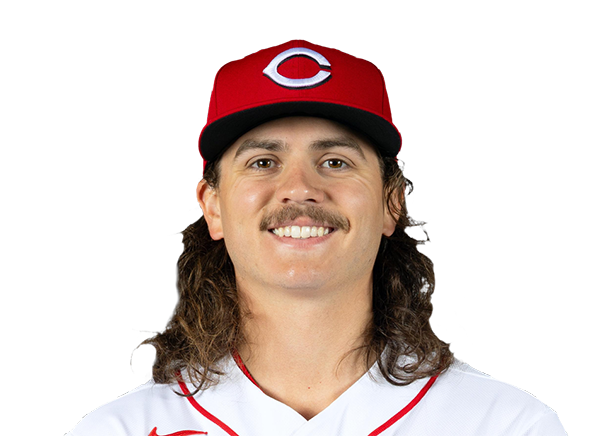
Rhett Lowder
Catchers
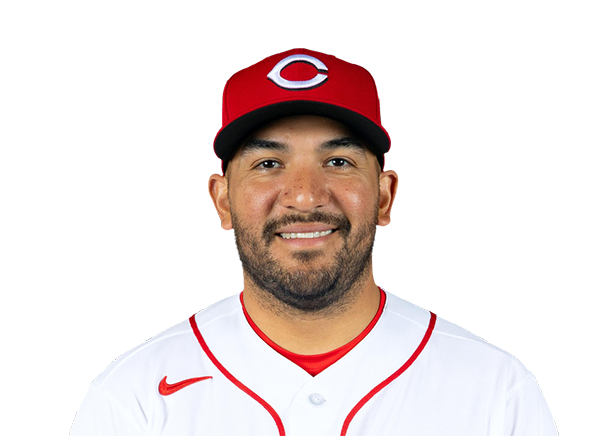
Jose Trevino
Infielders
Elly De La Cruz

Eugenio Suarez

Michael Toglia

Matt McLain
Outfielders

JJ Bleday
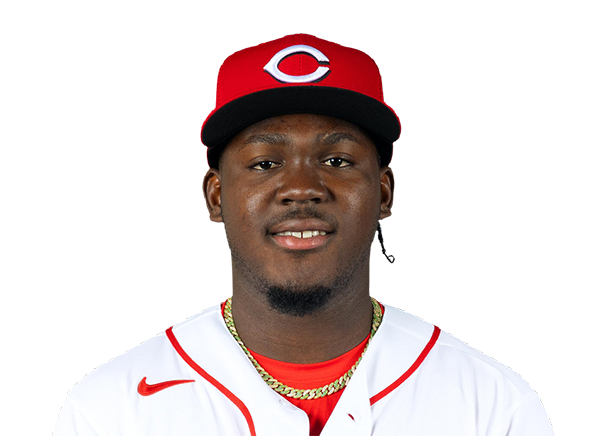
Hector Rodriguez

TJ Friedl
Designated Hitters
Sal Stewart
Pitchers
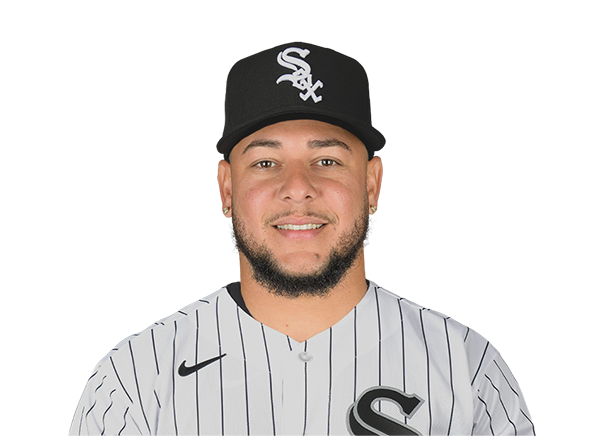
Luis Castillo
Catchers
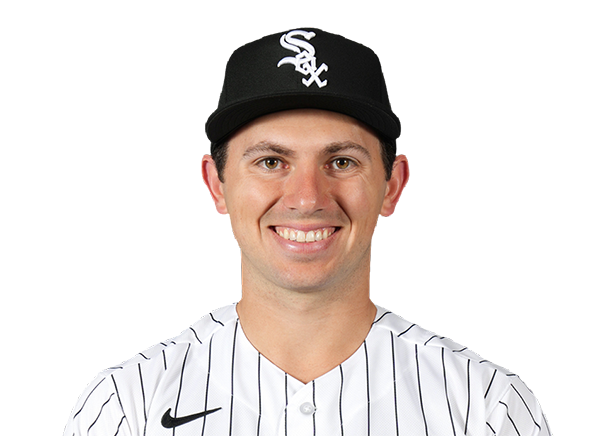
Drew Romo
Infielders
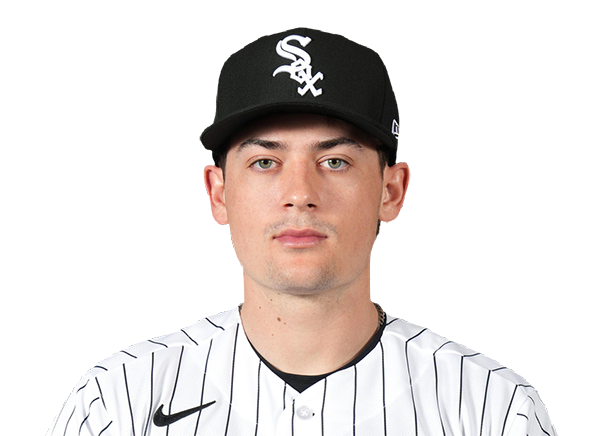
Sam Antonacci
Munetaka Murakami

Colson Montgomery
Chase Meidroth
Outfielders
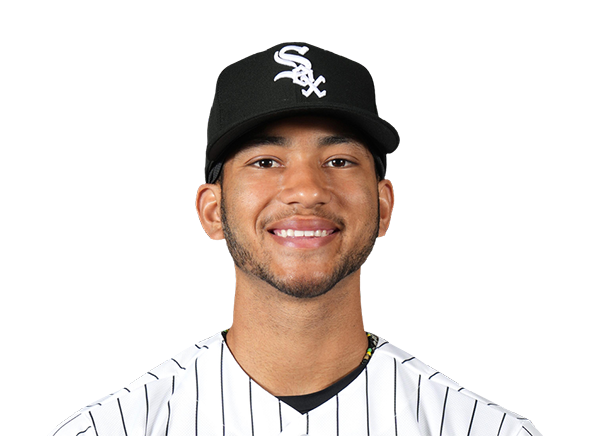
Braden Montgomery
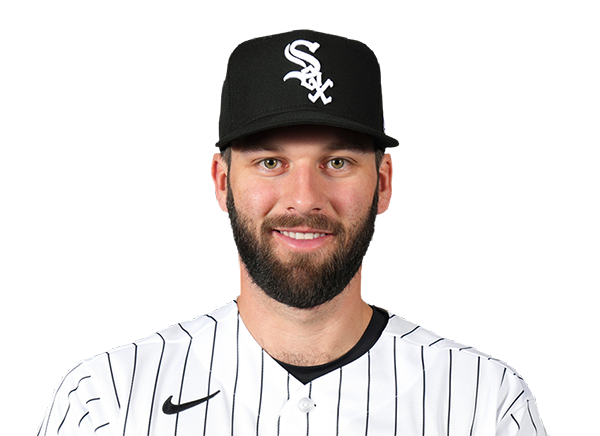
Tristan Peters

Brenton Doyle
Designated Hitters
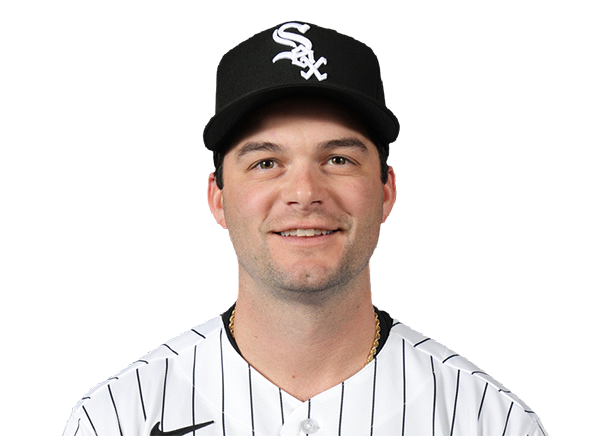
Andrew Benintendi
Reds
VS
White Sox
Batting
119
Team Games Played
119
3957
At Bats
3994
899
Hits
947
464
Runs Batted In
539
155
Home Runs
157
85
Stolen Bases
69
.227
Batting Average
.237
487
Runs
566
173
Doubles
185
11
Triples
11
1559
Total Bases
1625
428
Walks
404
1136
Strikeouts
1084
.307
On Base Percentage
.316
.394
Slugging Percentage
.407
.701
OBP Pct + SLG Pct
.723
119
Games Played
119
119
Games Started
119
37
Hit By Pitch
71
0.0
Wins Above Replacement
0.0
0.0
Offensive Wins Above Replacement
0.0
27
Caught Stealing
30
1
Is Qualified
1
490.6
Runs Created
529.8
4.1
Runs Created Per 27 Outs
4.5
.096
Walks Per Plate Appearance
.089
0.38
Walk To Strikeout Ratio
0.37
.167
Isolated Power
.170
.290
Secondary Average
.281
3.93
Pitches Per Plate Appearance
3.85
339
Extra Base Hits
353
4465
Plate Appearances
4524
25.5
At Bats Per Home Run
25.4
14
Sacrifice Hit
24
26
Sacrifice Flies
29
Pitching
119
Team Games Played
119
40
Quality Starts
31
57
Wins
62
62
Losses
57
30
Saves
30
66
Holds
50
988
Hits
946
526
Earned runs
480
151
Home Runs
128
493
Walks
431
953
Strikeouts
1011
8.1
Strikeouts Per 9 Innings
8.6
152.6
Pitches Per Start
151.0
1.40
Walks Plus Hits Per Inning Pitched
1.30
4.48
Earned Run Average
4.07
62
Losses
57
1057.0
Innings pitched
1062.1
.479
Win Percentage
.521
48
Save Opportunities
53
.246
Opponent Batting Average
.238
.334
Opponent's On-base pct.
.321
.411
Opponent's Slugging pct.
.388
.744
Opponent's OPB Pct + SLG Pct
.709
4020
At Bats
3972
171
Doubles
177
20
Triples
17
56
Batters Hit
72
112
Stolen Bases
98
119
Games Played
119
0
Complete Games
0
7
Shutouts
8
32
Wild Pitches
52
546
Runs Batted In
504
2
Balks
8
1057.0
Innings pitched
1062.1
8.1
Strikeouts Per 9 Innings
8.6
24
Caught Stealing
33
119
Games Started
119
0.0
Wins Above Replacement
0.0
1
Is Qualified
1
565
Runs
525
526
Earned Runs
480
1652
Total Bases
1541
Fielding
119
Team Games Played
119
1057
Full Innings
1062
4198
Total Chances
4230
3171
Putouts
3187
964
Assists
978
63
Errors
65
173
Double Plays
185
0.985
Fielding Percentage
0.985
35.2
Range Factor
35.3
0.0
Zone Rating
0.0
119
Games Played
119
0
Games Started
0
0.0
Defensive Wins Above Replacement
0.0
1
Qualified
1