

Rockies vs Angels Live Score (3 Jun, 2026)
Game Information
Stage
Standard
Season
2026
First Pitch
Tue, Jun 2, 9:38 pm
Venue
Angel Stadium
Location
Anaheim, California
Attendance
26,426
Live Situation
1Balls
2Strikes
0Outs
—Pitcher
—At Bat
Pitch Sequence
1
STRIKE SWINGING
Four-seam FB
99 MPH
2
STRIKE FOUL
Four-seam FB
99 MPH
3
STRIKE FOUL
Sinker
95 MPH
4
BALL
Four-seam FB
99 MPH
5
BALL IN PLAY
Four-seam FB
98 MPH
Injury Report

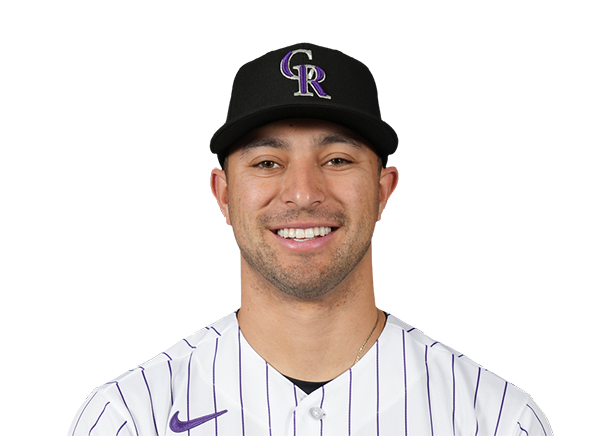
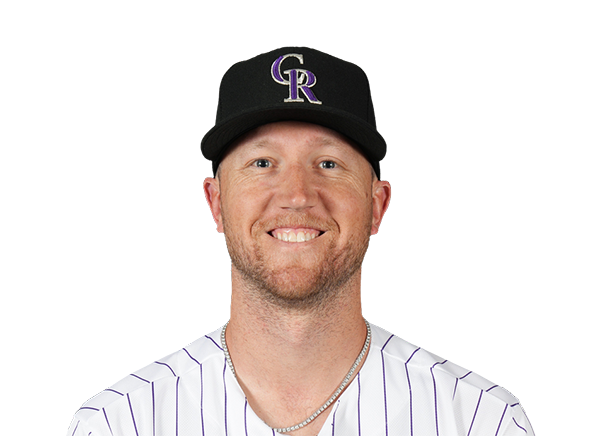

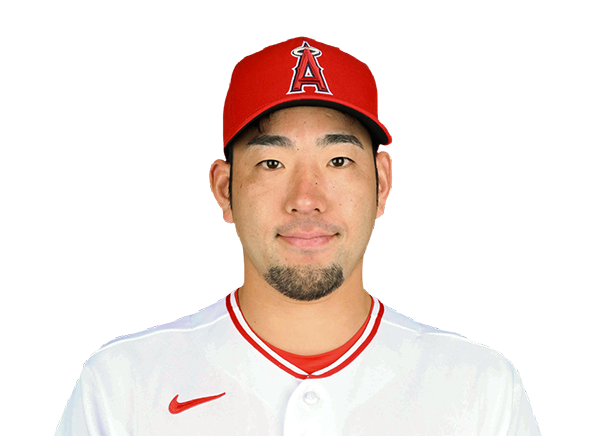
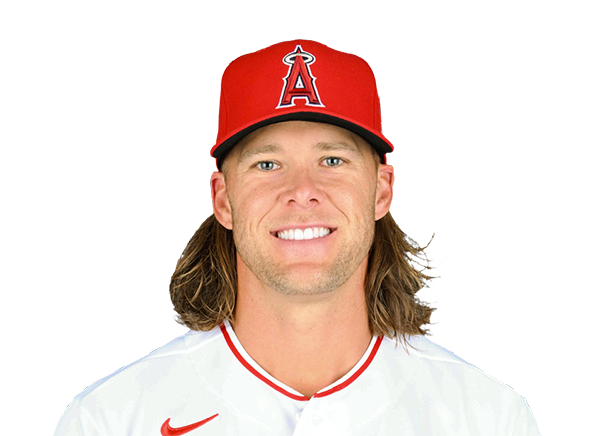
Team Stats
 COL
LAA


8
Runs
2
11
Hits
7
0
Errors
3
2
Home Runs
0
5
Walks
2
8
Strikeouts
8
Player Box Score
Colorado Rockies
| Player | H-AB | AB | R | H | RBI | HR | BB | K | #P | AVG | OBP | SLG |
|---|---|---|---|---|---|---|---|---|---|---|---|---|
 Jake McCarthy | 2-5 | 5 | 1 | 2 | 1 | 0 | 0 | 1 | 23 | .291 | .337 | .477 |
 Willi Castro | 1-5 | 5 | 1 | 1 | 3 | 1 | 0 | 2 | 20 | .260 | .328 | .364 |
 TJ Rumfield | 1-5 | 5 | 1 | 1 | 0 | 0 | 0 | 1 | 13 | .282 | .356 | .437 |
 Hunter Goodman | 2-4 | 4 | 1 | 2 | 1 | 1 | 1 | 1 | 18 | .243 | .311 | .500 |
 Troy Johnston | 2-4 | 4 | 1 | 2 | 0 | 0 | 1 | 0 | 23 | .316 | .374 | .430 |
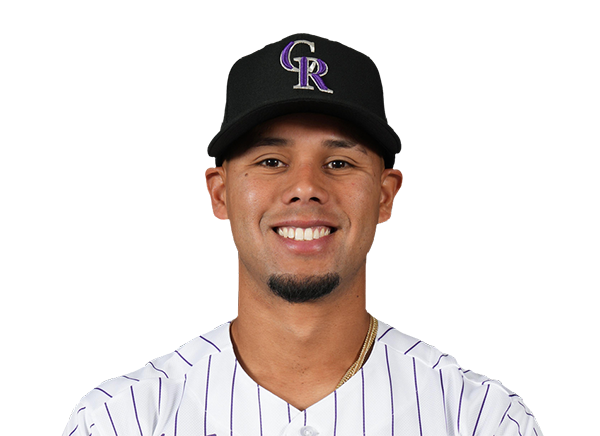 Ezequiel Tovar | 0-4 | 4 | 0 | 0 | 1 | 0 | 0 | 1 | 16 | .212 | .261 | .322 |
 Sterlin Thompson | 0-3 | 3 | 1 | 0 | 0 | 0 | 2 | 0 | 32 | .176 | .317 | .235 |
 Kyle Karros | 1-3 | 3 | 1 | 1 | 0 | 0 | 1 | 1 | 11 | .224 | .327 | .329 |
 Edouard Julien | 2-2 | 2 | 1 | 2 | 1 | 0 | 0 | 0 | 12 | .215 | .319 | .292 |
 Chad Stevens | 0-2 | 2 | 0 | 0 | 0 | 0 | 0 | 1 | 12 | .053 | .208 | .053 |
Los Angeles Angels
| Player | H-AB | AB | R | H | RBI | HR | BB | K | #P | AVG | OBP | SLG |
|---|---|---|---|---|---|---|---|---|---|---|---|---|
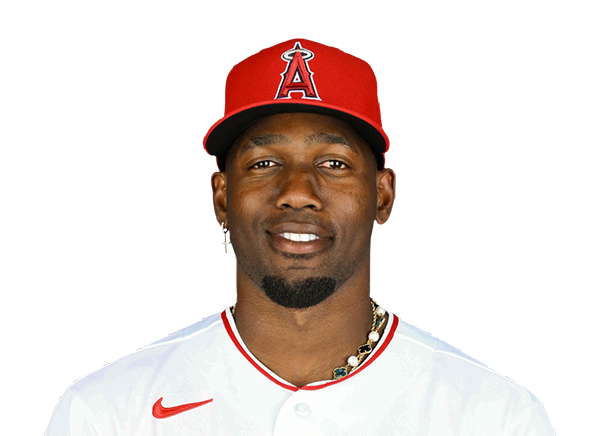 Jorge Soler | 1-4 | 4 | 1 | 1 | 0 | 0 | 0 | 1 | 17 | .222 | .300 | .406 |
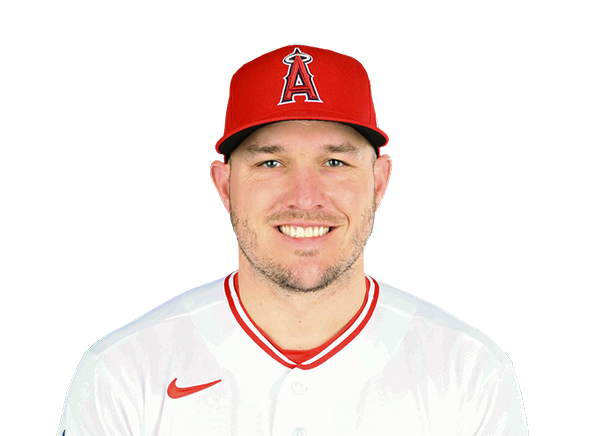 Mike Trout | 1-3 | 3 | 1 | 1 | 0 | 0 | 1 | 2 | 26 | .243 | .411 | .486 |
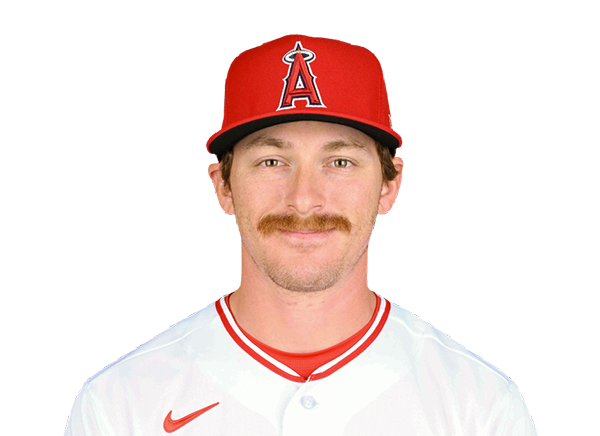 Wade Meckler | 2-3 | 3 | 0 | 2 | 2 | 0 | 1 | 0 | 17 | .323 | .364 | .581 |
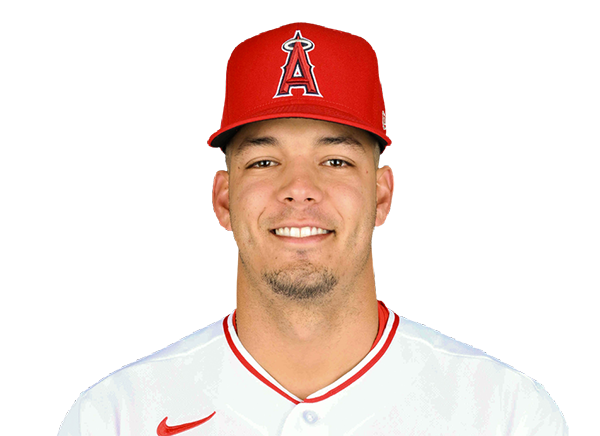 Vaughn Grissom | 1-3 | 3 | 0 | 1 | 0 | 0 | 0 | 2 | 15 | .240 | .322 | .388 |
 Jo Adell | 0-4 | 4 | 0 | 0 | 0 | 0 | 0 | 2 | 18 | .232 | .275 | .378 |
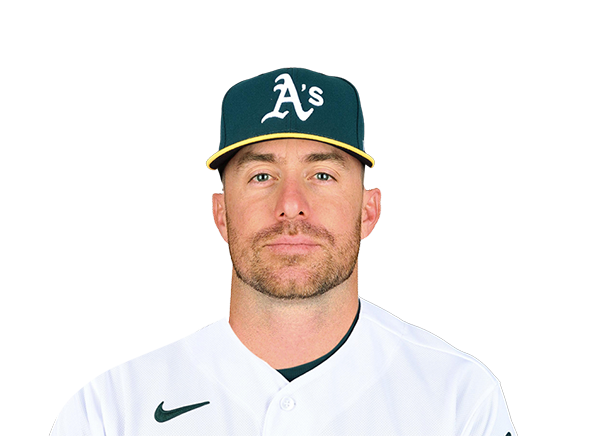 Donovan Walton | 1-4 | 4 | 0 | 1 | 0 | 0 | 0 | 1 | 15 | .303 | .343 | .394 |
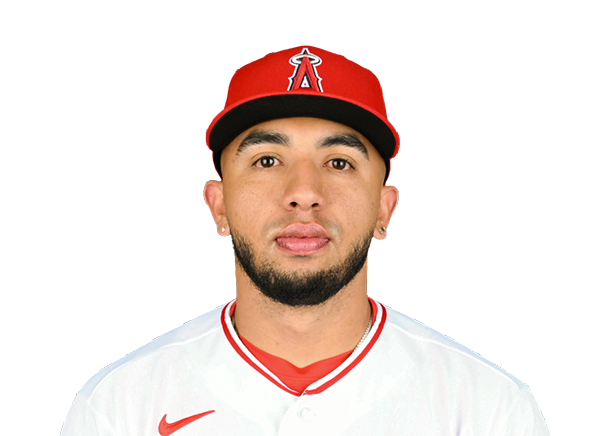 Oswald Peraza | 1-4 | 4 | 0 | 1 | 0 | 0 | 0 | 0 | 17 | .280 | .339 | .458 |
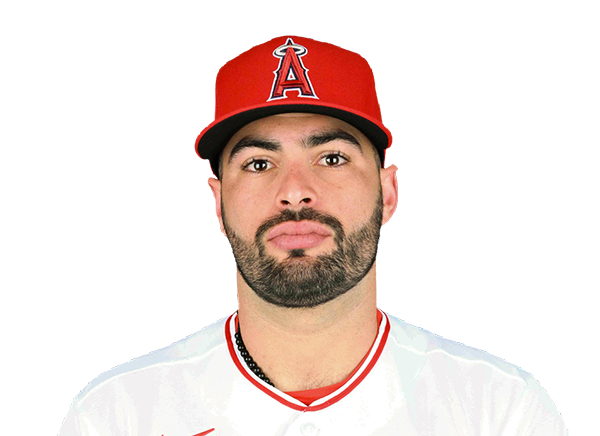 Sebastian Rivero | 0-3 | 3 | 0 | 0 | 0 | 0 | 0 | 0 | 8 | .133 | .188 | .156 |
 Nick Madrigal | 0-1 | 1 | 0 | 0 | 0 | 0 | 0 | 0 | 3 | .200 | .273 | .200 |
 Adam Frazier | 0-4 | 4 | 0 | 0 | 0 | 0 | 0 | 0 | 15 | .215 | .295 | .342 |
Colorado Rockies
| Player | IP | H | R | ER | BB | K | HR | PC-ST | ERA | PC |
|---|---|---|---|---|---|---|---|---|---|---|
 Tomoyuki Sugano | 5.0 | 5 | 2 | 2 | 2 | 5 | 0 | 96-58 | 3.98 | 96 |
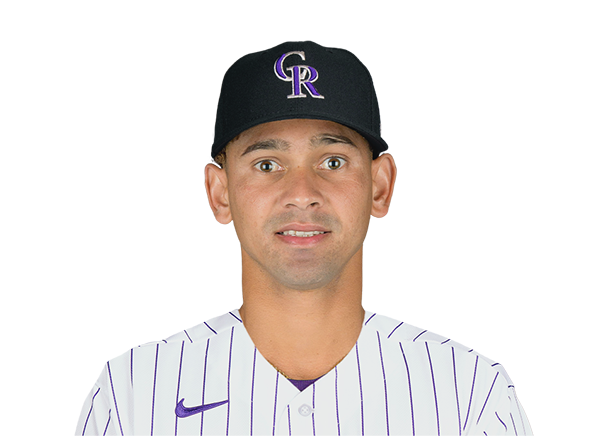 Blas Castano | 2.0 | 0 | 0 | 0 | 0 | 2 | 0 | 29-20 | 4.15 | 29 |
 TJ Shook | 1.0 | 1 | 0 | 0 | 0 | 0 | 0 | 10-5 | 0.00 | 10 |
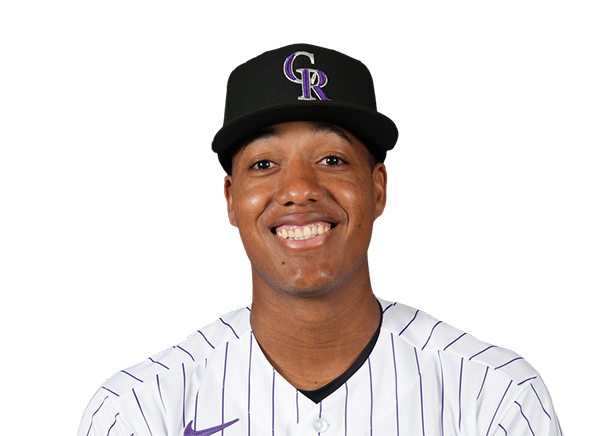 Juan Mejia | 1.0 | 1 | 0 | 0 | 0 | 1 | 0 | 16-11 | 5.79 | 16 |
Los Angeles Angels
| Player | IP | H | R | ER | BB | K | HR | PC-ST | ERA | PC |
|---|---|---|---|---|---|---|---|---|---|---|
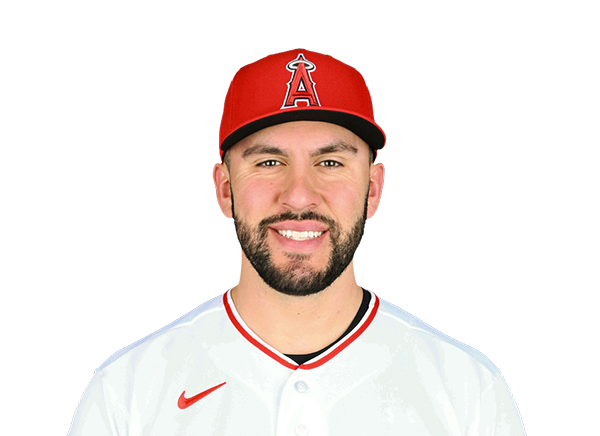 Grayson Rodriguez | 3.2 | 7 | 8 | 7 | 3 | 3 | 2 | 91-56 | 9.50 | 91 |
 Sam Aldegheri | 5.1 | 4 | 0 | 0 | 2 | 5 | 0 | 89-60 | 2.45 | 89 |
H2H / Season Series
LAA11–4
COL
LAA2–8
COL
LAA8–9
COL
LAA6–5
COL
COL7–5
LAA
Last 5 Games
| Date | Opponent | Result |
|---|---|---|
| Aug 21 |  vs CLE | L1–9 |
| Aug 19 |  vs LAD | L4–6 |
| Aug 18 | vs LAD | L6–7 |
| Aug 17 | vs LAD | L5–11 |
| Aug 16 |  @ SF | W13–7 |
| Date | Opponent | Result |
|---|---|---|
| Aug 21 |  @ TEX | L1–2 |
| Aug 20 |  @ HOU | W18–3 |
| Aug 19 | @ HOU | L2–3 |
| Aug 18 | @ HOU | W3–1 |
| Aug 16 |  vs KC | L0–3 |
Standings
American League
| Team | W | L | PCT | GB | DIFF | STRK |
|---|---|---|---|---|---|---|
1 Rays | 76 | 52 | .594 | - | +43 | L2 |
2 White Sox | 67 | 61 | .523 | 9 | +47 | W1 |
| 3Astros | 65 | 64 | .504 | 11.5 | -42 | W1 |
4 Yankees | 73 | 56 | .566 | 3.5 | +95 | L1 |
5 Red Sox | 69 | 59 | .539 | 7 | +97 | W1 |
| 6Rangers | 64 | 65 | .496 | 12.5 | -45 | W2 |
7 Blue Jays | 64 | 67 | .489 | 13.5 | -50 | W1 |
8 Twins | 63 | 66 | .488 | 13.5 | -45 | L1 |
| 9Guardians | 63 | 66 | .488 | 13.5 | -15 | W2 |
10 Orioles | 62 | 67 | .481 | 14.5 | -34 | W1 |
11 Tigers | 61 | 67 | .477 | 15 | +79 | L3 |
12 Mariners | 61 | 68 | .473 | 15.5 | -45 | W1 |
| 13Royals | 56 | 74 | .431 | 21 | -97 | W6 |
| 14Angels | 51 | 78 | .395 | 25.5 | -71 | L1 |
15 Athletics | 49 | 80 | .380 | 27.5 | -189 | L5 |
National League
| Team | W | L | PCT | GB | DIFF | STRK |
|---|---|---|---|---|---|---|
1 Brewers | 81 | 49 | .623 | - | +163 | W3 |
| 2Dodgers | 78 | 51 | .605 | 2.5 | +146 | W4 |
3 Braves | 75 | 55 | .577 | 6 | +108 | L2 |
4 Cubs | 74 | 55 | .574 | 6.5 | +99 | L2 |
5 Phillies | 71 | 58 | .550 | 9.5 | +16 | W7 |
6 Padres | 69 | 60 | .535 | 11.5 | +7 | W1 |
7 Diamondbacks | 68 | 61 | .527 | 12.5 | +13 | W2 |
8 Cardinals | 66 | 64 | .508 | 15 | +9 | L1 |
9 Marlins | 65 | 64 | .504 | 15.5 | +15 | W1 |
10 Pirates | 63 | 67 | .485 | 18 | +30 | L1 |
11 Reds | 61 | 68 | .473 | 19.5 | -98 | L2 |
12 Nationals | 61 | 69 | .469 | 20 | +16 | L2 |
13 Mets | 58 | 71 | .450 | 22.5 | -44 | L1 |
| 14Giants | 52 | 76 | .406 | 28 | -78 | L2 |
| 15Rockies | 50 | 78 | .391 | 30 | -130 | L4 |
COL
VS
LAA
Pitchers
Tomoyuki Sugano
Blas Castano
TJ Shook
Juan Mejia
Catchers
Hunter Goodman
Infielders
Willi Castro
Ezequiel Tovar
Kyle Karros
Edouard Julien
Chad Stevens
Outfielders
Jake McCarthy
Troy Johnston
Sterlin Thompson
Designated Hitters
TJ Rumfield
Pitchers
Grayson Rodriguez
Sam Aldegheri
Catchers
Sebastian Rivero
Infielders
Vaughn Grissom
Donovan Walton
Oswald Peraza
Adam Frazier
Outfielders
Mike Trout
Wade Meckler
Jo Adell
Designated Hitters
Jorge Soler
Other Players
Nick Madrigal
Rockies
VS
Angels
Batting
128
Team Games Played
129
4343
At Bats
4311
1099
Hits
1015
588
Runs Batted In
512
142
Home Runs
128
87
Stolen Bases
70
.253
Batting Average
.235
612
Runs
531
234
Doubles
191
26
Triples
11
1811
Total Bases
1612
405
Walks
405
1107
Strikeouts
1218
.323
On Base Percentage
.310
.417
Slugging Percentage
.374
.740
OBP Pct + SLG Pct
.684
128
Games Played
129
128
Games Started
129
63
Hit By Pitch
72
0.0
Wins Above Replacement
0.0
0.0
Offensive Wins Above Replacement
0.0
34
Caught Stealing
22
1
Is Qualified
1
595.2
Runs Created
503.5
4.7
Runs Created Per 27 Outs
3.9
.083
Walks Per Plate Appearance
.084
0.37
Walk To Strikeout Ratio
0.33
.164
Isolated Power
.138
.269
Secondary Average
.244
3.74
Pitches Per Plate Appearance
3.91
402
Extra Base Hits
330
4872
Plate Appearances
4834
30.6
At Bats Per Home Run
33.7
15
Sacrifice Hit
20
45
Sacrifice Flies
24
Pitching
128
Team Games Played
129
21
Quality Starts
40
50
Wins
51
78
Losses
78
29
Saves
20
50
Holds
69
1296
Hits
997
693
Earned runs
543
179
Home Runs
137
417
Walks
531
871
Strikeouts
1163
7.0
Strikeouts Per 9 Innings
9.2
148.9
Pitches Per Start
153.0
1.52
Walks Plus Hits Per Inning Pitched
1.34
5.54
Earned Run Average
4.30
78
Losses
78
1125.2
Innings pitched
1137.0
.391
Win Percentage
.395
49
Save Opportunities
42
.289
Opponent Batting Average
.233
.352
Opponent's On-base pct.
.325
.492
Opponent's Slugging pct.
.379
.843
Opponent's OPB Pct + SLG Pct
.703
4487
At Bats
4276
290
Doubles
180
42
Triples
16
51
Batters Hit
65
100
Stolen Bases
88
128
Games Played
129
1
Complete Games
0
1
Shutouts
10
34
Wild Pitches
54
712
Runs Batted In
570
5
Balks
2
1125.2
Innings pitched
1137.0
7.0
Strikeouts Per 9 Innings
9.2
20
Caught Stealing
23
128
Games Started
129
0.0
Wins Above Replacement
0.0
1
Is Qualified
1
742
Runs
602
693
Earned Runs
543
2207
Total Bases
1620
Fielding
128
Team Games Played
129
1126
Full Innings
1137
4544
Total Chances
4542
3377
Putouts
3411
1083
Assists
1055
84
Errors
76
234
Double Plays
191
0.982
Fielding Percentage
0.983
35.7
Range Factor
35.4
0.0
Zone Rating
0.0
128
Games Played
129
0
Games Started
0
0.0
Defensive Wins Above Replacement
0.0
1
Qualified
1