

Rockies vs Braves Live Score (30 Aug, 2026)
Game Information
Stage
STD
Season
2026
First Pitch
Sun, Aug 30, 1:35 pm
Venue
Truist Park
Location
Atlanta, Georgia
Venue Type
Outdoor
Broadcast
MLB.TV
Attendance
31,776
Live Situation
2Balls
2Strikes
0Outs
—Pitcher
—At Bat
Pitch Sequence
1
STRIKE FOUL
Changeup
84 MPH
2
BALL
Changeup
84 MPH
3
BALL
Changeup
84 MPH
4
STRIKE SWINGING
Slider
89 MPH
5
BALL IN PLAY
Changeup
83 MPH
Injury Report
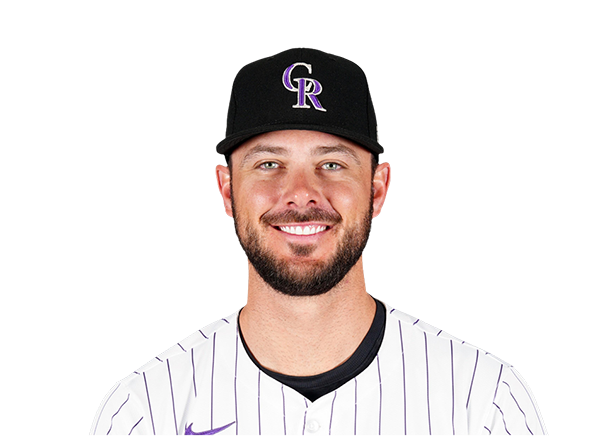


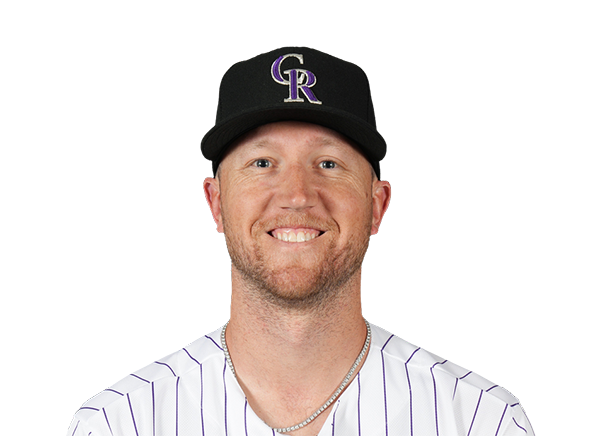

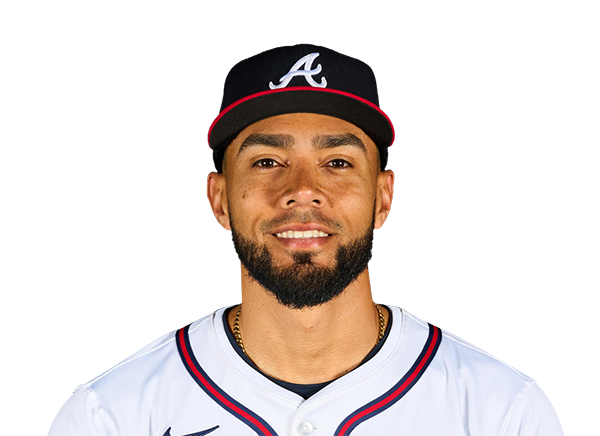
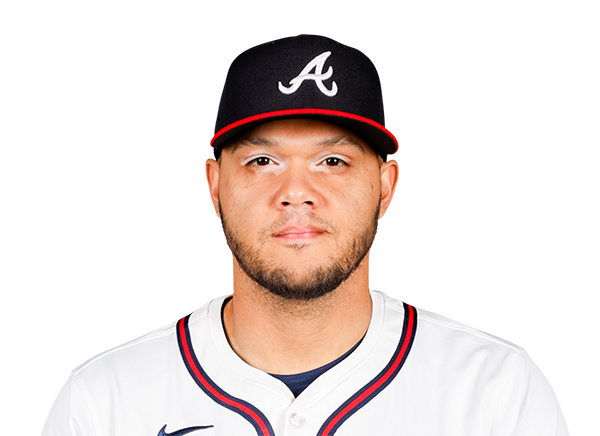
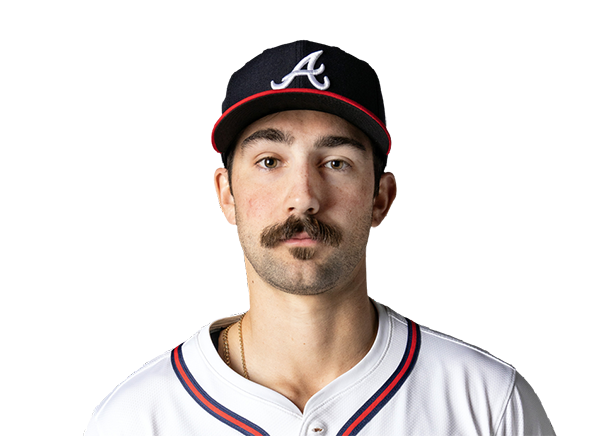
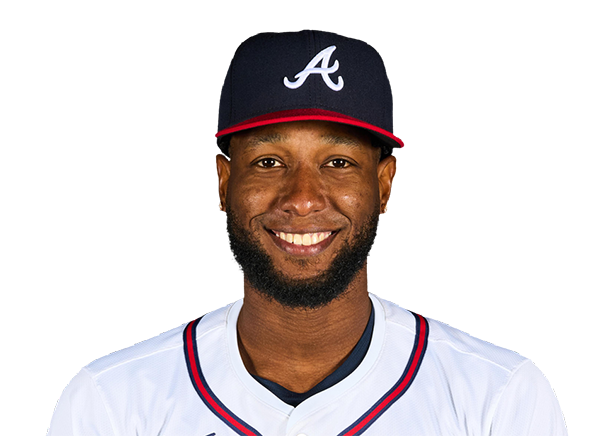
Team Stats
 COL
ATL


2
Runs
3
7
Hits
10
1
Errors
0
1
Home Runs
1
0
Walks
4
12
Strikeouts
11
Player Box Score
Colorado Rockies
| Player | H-AB | AB | R | H | RBI | HR | BB | K | #P | AVG | OBP | SLG |
|---|---|---|---|---|---|---|---|---|---|---|---|---|
 Jake McCarthy | 1-4 | 4 | 1 | 1 | 1 | 1 | 0 | 0 | 8 | .290 | .331 | .476 |
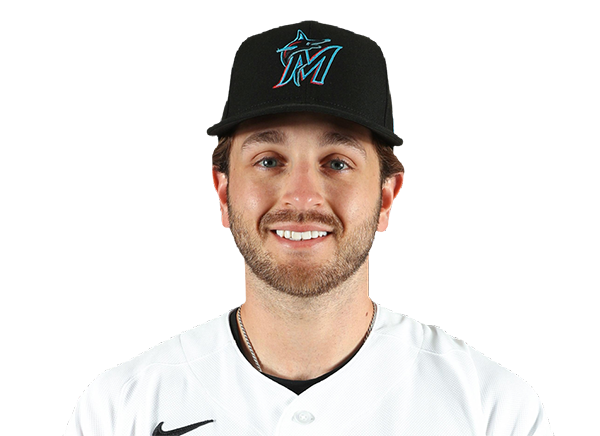 Connor Norby | 1-4 | 4 | 0 | 1 | 1 | 0 | 0 | 2 | 17 | .226 | .331 | .362 |
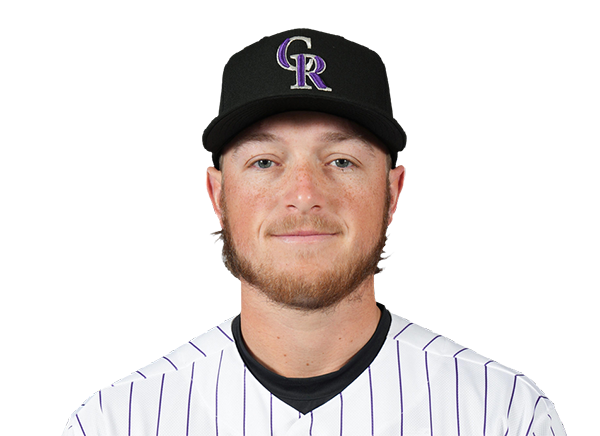 Hunter Goodman | 1-4 | 4 | 0 | 1 | 0 | 0 | 0 | 2 | 16 | .254 | .320 | .542 |
 TJ Rumfield | 1-4 | 4 | 0 | 1 | 0 | 0 | 0 | 1 | 16 | .289 | .380 | .437 |
 Willi Castro | 0-4 | 4 | 0 | 0 | 0 | 0 | 0 | 2 | 17 | .260 | .332 | .418 |
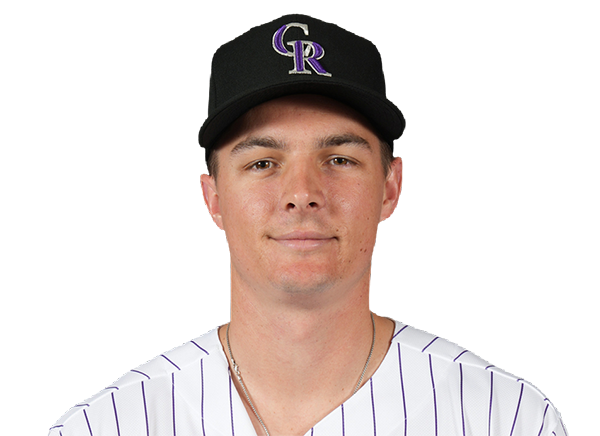 Mickey Moniak | 1-4 | 4 | 0 | 1 | 0 | 0 | 0 | 1 | 9 | .253 | .295 | .509 |
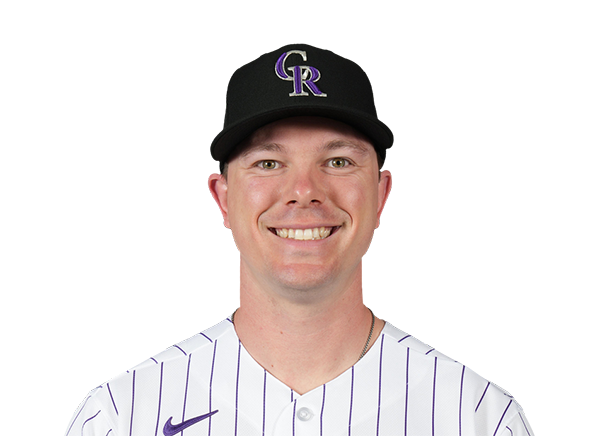 Troy Johnston | 1-2 | 2 | 0 | 1 | 0 | 0 | 0 | 1 | 9 | .288 | .358 | .405 |
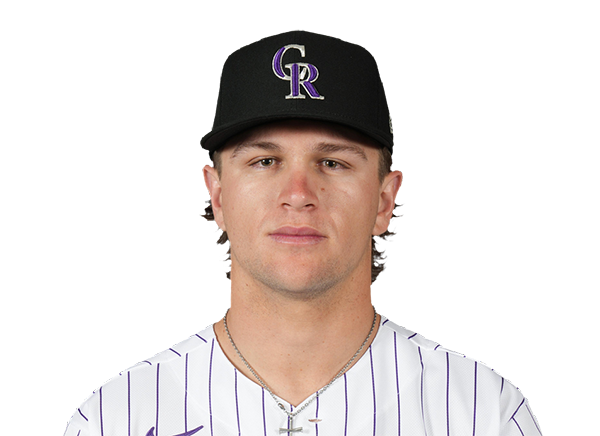 Cole Carrigg | 0-2 | 2 | 0 | 0 | 0 | 0 | 0 | 1 | 6 | .261 | .342 | .440 |
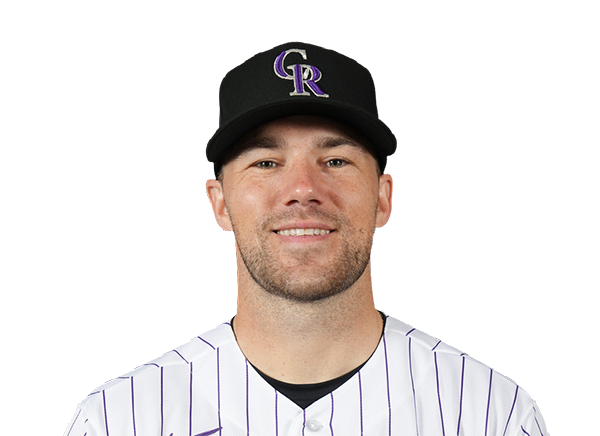 Brett Sullivan | 1-4 | 4 | 1 | 1 | 0 | 0 | 0 | 1 | 16 | .231 | .277 | .419 |
 Ryan Ritter | 0-2 | 2 | 0 | 0 | 0 | 0 | 0 | 1 | 13 | .176 | .222 | .176 |
 Zac Veen | 0-1 | 1 | 0 | 0 | 0 | 0 | 0 | 0 | 2 | .233 | .324 | .467 |
Atlanta Braves
| Player | H-AB | AB | R | H | RBI | HR | BB | K | #P | AVG | OBP | SLG |
|---|---|---|---|---|---|---|---|---|---|---|---|---|
 Drake Baldwin | 2-5 | 5 | 0 | 2 | 0 | 0 | 0 | 3 | 20 | .277 | .356 | .453 |
 Brewer Hicklen | 0-0 | 0 | 1 | 0 | 0 | 0 | 0 | 0 | 0 | .368 | .478 | .579 |
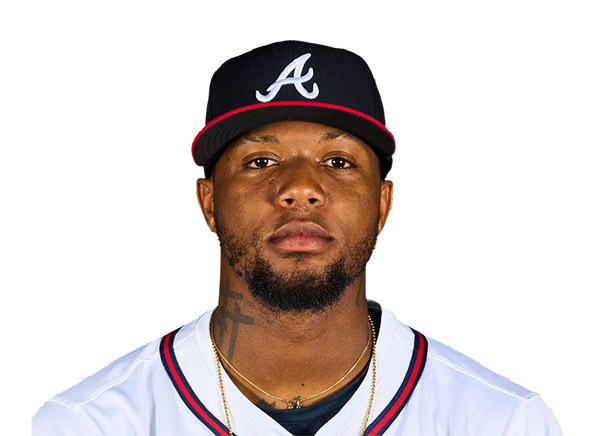 Ronald Acuna Jr. | 2-3 | 3 | 0 | 2 | 1 | 0 | 2 | 0 | 22 | .241 | .346 | .411 |
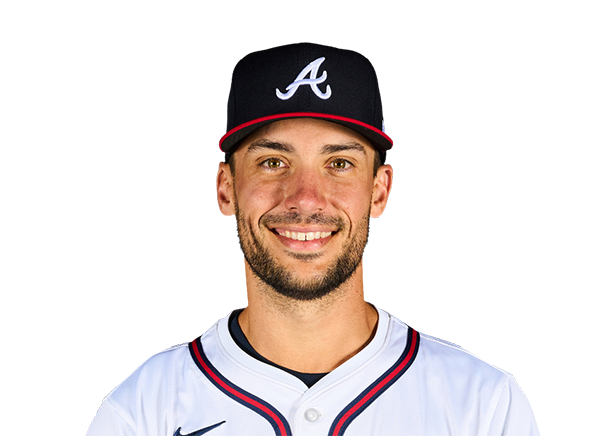 Matt Olson | 1-5 | 5 | 0 | 1 | 1 | 0 | 0 | 1 | 16 | .258 | .334 | .527 |
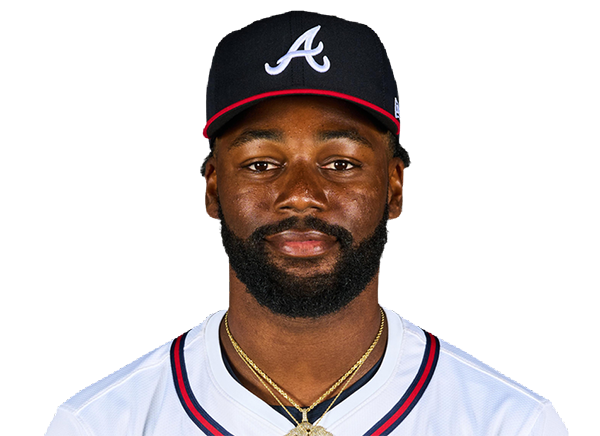 Michael Harris II | 1-4 | 4 | 0 | 1 | 0 | 0 | 0 | 1 | 11 | .295 | .322 | .496 |
 Mauricio Dubon | 1-3 | 3 | 0 | 1 | 0 | 0 | 1 | 0 | 15 | .270 | .315 | .390 |
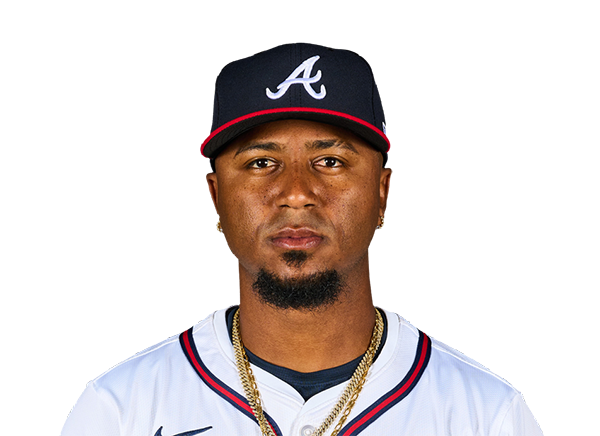 Ozzie Albies | 1-4 | 4 | 0 | 1 | 0 | 0 | 0 | 2 | 13 | .254 | .310 | .413 |
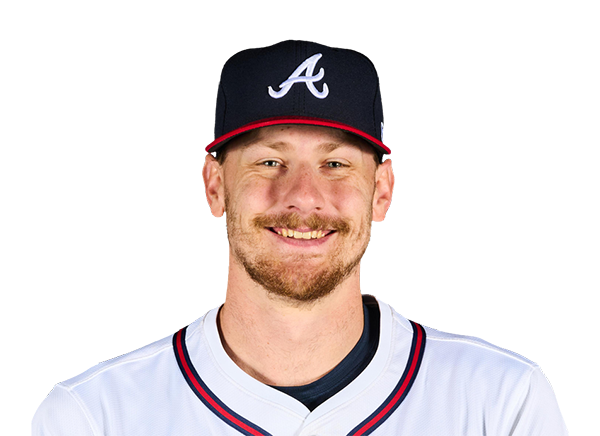 Sean Murphy | 1-3 | 3 | 1 | 1 | 1 | 1 | 1 | 1 | 14 | .218 | .246 | .382 |
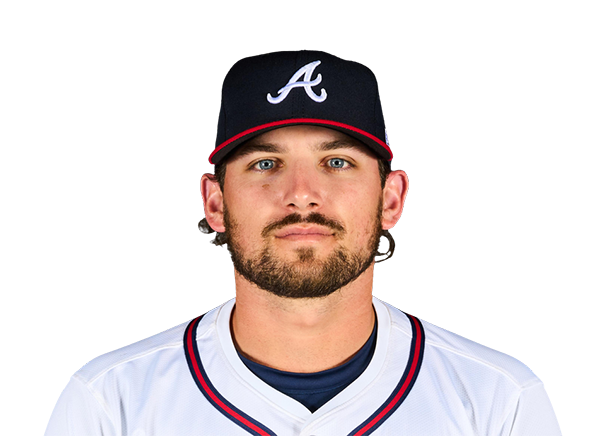 Austin Riley | 1-4 | 4 | 1 | 1 | 0 | 0 | 0 | 1 | 10 | .220 | .294 | .361 |
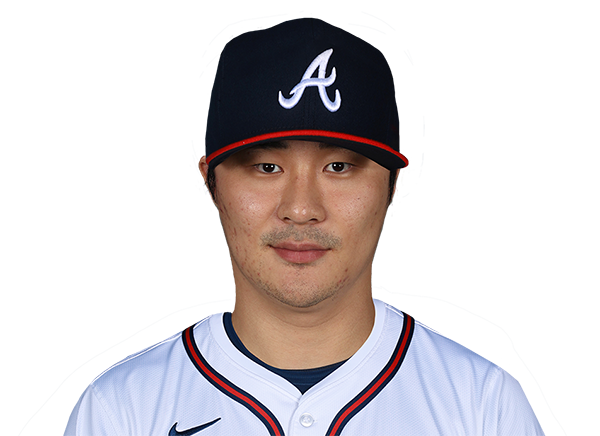 Ha-Seong Kim | 0-3 | 3 | 0 | 0 | 0 | 0 | 0 | 1 | 20 | .081 | .177 | .081 |
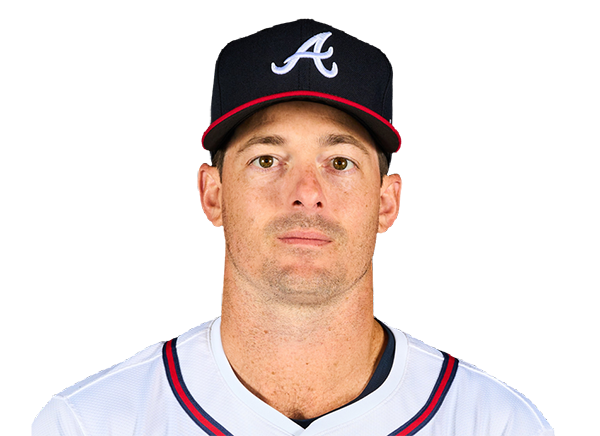 Mike Yastrzemski | 0-1 | 1 | 0 | 0 | 0 | 0 | 0 | 1 | 4 | .225 | .310 | .374 |
Colorado Rockies
| Player | IP | H | R | ER | BB | K | HR | PC-ST | ERA | PC |
|---|---|---|---|---|---|---|---|---|---|---|
 Mason Adams | 5.0 | 5 | 2 | 2 | 2 | 5 | 1 | 74-47 | 3.00 | 74 |
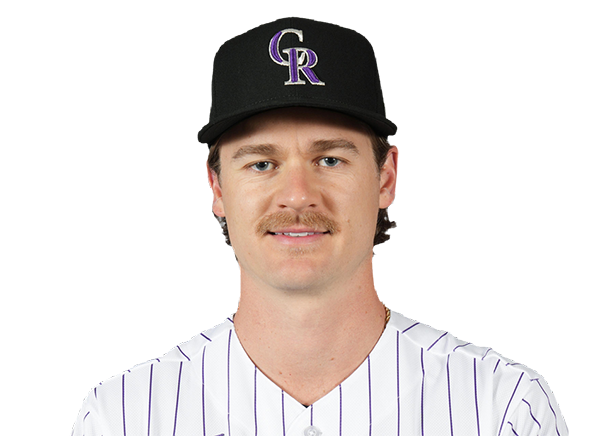 Ryan Feltner | 4.0 | 5 | 1 | 0 | 2 | 6 | 0 | 71-49 | 5.84 | 71 |
Atlanta Braves
| Player | IP | H | R | ER | BB | K | HR | PC-ST | ERA | PC |
|---|---|---|---|---|---|---|---|---|---|---|
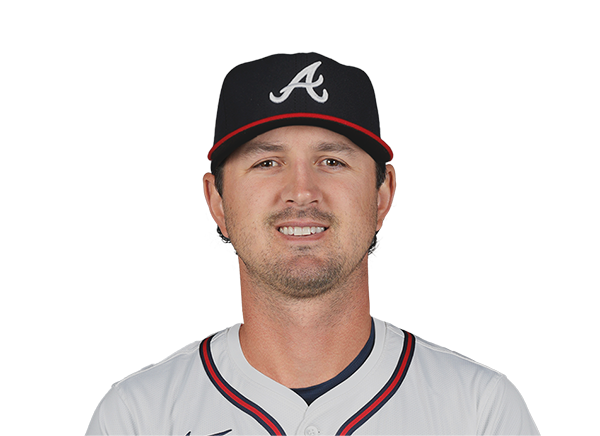 Tyler Mahle | 6.2 | 5 | 1 | 1 | 0 | 9 | 1 | 89-60 | 4.25 | 89 |
 Dylan Dodd | 0.1 | 0 | 0 | 0 | 0 | 1 | 0 | 5-4 | 2.08 | 5 |
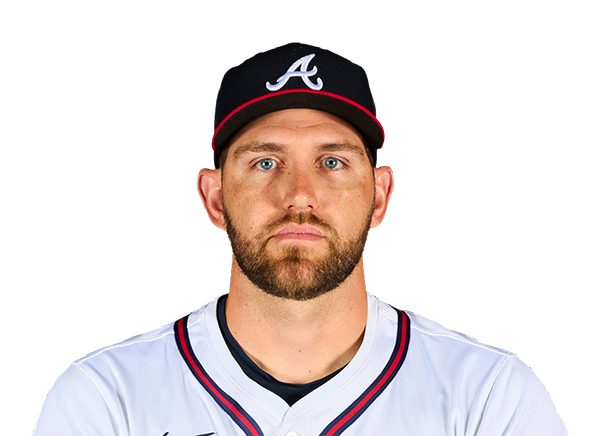 Dylan Lee | 1.0 | 2 | 1 | 1 | 0 | 1 | 0 | 14-11 | 2.52 | 14 |
 Raisel Iglesias | 1.0 | 0 | 0 | 0 | 0 | 0 | 0 | 12-9 | 2.82 | 12 |
 Victor Mederos | 1.0 | 0 | 0 | 0 | 0 | 1 | 0 | 9-6 | 3.04 | 9 |
H2H / Season Series
ATL3–2
COL
ATL2–1
COL
ATL6–4
COL
COL6–11
ATL
COL1–9
ATL
COL6–8
ATL
Last 5 Games
| Date | Opponent | Result |
|---|---|---|
| Aug 30 | @ ATL | L2–3 |
| Aug 29 | @ ATL | L1–2 |
| Aug 28 | @ ATL | L4–6 |
| Aug 27 |  @ WSH | L1–7 |
| Aug 26 | @ WSH | W13–1 |
| Date | Opponent | Result |
|---|---|---|
| Aug 30 | vs COL | W3–2 |
| Aug 29 | vs COL | W2–1 |
| Aug 28 | vs COL | W6–4 |
| Aug 27 |  vs LAD | W1–0 |
| Aug 26 | vs LAD | W6–5 |
Standings
American League
| Team | W | L | PCT | GB | DIFF | STRK |
|---|---|---|---|---|---|---|
1 Rays | 81 | 54 | .600 | - | +53 | W3 |
2 White Sox | 72 | 63 | .533 | 9 | +48 | W4 |
3 Astros | 68 | 68 | .500 | 13.5 | -46 | L1 |
4 Yankees | 77 | 59 | .566 | 4.5 | +102 | W1 |
5 Red Sox | 74 | 62 | .544 | 7.5 | +99 | L1 |
6 Guardians | 68 | 68 | .500 | 13.5 | -12 | L2 |
7 Orioles | 67 | 69 | .493 | 14.5 | -21 | W2 |
8 Blue Jays | 67 | 70 | .489 | 15 | -57 | W2 |
9 Rangers | 66 | 70 | .485 | 15.5 | -54 | L4 |
10 Mariners | 64 | 72 | .471 | 17.5 | -65 | L3 |
11 Twins | 64 | 72 | .471 | 17.5 | -60 | L4 |
12 Tigers | 63 | 72 | .467 | 18 | +70 | W1 |
13 Royals | 62 | 75 | .453 | 20 | -73 | W3 |
14 Athletics | 53 | 83 | .390 | 28.5 | -188 | L2 |
15 Angels | 52 | 84 | .382 | 29.5 | -79 | L6 |
National League
| Team | W | L | PCT | GB | DIFF | STRK |
|---|---|---|---|---|---|---|
1 Brewers | 85 | 51 | .625 | - | +180 | W4 |
| 2Braves | 81 | 55 | .596 | 4 | +116 | W6 |
| 3Dodgers | 81 | 55 | .596 | 4 | +148 | L1 |
4 Cubs | 77 | 59 | .566 | 8 | +129 | W1 |
5 Phillies | 76 | 60 | .559 | 9 | +27 | W3 |
6 Diamondbacks | 73 | 65 | .529 | 13 | +5 | L1 |
7 Padres | 72 | 64 | .529 | 13 | +11 | L2 |
8 Marlins | 68 | 68 | .500 | 17 | +11 | L2 |
9 Cardinals | 68 | 69 | .496 | 17.5 | -14 | L1 |
10 Pirates | 66 | 71 | .482 | 19.5 | +25 | W1 |
| 11Nationals | 65 | 73 | .471 | 21 | +20 | W3 |
12 Reds | 64 | 72 | .471 | 21 | -110 | L1 |
13 Mets | 61 | 75 | .449 | 24 | -50 | W1 |
14 Giants | 56 | 81 | .409 | 29.5 | -74 | W1 |
| 15Rockies | 52 | 84 | .382 | 33 | -141 | L3 |
COL
VS
ATL
Pitchers
Mason Adams
Catchers
Brett Sullivan
Infielders
Connor Norby
TJ Rumfield
Willi Castro
Ryan Ritter
Outfielders
Jake McCarthy
Mickey Moniak
Troy Johnston
Designated Hitters
Hunter Goodman
Pitchers
Tyler Mahle
Catchers
Sean Murphy
Infielders
Matt Olson
Ozzie Albies
Austin Riley
Ha-Seong Kim
Outfielders
Ronald Acuna Jr.
Michael Harris II
Mauricio Dubon
Designated Hitters
Drake Baldwin
Rockies
VS
Braves
Batting
137
Team Games Played
137
4651
At Bats
4627
1174
Hits
1149
619
Runs Batted In
610
152
Home Runs
173
94
Stolen Bases
75
.252
Batting Average
.248
644
Runs
636
245
Doubles
219
26
Triples
9
1927
Total Bases
1905
439
Walks
399
1189
Strikeouts
1109
.323
On Base Percentage
.312
.414
Slugging Percentage
.412
.737
OBP Pct + SLG Pct
.724
137
Games Played
137
137
Games Started
137
69
Hit By Pitch
50
0.0
Wins Above Replacement
0.0
0.0
Offensive Wins Above Replacement
0.0
36
Caught Stealing
21
1
Is Qualified
1
634.9
Runs Created
608.7
4.7
Runs Created Per 27 Outs
4.5
.084
Walks Per Plate Appearance
.078
0.37
Walk To Strikeout Ratio
0.36
.162
Isolated Power
.163
.269
Secondary Average
.261
3.75
Pitches Per Plate Appearance
3.89
423
Extra Base Hits
401
5223
Plate Appearances
5127
30.6
At Bats Per Home Run
26.7
16
Sacrifice Hit
9
47
Sacrifice Flies
39
Pitching
137
Team Games Played
137
22
Quality Starts
52
52
Wins
82
85
Losses
55
30
Saves
43
54
Holds
99
1383
Hits
1054
734
Earned runs
480
187
Home Runs
148
450
Walks
461
930
Strikeouts
1162
7.0
Strikeouts Per 9 Innings
8.6
149.0
Pitches Per Start
144.3
1.52
Walks Plus Hits Per Inning Pitched
1.24
5.49
Earned Run Average
3.55
85
Losses
55
1202.2
Innings pitched
1217.0
.380
Win Percentage
.599
51
Save Opportunities
62
.288
Opponent Batting Average
.232
.352
Opponent's On-base pct.
.308
.488
Opponent's Slugging pct.
.376
.840
Opponent's OPB Pct + SLG Pct
.683
4794
At Bats
4544
306
Doubles
171
45
Triples
19
53
Batters Hit
51
112
Stolen Bases
97
137
Games Played
137
1
Complete Games
1
1
Shutouts
9
38
Wild Pitches
27
753
Runs Batted In
499
5
Balks
4
1202.2
Innings pitched
1217.0
7.0
Strikeouts Per 9 Innings
8.6
21
Caught Stealing
17
137
Games Started
137
0.0
Wins Above Replacement
0.0
1
Is Qualified
1
786
Runs
519
734
Earned Runs
480
2340
Total Bases
1707
Fielding
137
Team Games Played
137
1203
Full Innings
1217
4844
Total Chances
4829
3608
Putouts
3651
1149
Assists
1118
87
Errors
60
245
Double Plays
219
0.982
Fielding Percentage
0.988
35.6
Range Factor
35.3
0.0
Zone Rating
0.0
137
Games Played
137
0
Games Started
0
0.0
Defensive Wins Above Replacement
0.0
1
Qualified
1