

Rockies vs Cardinals Live Score (9 Aug, 2026)
Game Information
Stage
Standard
Season
2026
First Pitch
Sun, Aug 9, 2:15 pm
Venue
Busch Stadium
Location
St. Louis, Missouri
Attendance
25,589
Home Runs
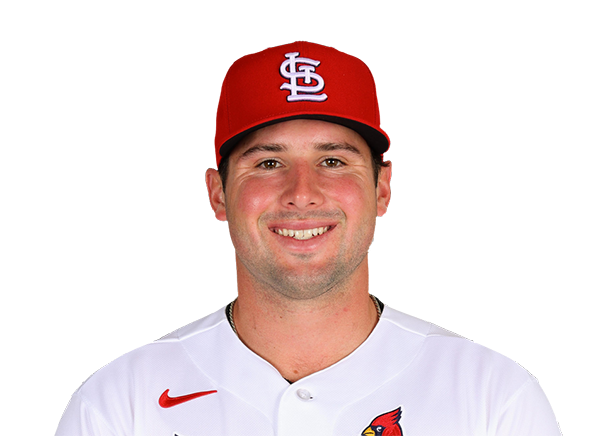
Hunter Goodman
33 HR
.252 AVG
67 RBI

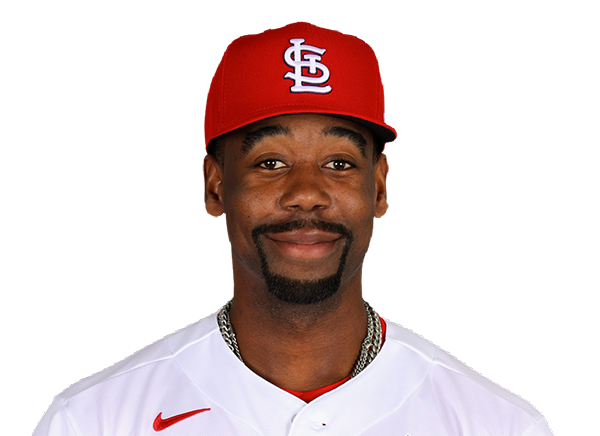
Jordan Walker
23 HR
.283 AVG
82 RBI
Batting Average
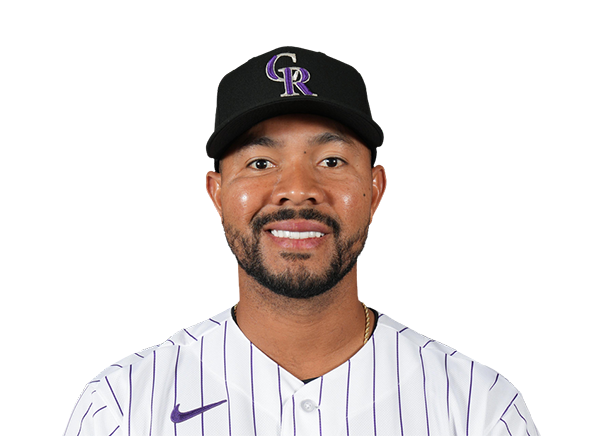
Jake McCarthy
.305 AVG
.341 OBP
.516 SLG

Jordan Walker
.283 AVG
.341 OBP
.492 SLG
Runs Batted In
Jake McCarthy
67 RBI
13 HR
.305 AVG
Jordan Walker
82 RBI
23 HR
.283 AVG
Earned Run Average
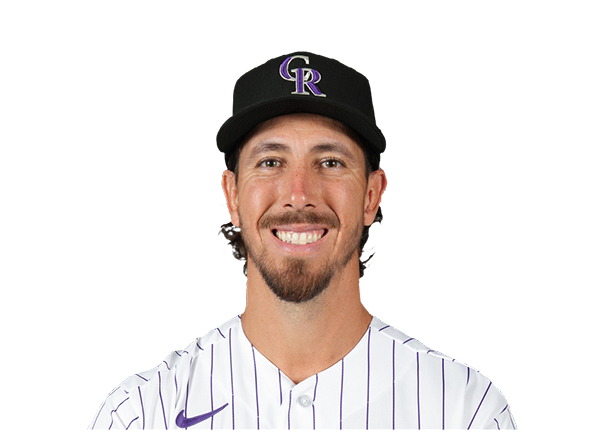
Michael McGreevy
3.59 ERA
4 W
81 K

Wins
Tomoyuki Sugano
11 W
4.51 ERA
61 K

Andre Pallante
12 W
3.63 ERA
90 K

Strikeouts
Kyle Freeland
96 K
3 W
6.63 ERA

Matthew Liberatore
110 K
5 W
5.15 ERA

Injury Report




Team Stats
 COL
STL


Array
Runs
Array
10
Hits
14
2
Errors
0
—
Home Runs
—
—
Walks
—
—
Strikeouts
—
Standings
American League
| Team | W | L | PCT | GB | DIFF | STRK |
|---|---|---|---|---|---|---|
1 Rays | 76 | 53 | .589 | - | +42 | L3 |
2 White Sox | 67 | 62 | .519 | 9 | +42 | L1 |
3 Astros | 65 | 65 | .500 | 11.5 | -43 | L1 |
4 Yankees | 73 | 56 | .566 | 3 | +95 | L1 |
5 Red Sox | 70 | 59 | .543 | 6 | +98 | W2 |
6 Rangers | 64 | 66 | .492 | 12.5 | -48 | L1 |
7 Guardians | 64 | 66 | .492 | 12.5 | -14 | W3 |
8 Blue Jays | 64 | 67 | .489 | 13 | -50 | W1 |
9 Twins | 63 | 67 | .485 | 13.5 | -47 | L2 |
10 Orioles | 63 | 67 | .485 | 13.5 | -33 | W2 |
11 Mariners | 62 | 68 | .477 | 14.5 | -44 | W2 |
12 Tigers | 61 | 68 | .473 | 15 | +77 | L4 |
13 Royals | 57 | 74 | .435 | 20 | -95 | W7 |
14 Angels | 52 | 78 | .400 | 24.5 | -68 | W1 |
15 Athletics | 50 | 80 | .385 | 26.5 | -188 | W1 |
National League
| Team | W | L | PCT | GB | DIFF | STRK |
|---|---|---|---|---|---|---|
1 Brewers | 81 | 49 | .623 | - | +163 | W3 |
2 Dodgers | 79 | 51 | .608 | 2 | +147 | W5 |
3 Braves | 75 | 55 | .577 | 6 | +108 | L2 |
4 Cubs | 74 | 56 | .569 | 7 | +98 | L3 |
5 Phillies | 72 | 58 | .554 | 9 | +25 | W8 |
6 Padres | 70 | 60 | .538 | 11 | +9 | W2 |
7 Diamondbacks | 68 | 62 | .523 | 13 | +7 | L1 |
8 Marlins | 66 | 64 | .508 | 15 | +17 | W2 |
| 9Cardinals | 66 | 65 | .504 | 15.5 | 0 | L2 |
10 Pirates | 63 | 68 | .481 | 18.5 | +29 | L2 |
11 Reds | 62 | 68 | .477 | 19 | -92 | W1 |
12 Nationals | 61 | 70 | .466 | 20.5 | +14 | L3 |
13 Mets | 59 | 71 | .454 | 22 | -39 | W1 |
14 Giants | 52 | 77 | .403 | 28.5 | -79 | L3 |
| 15Rockies | 50 | 79 | .388 | 30.5 | -131 | L5 |
COL
VS
STL
Pitchers
Michael Lorenzen
Catchers

Brett Sullivan
Infielders

TJ Rumfield

Kyle Karros

Willi Castro
Ezequiel Tovar
Outfielders
Jake McCarthy

Cole Carrigg

Mickey Moniak
Designated Hitters
Hunter Goodman
Pitchers
Michael McGreevy
Catchers
Jimmy Crooks
Infielders
JJ Wetherholt
Alec Burleson

Masyn Winn

Jose Fermin
Outfielders
Jordan Walker

Nathan Church

Bryan Torres
Designated Hitters
Ivan Herrera
Rockies
VS
Cardinals
Batting
118
Team Games Played
118
4016
At Bats
3954
1029
Hits
952
545
Runs Batted In
502
134
Home Runs
121
80
Stolen Bases
71
.256
Batting Average
.241
568
Runs
515
217
Doubles
164
24
Triples
12
1696
Total Bases
1503
361
Walks
384
1019
Strikeouts
905
.324
On Base Percentage
.316
.422
Slugging Percentage
.380
.746
OBP Pct + SLG Pct
.696
118
Games Played
118
118
Games Started
118
60
Hit By Pitch
71
0.0
Wins Above Replacement
0.0
0.0
Offensive Wins Above Replacement
0.0
32
Caught Stealing
21
1
Is Qualified
1
557.9
Runs Created
485.3
4.8
Runs Created Per 27 Outs
4.1
.080
Walks Per Plate Appearance
.086
0.35
Walk To Strikeout Ratio
0.42
.166
Isolated Power
.139
.268
Secondary Average
.249
3.73
Pitches Per Plate Appearance
3.86
375
Extra Base Hits
297
4492
Plate Appearances
4468
30.0
At Bats Per Home Run
32.7
15
Sacrifice Hit
18
40
Sacrifice Flies
39
Pitching
118
Team Games Played
118
19
Quality Starts
44
46
Wins
59
72
Losses
59
27
Saves
34
44
Holds
77
1189
Hits
1017
631
Earned runs
484
164
Home Runs
118
382
Walks
396
815
Strikeouts
900
7.1
Strikeouts Per 9 Innings
7.7
148.3
Pitches Per Start
148.4
1.52
Walks Plus Hits Per Inning Pitched
1.34
5.48
Earned Run Average
4.14
72
Losses
59
1036.2
Innings pitched
1053.1
.390
Win Percentage
.500
47
Save Opportunities
56
.288
Opponent Batting Average
.254
.351
Opponent's On-base pct.
.327
.491
Opponent's Slugging pct.
.398
.842
Opponent's OPB Pct + SLG Pct
.725
4123
At Bats
4010
269
Doubles
204
37
Triples
10
46
Batters Hit
57
93
Stolen Bases
82
118
Games Played
118
1
Complete Games
1
1
Shutouts
7
32
Wild Pitches
50
650
Runs Batted In
499
4
Balks
3
1036.2
Innings pitched
1053.1
7.1
Strikeouts Per 9 Innings
7.7
18
Caught Stealing
20
118
Games Started
118
0.0
Wins Above Replacement
0.0
1
Is Qualified
1
678
Runs
523
631
Earned Runs
484
2024
Total Bases
1595
Fielding
118
Team Games Played
118
1037
Full Innings
1053
4183
Total Chances
4319
3110
Putouts
3160
997
Assists
1108
76
Errors
51
217
Double Plays
164
0.982
Fielding Percentage
0.988
35.7
Range Factor
36.5
0.0
Zone Rating
0.0
118
Games Played
118
0
Games Started
0
0.0
Defensive Wins Above Replacement
0.0
1
Qualified
1