

Rockies vs Diamondbacks Live Score (12 Aug, 2026)
Game Information
Stage
Standard
Season
2026
First Pitch
Tue, Aug 11, 9:40 pm
Venue
Chase Field
Location
Phoenix, Arizona
Attendance
21,002
Home Runs
Hunter Goodman
34 HR
.253 AVG
69 RBI

Ketel Marte
20 HR
.247 AVG
65 RBI
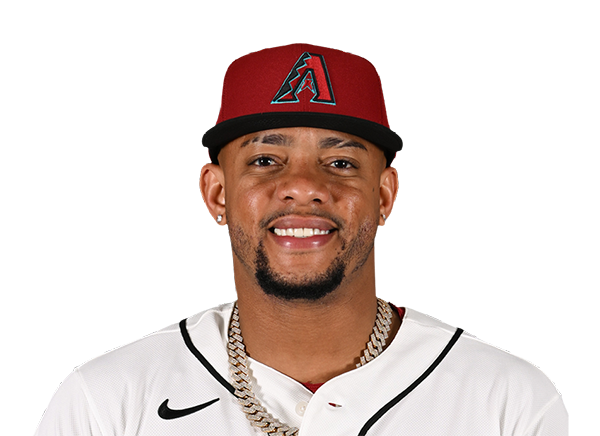
Batting Average
Jake McCarthy
.306 AVG
.343 OBP
.516 SLG

Gabriel Moreno
.304 AVG
.385 OBP
.453 SLG
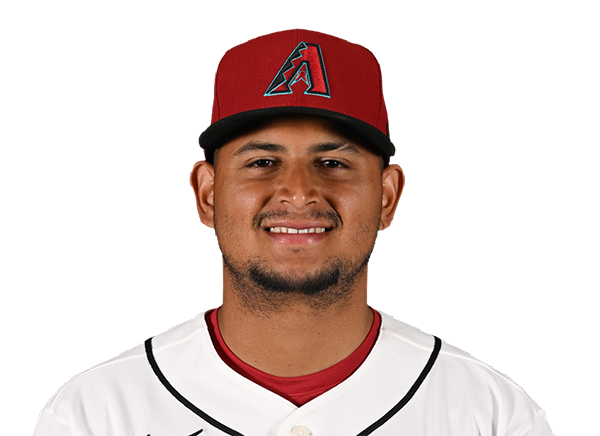
Runs Batted In
Hunter Goodman
69 RBI
34 HR
.253 AVG
Ketel Marte
65 RBI
20 HR
.247 AVG
Earned Run Average
Eduardo Rodriguez
2.70 ERA
11 W
101 K
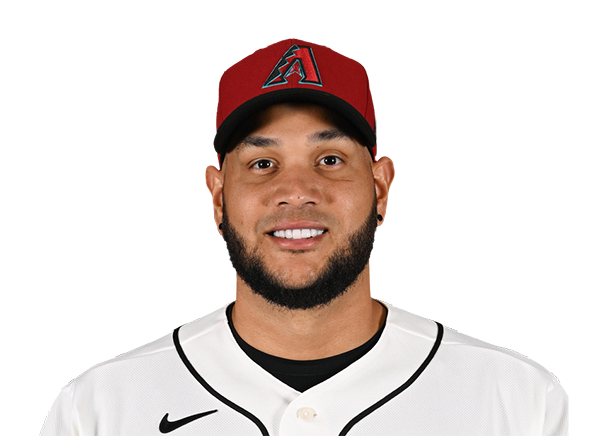
Wins
Tomoyuki Sugano
11 W
4.51 ERA
61 K
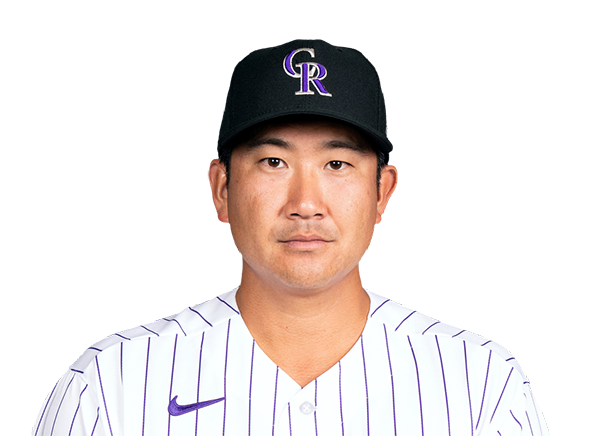
Eduardo Rodriguez
11 W
2.70 ERA
101 K
Strikeouts
Kyle Freeland
96 K
3 W
6.63 ERA
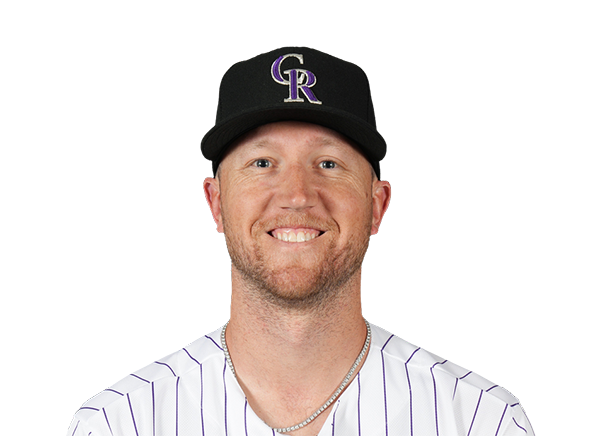
Eduardo Rodriguez
101 K
11 W
2.70 ERA
Injury Report





Team Stats
 COL
ARI


Array
Runs
Array
6
Hits
8
0
Errors
0
—
Home Runs
—
—
Walks
—
—
Strikeouts
—
Standings
American League
| Team | W | L | PCT | GB | DIFF | STRK |
|---|---|---|---|---|---|---|
1 Rays | 76 | 53 | .589 | - | +42 | L3 |
2 White Sox | 67 | 62 | .519 | 9 | +42 | L1 |
3 Astros | 65 | 65 | .500 | 11.5 | -43 | L1 |
4 Yankees | 73 | 56 | .566 | 3 | +95 | L1 |
5 Red Sox | 70 | 59 | .543 | 6 | +98 | W2 |
6 Rangers | 64 | 66 | .492 | 12.5 | -48 | L1 |
7 Guardians | 64 | 66 | .492 | 12.5 | -14 | W3 |
8 Blue Jays | 64 | 67 | .489 | 13 | -50 | W1 |
9 Twins | 63 | 67 | .485 | 13.5 | -47 | L2 |
10 Orioles | 63 | 67 | .485 | 13.5 | -33 | W2 |
11 Mariners | 62 | 68 | .477 | 14.5 | -44 | W2 |
12 Tigers | 61 | 68 | .473 | 15 | +77 | L4 |
13 Royals | 57 | 74 | .435 | 20 | -95 | W7 |
14 Angels | 52 | 78 | .400 | 24.5 | -68 | W1 |
15 Athletics | 50 | 80 | .385 | 26.5 | -188 | W1 |
National League
| Team | W | L | PCT | GB | DIFF | STRK |
|---|---|---|---|---|---|---|
1 Brewers | 81 | 49 | .623 | - | +163 | W3 |
2 Dodgers | 79 | 51 | .608 | 2 | +147 | W5 |
3 Braves | 75 | 55 | .577 | 6 | +108 | L2 |
4 Cubs | 74 | 56 | .569 | 7 | +98 | L3 |
5 Phillies | 72 | 58 | .554 | 9 | +25 | W8 |
6 Padres | 70 | 60 | .538 | 11 | +9 | W2 |
| 7Diamondbacks | 68 | 62 | .523 | 13 | +7 | L1 |
8 Marlins | 66 | 64 | .508 | 15 | +17 | W2 |
9 Cardinals | 66 | 65 | .504 | 15.5 | 0 | L2 |
10 Pirates | 63 | 68 | .481 | 18.5 | +29 | L2 |
11 Reds | 62 | 68 | .477 | 19 | -92 | W1 |
12 Nationals | 61 | 70 | .466 | 20.5 | +14 | L3 |
13 Mets | 59 | 71 | .454 | 22 | -39 | W1 |
14 Giants | 52 | 77 | .403 | 28.5 | -79 | L3 |
| 15Rockies | 50 | 79 | .388 | 30.5 | -131 | L5 |
COL
VS
ARI
Pitchers
Tomoyuki Sugano
Catchers
Hunter Goodman
Infielders

Kyle Karros

Willi Castro
Connor Norby
Ezequiel Tovar
Outfielders
Jake McCarthy

Cole Carrigg

Jordan Beck
Designated Hitters

Mickey Moniak
Pitchers
Mitch Bratt
Catchers
James McCann
Infielders
Ketel Marte
Nolan Arenado

Tim Tawa

Ildemaro Vargas
Outfielders
Lars Nootbaar
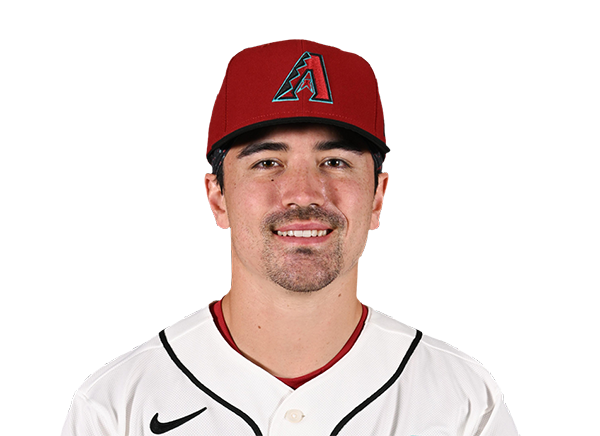
Corbin Carroll
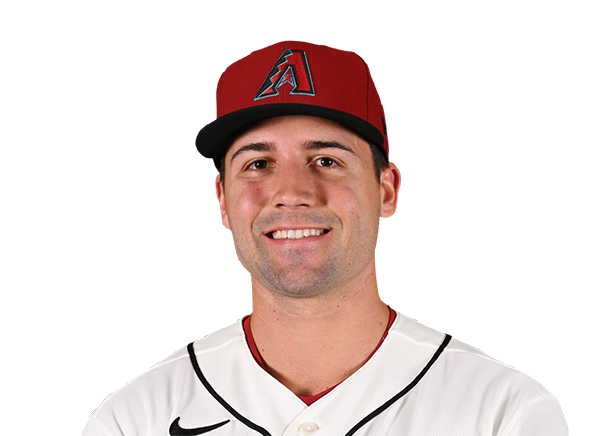
Ryan Waldschmidt
Designated Hitters
Gabriel Moreno
Rockies
VS
Diamondbacks
Batting
120
Team Games Played
121
4074
At Bats
4055
1040
Hits
983
548
Runs Batted In
520
135
Home Runs
117
81
Stolen Bases
81
.255
Batting Average
.242
571
Runs
548
219
Doubles
207
25
Triples
31
1714
Total Bases
1603
368
Walks
400
1032
Strikeouts
881
.323
On Base Percentage
.315
.421
Slugging Percentage
.395
.744
OBP Pct + SLG Pct
.710
120
Games Played
121
120
Games Started
121
60
Hit By Pitch
44
0.0
Wins Above Replacement
0.0
0.0
Offensive Wins Above Replacement
0.0
32
Caught Stealing
18
1
Is Qualified
1
562.2
Runs Created
521.0
4.8
Runs Created Per 27 Outs
4.4
.081
Walks Per Plate Appearance
.088
0.36
Walk To Strikeout Ratio
0.45
.165
Isolated Power
.153
.268
Secondary Average
.267
3.73
Pitches Per Plate Appearance
3.93
379
Extra Base Hits
355
4558
Plate Appearances
4567
30.2
At Bats Per Home Run
34.7
15
Sacrifice Hit
28
41
Sacrifice Flies
38
Pitching
120
Team Games Played
121
20
Quality Starts
45
47
Wins
64
73
Losses
57
28
Saves
30
46
Holds
70
1207
Hits
1028
642
Earned runs
490
167
Home Runs
138
386
Walks
355
827
Strikeouts
821
7.1
Strikeouts Per 9 Innings
6.9
148.4
Pitches Per Start
140.6
1.51
Walks Plus Hits Per Inning Pitched
1.29
5.48
Earned Run Average
4.10
73
Losses
57
1053.2
Innings pitched
1075.0
.392
Win Percentage
.529
48
Save Opportunities
45
.288
Opponent Batting Average
.251
.350
Opponent's On-base pct.
.316
.491
Opponent's Slugging pct.
.414
.841
Opponent's OPB Pct + SLG Pct
.730
4191
At Bats
4088
272
Doubles
202
39
Triples
25
48
Batters Hit
46
98
Stolen Bases
68
120
Games Played
121
1
Complete Games
1
1
Shutouts
6
33
Wild Pitches
23
660
Runs Batted In
521
4
Balks
5
1053.2
Innings pitched
1075.0
7.1
Strikeouts Per 9 Innings
6.9
18
Caught Stealing
17
120
Games Started
121
0.0
Wins Above Replacement
0.0
1
Is Qualified
1
689
Runs
535
642
Earned Runs
490
2058
Total Bases
1694
Fielding
120
Team Games Played
121
1054
Full Innings
1075
4246
Total Chances
4327
3161
Putouts
3225
1008
Assists
1058
77
Errors
44
219
Double Plays
207
0.982
Fielding Percentage
0.990
35.6
Range Factor
35.9
0.0
Zone Rating
0.0
120
Games Played
121
0
Games Started
0
0.0
Defensive Wins Above Replacement
0.0
1
Qualified
1