

Rockies vs Nationals Live Score (27 Aug, 2026)
Game Information
Stage
STD
Season
2026
First Pitch
Thu, Aug 27, 1:05 pm
Venue
Nationals Park
Location
Washington, District of Columbia
Venue Type
Outdoor
Broadcast
MLB.TV
Attendance
14,768
Live Situation
0Balls
0Strikes
0Outs
—Pitcher
—At Bat
Pitch Sequence
1
BALL IN PLAY
Sinker
97 MPH
Injury Report

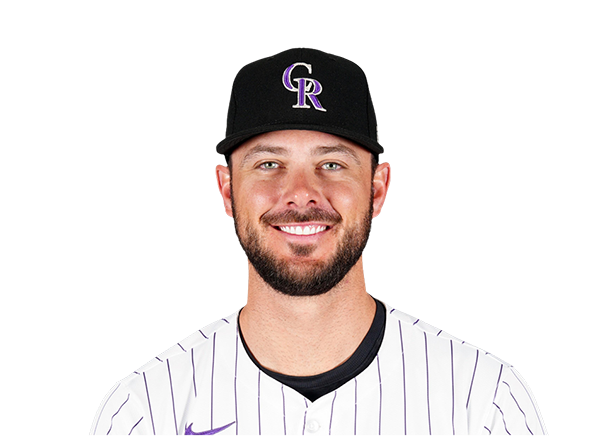

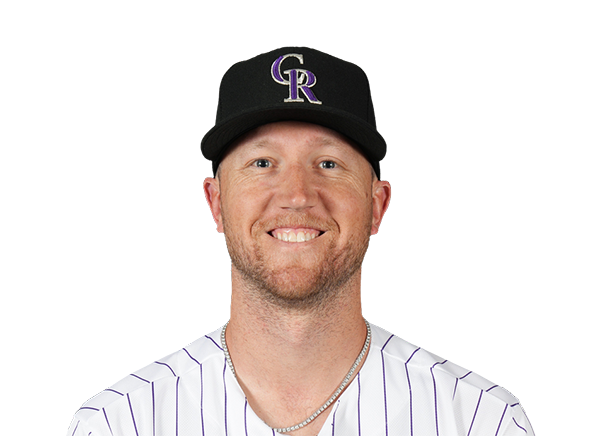
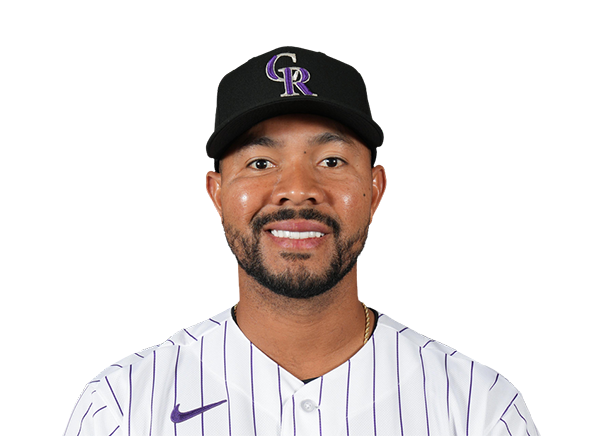
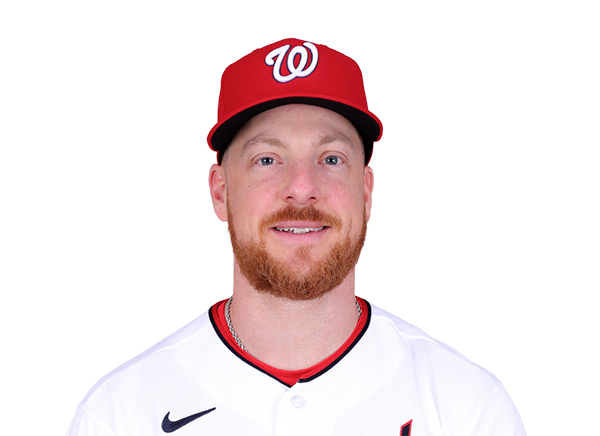
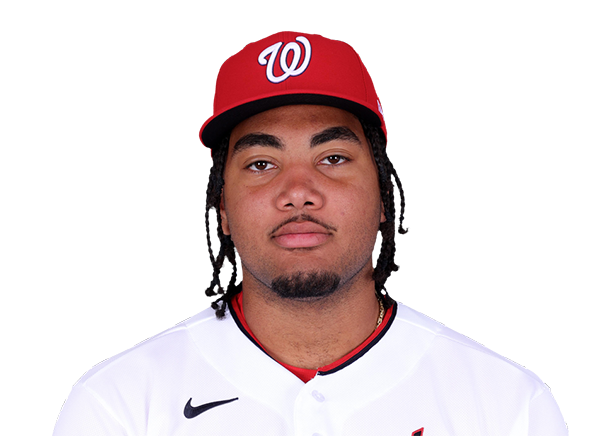
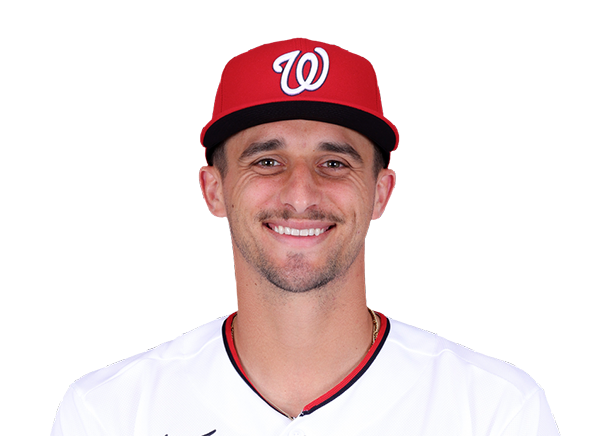
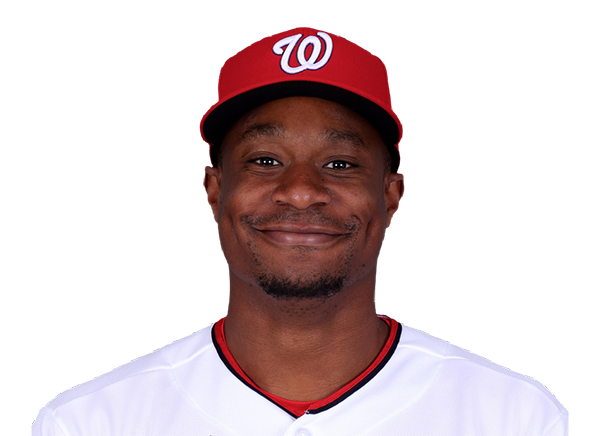
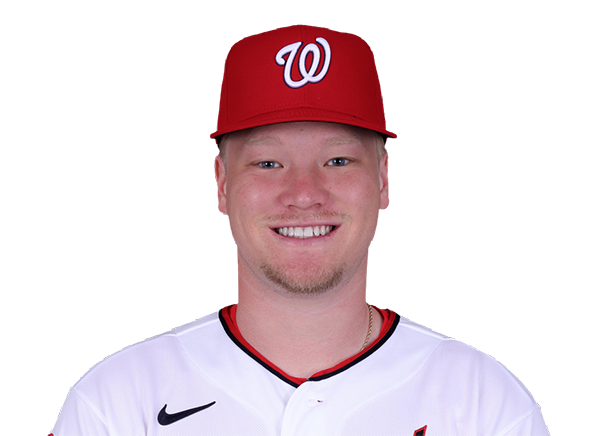
Team Stats
 COL
WSH


1
Runs
7
5
Hits
13
0
Errors
0
0
Home Runs
2
9
Walks
6
10
Strikeouts
6
Player Box Score
Colorado Rockies
| Player | H-AB | AB | R | H | RBI | HR | BB | K | #P | AVG | OBP | SLG |
|---|---|---|---|---|---|---|---|---|---|---|---|---|
 Jake McCarthy | 0-5 | 5 | 0 | 0 | 0 | 0 | 0 | 1 | 16 | .290 | .330 | .475 |
 Cole Carrigg | 0-4 | 4 | 0 | 0 | 0 | 0 | 1 | 2 | 20 | .265 | .349 | .448 |
 Willi Castro | 1-4 | 4 | 1 | 1 | 0 | 0 | 0 | 1 | 22 | .262 | .335 | .425 |
 TJ Rumfield | 1-1 | 1 | 0 | 1 | 0 | 0 | 4 | 0 | 34 | .289 | .380 | .441 |
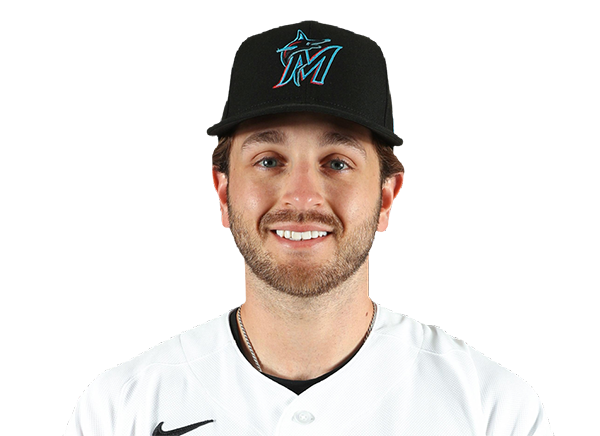 Connor Norby | 1-4 | 4 | 0 | 1 | 0 | 0 | 1 | 2 | 19 | .224 | .331 | .366 |
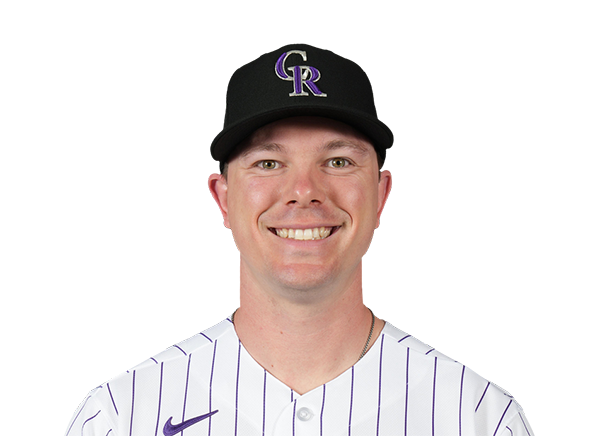 Troy Johnston | 1-3 | 3 | 0 | 1 | 0 | 0 | 1 | 1 | 16 | .285 | .356 | .403 |
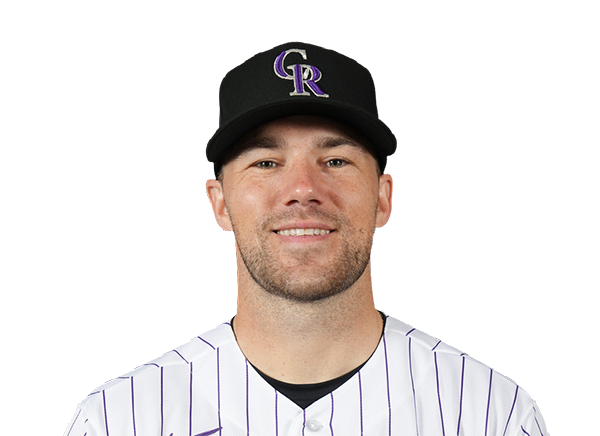 Brett Sullivan | 1-2 | 2 | 0 | 1 | 1 | 0 | 1 | 0 | 9 | .231 | .278 | .423 |
 Hunter Goodman | 0-1 | 1 | 0 | 0 | 0 | 0 | 0 | 0 | 8 | .252 | .318 | .548 |
 Zac Veen | 0-1 | 1 | 0 | 0 | 0 | 0 | 1 | 0 | 7 | .200 | .286 | .480 |
 Jordan Beck | 0-2 | 2 | 0 | 0 | 0 | 0 | 0 | 1 | 7 | .200 | .257 | .312 |
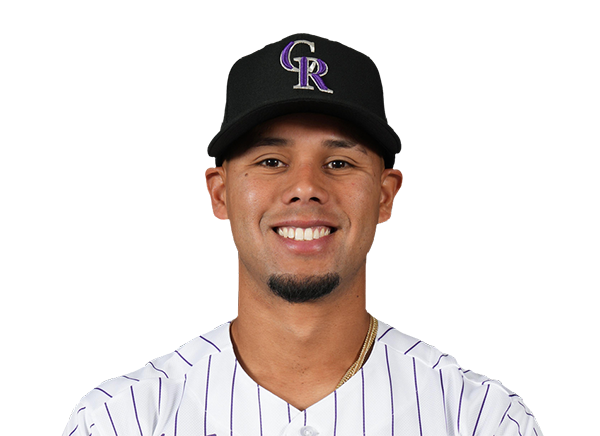 Ezequiel Tovar | 0-4 | 4 | 0 | 0 | 0 | 0 | 0 | 2 | 15 | .210 | .259 | .338 |
Washington Nationals
| Player | H-AB | AB | R | H | RBI | HR | BB | K | #P | AVG | OBP | SLG |
|---|---|---|---|---|---|---|---|---|---|---|---|---|
 CJ Abrams | 1-4 | 4 | 1 | 1 | 0 | 0 | 1 | 2 | 20 | .274 | .350 | .519 |
 Dylan Crews | 2-5 | 5 | 1 | 2 | 1 | 0 | 0 | 2 | 23 | .220 | .291 | .366 |
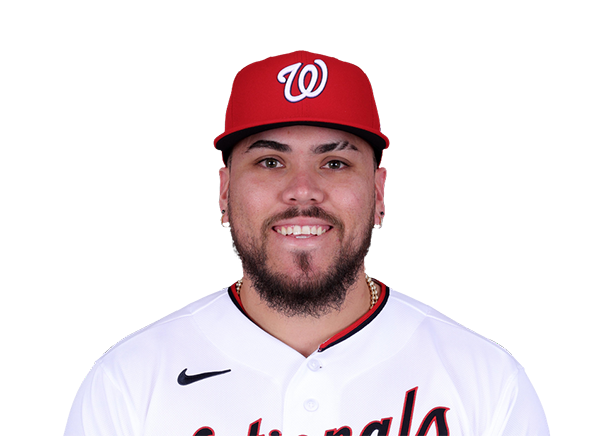 Andres Chaparro | 1-5 | 5 | 0 | 1 | 0 | 0 | 0 | 0 | 18 | .250 | .358 | .529 |
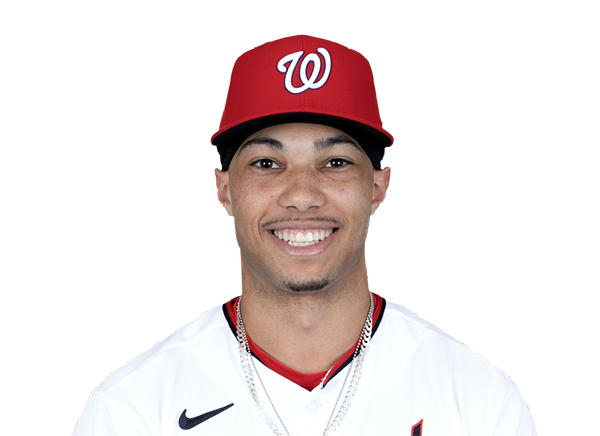 Daylen Lile | 3-4 | 4 | 2 | 3 | 2 | 1 | 1 | 0 | 18 | .251 | .300 | .424 |
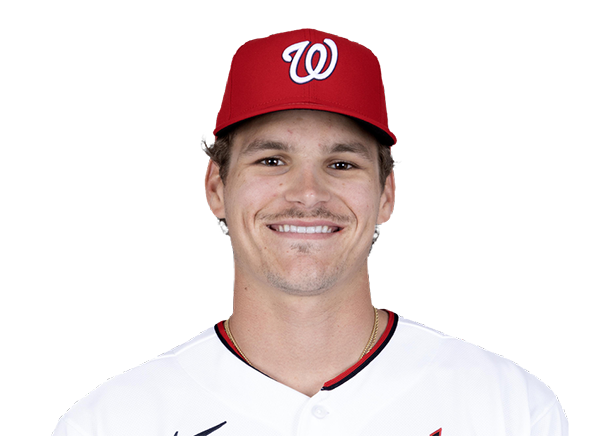 Brady House | 1-3 | 3 | 1 | 1 | 2 | 0 | 1 | 0 | 11 | .233 | .296 | .390 |
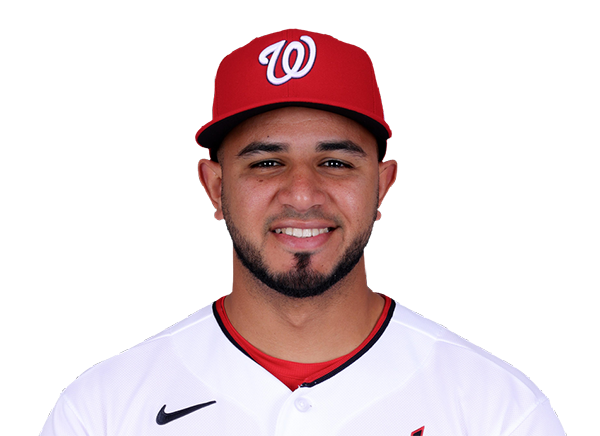 Keibert Ruiz | 2-5 | 5 | 1 | 2 | 2 | 1 | 0 | 0 | 17 | .281 | .320 | .453 |
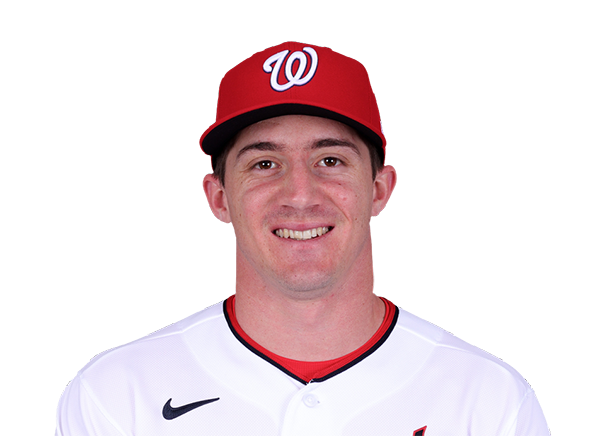 Jacob Young | 2-4 | 4 | 1 | 2 | 0 | 0 | 1 | 0 | 13 | .249 | .314 | .399 |
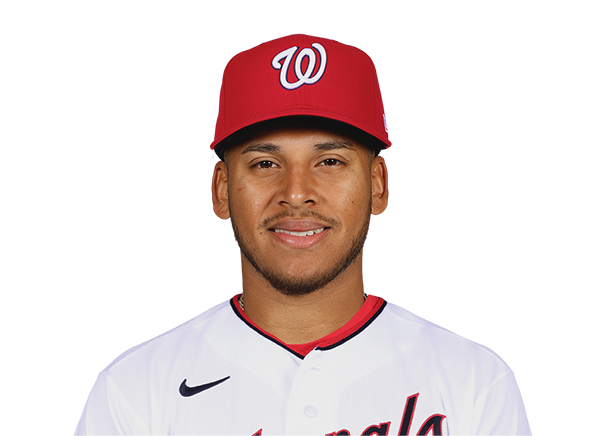 Jorbit Vivas | 0-2 | 2 | 0 | 0 | 0 | 0 | 2 | 1 | 20 | .235 | .329 | .315 |
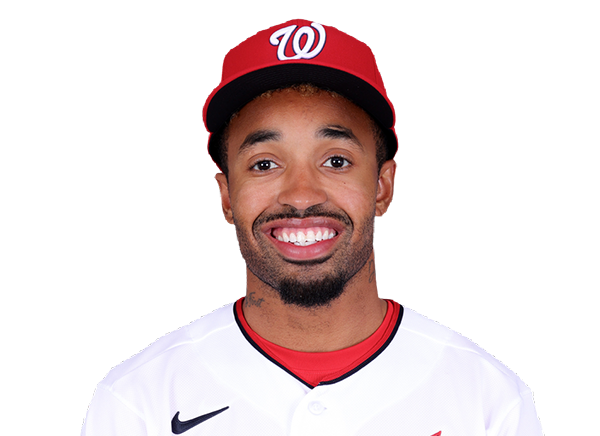 Nasim Nunez | 1-3 | 3 | 0 | 1 | 0 | 0 | 0 | 1 | 13 | .216 | .298 | .250 |
Colorado Rockies
| Player | IP | H | R | ER | BB | K | HR | PC-ST | ERA | PC |
|---|---|---|---|---|---|---|---|---|---|---|
 Gabriel Hughes | 5.0 | 7 | 4 | 4 | 4 | 3 | 1 | 95-54 | 6.61 | 95 |
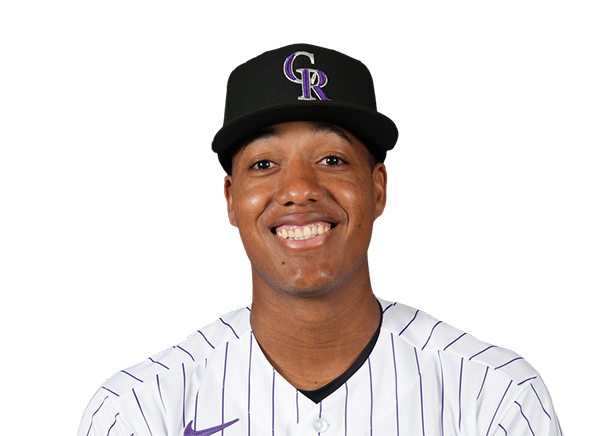 Juan Mejia | 1.0 | 2 | 0 | 0 | 1 | 1 | 0 | 21-15 | 5.66 | 21 |
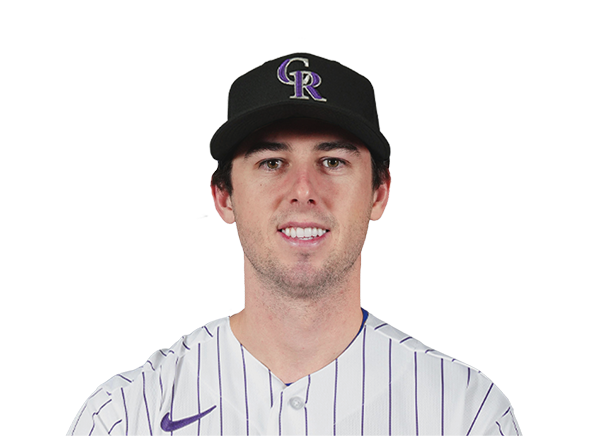 Nick Frasso | 1.0 | 1 | 0 | 0 | 1 | 1 | 0 | 18-11 | 5.00 | 18 |
 Jimmy Herget | 1.0 | 3 | 3 | 3 | 0 | 1 | 1 | 19-13 | 6.20 | 19 |
Washington Nationals
| Player | IP | H | R | ER | BB | K | HR | PC-ST | ERA | PC |
|---|---|---|---|---|---|---|---|---|---|---|
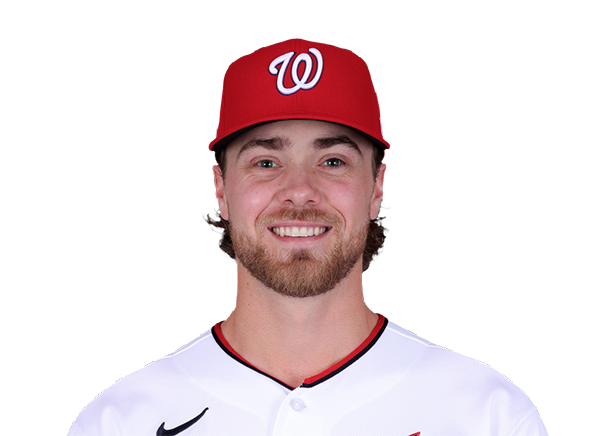 Jake Irvin | 4.1 | 3 | 1 | 1 | 6 | 6 | 0 | 94-53 | 5.62 | 94 |
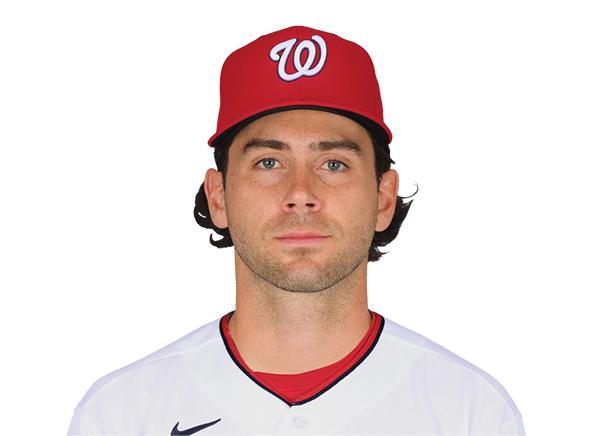 Tom Cosgrove | 1.2 | 0 | 0 | 0 | 1 | 2 | 0 | 19-12 | 4.80 | 19 |
 Erik Tolman | 0.2 | 1 | 0 | 0 | 1 | 1 | 0 | 20-12 | 0.00 | 20 |
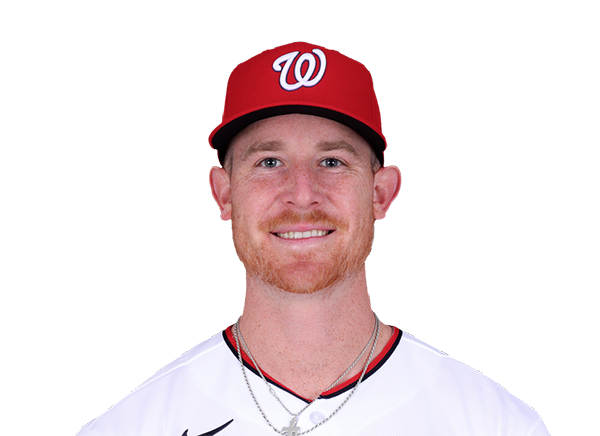 Clayton Beeter | 1.1 | 0 | 0 | 0 | 0 | 0 | 0 | 16-9 | 3.61 | 16 |
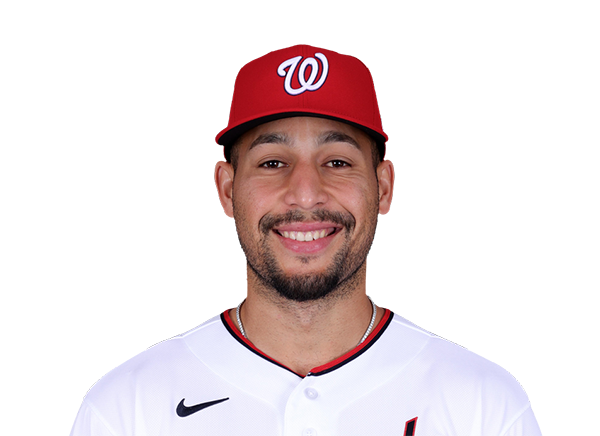 Orlando Ribalta | 1.0 | 1 | 0 | 0 | 1 | 1 | 0 | 24-17 | 3.95 | 24 |
H2H / Season Series
WSH7–1
COL
WSH1–13
COL
WSH1–3
COL
WSH13–3
COL
COL0–8
WSH
COL8–7
WSH
COL3–7
WSH
Last 5 Games
| Date | Opponent | Result |
|---|---|---|
| Aug 27 | @ WSH | L1–7 |
| Aug 26 | @ WSH | W13–1 |
| Aug 25 | @ WSH | W3–1 |
| Aug 24 | @ WSH | L3–13 |
| Aug 23 |  vs CLE | L2–7 |
| Date | Opponent | Result |
|---|---|---|
| Aug 27 | vs COL | W7–1 |
| Aug 26 | vs COL | L1–13 |
| Aug 25 | vs COL | L1–3 |
| Aug 24 | vs COL | W13–3 |
| Aug 23 |  @ MIA | L2–6 |
Standings
American League
| Team | W | L | PCT | GB | DIFF | STRK |
|---|---|---|---|---|---|---|
1 Rays | 79 | 54 | .594 | - | +47 | W1 |
2 White Sox | 70 | 63 | .526 | 9 | +44 | W2 |
3 Astros | 67 | 67 | .500 | 12.5 | -44 | W1 |
4 Yankees | 75 | 58 | .564 | 4 | +100 | L1 |
5 Red Sox | 73 | 60 | .549 | 6 | +101 | L1 |
| 6Guardians | 68 | 66 | .507 | 11.5 | -4 | W7 |
7 Rangers | 66 | 68 | .493 | 13.5 | -47 | L2 |
8 Orioles | 65 | 69 | .485 | 14.5 | -24 | L1 |
9 Blue Jays | 65 | 70 | .481 | 15 | -65 | L1 |
10 Mariners | 64 | 70 | .478 | 15.5 | -57 | L1 |
11 Twins | 64 | 70 | .478 | 15.5 | -56 | L2 |
12 Tigers | 62 | 71 | .466 | 17 | +70 | L1 |
13 Royals | 60 | 75 | .444 | 20 | -81 | W1 |
14 Athletics | 53 | 81 | .396 | 26.5 | -185 | W2 |
15 Angels | 52 | 82 | .388 | 27.5 | -75 | L4 |
National League
| Team | W | L | PCT | GB | DIFF | STRK |
|---|---|---|---|---|---|---|
1 Brewers | 83 | 51 | .619 | - | +173 | W2 |
2 Dodgers | 80 | 54 | .597 | 3 | +148 | L3 |
3 Braves | 79 | 55 | .590 | 4 | +113 | W4 |
4 Cubs | 76 | 58 | .567 | 7 | +119 | L2 |
5 Phillies | 74 | 60 | .552 | 9 | +23 | W1 |
6 Padres | 72 | 62 | .537 | 11 | +17 | W1 |
7 Diamondbacks | 71 | 63 | .530 | 12 | +5 | W2 |
| 8Marlins | 68 | 66 | .507 | 15 | +19 | W1 |
9 Cardinals | 67 | 68 | .496 | 16.5 | -13 | W1 |
10 Pirates | 65 | 70 | .481 | 18.5 | +24 | L1 |
11 Reds | 63 | 71 | .470 | 20 | -100 | W1 |
| 12Nationals | 63 | 73 | .463 | 21 | +12 | W1 |
13 Mets | 60 | 74 | .448 | 23 | -52 | L2 |
14 Giants | 54 | 79 | .406 | 28.5 | -74 | L1 |
| 15Rockies | 52 | 82 | .388 | 31 | -138 | L1 |
COL
VS
WSH
Pitchers
Gabriel Hughes
Juan Mejia
Nick Frasso
Jimmy Herget
Catchers
Brett Sullivan
Hunter Goodman
Infielders
Willi Castro
TJ Rumfield
Connor Norby
Ezequiel Tovar
Outfielders
Cole Carrigg
Troy Johnston
Zac Veen
Jordan Beck
Designated Hitters
Jake McCarthy
Pitchers
Jake Irvin
Tom Cosgrove
Erik Tolman
Clayton Beeter
Orlando Ribalta
Catchers
Keibert Ruiz
Infielders
Andres Chaparro
Brady House
Jorbit Vivas
Nasim Nunez
Outfielders
Dylan Crews
Daylen Lile
Jacob Young
Designated Hitters
CJ Abrams
Rockies
VS
Nationals
Batting
134
Team Games Played
136
4548
At Bats
4649
1147
Hits
1155
612
Runs Batted In
671
151
Home Runs
188
94
Stolen Bases
146
.252
Batting Average
.248
637
Runs
704
243
Doubles
232
26
Triples
27
1895
Total Bases
2005
433
Walks
473
1163
Strikeouts
1130
.323
On Base Percentage
.325
.417
Slugging Percentage
.431
.740
OBP Pct + SLG Pct
.756
134
Games Played
136
134
Games Started
136
67
Hit By Pitch
65
0.0
Wins Above Replacement
0.0
0.0
Offensive Wins Above Replacement
0.0
36
Caught Stealing
32
1
Is Qualified
1
626.0
Runs Created
674.4
4.7
Runs Created Per 27 Outs
5.0
.085
Walks Per Plate Appearance
.090
0.37
Walk To Strikeout Ratio
0.42
.164
Isolated Power
.183
.272
Secondary Average
.309
3.75
Pitches Per Plate Appearance
3.81
420
Extra Base Hits
447
5109
Plate Appearances
5237
30.1
At Bats Per Home Run
24.7
15
Sacrifice Hit
17
45
Sacrifice Flies
30
Pitching
134
Team Games Played
136
22
Quality Starts
30
52
Wins
63
82
Losses
73
30
Saves
33
53
Holds
69
1353
Hits
1192
724
Earned runs
629
185
Home Runs
187
441
Walks
491
909
Strikeouts
1051
6.9
Strikeouts Per 9 Innings
7.8
149.1
Pitches Per Start
151.0
1.52
Walks Plus Hits Per Inning Pitched
1.39
5.53
Earned Run Average
4.69
82
Losses
73
1177.2
Innings pitched
1207.0
.388
Win Percentage
.463
50
Save Opportunities
66
.288
Opponent Batting Average
.257
.351
Opponent's On-base pct.
.334
.490
Opponent's Slugging pct.
.429
.841
Opponent's OPB Pct + SLG Pct
.763
4694
At Bats
4642
301
Doubles
216
45
Triples
11
51
Batters Hit
71
109
Stolen Bases
100
134
Games Played
136
1
Complete Games
0
1
Shutouts
5
36
Wild Pitches
48
742
Runs Batted In
668
5
Balks
1
1177.2
Innings pitched
1207.0
6.9
Strikeouts Per 9 Innings
7.8
21
Caught Stealing
29
134
Games Started
136
0.0
Wins Above Replacement
0.0
1
Is Qualified
1
775
Runs
692
724
Earned Runs
629
2299
Total Bases
1991
Fielding
134
Team Games Played
136
1178
Full Innings
1207
4748
Total Chances
4944
3533
Putouts
3621
1129
Assists
1233
86
Errors
90
243
Double Plays
232
0.982
Fielding Percentage
0.982
35.6
Range Factor
36.2
0.0
Zone Rating
0.0
134
Games Played
136
0
Games Started
0
0.0
Defensive Wins Above Replacement
0.0
1
Qualified
1