

Rockies vs Twins Live Score (27 Jun, 2026)
Game Information
Stage
Standard
Season
2026
First Pitch
Sat, Jun 27, 7:10 pm
Venue
Target Field
Location
Minneapolis, Minnesota
Attendance
25,115
Live Situation
3Balls
2Strikes
0Outs
—Pitcher
—At Bat
Pitch Sequence
1
BALL
Slider
85 MPH
2
STRIKE FOUL
Sweeper
77 MPH
3
BALL
Sinker
91 MPH
4
STRIKE SWINGING
Sweeper
78 MPH
5
BALL
Sweeper
77 MPH
6
BALL IN PLAY
Slider
85 MPH
Injury Report

Team Stats
 COL
MIN


8
Runs
5
12
Hits
10
0
Errors
0
4
Home Runs
0
4
Walks
1
4
Strikeouts
4
Player Box Score
Colorado Rockies
| Player | H-AB | AB | R | H | RBI | HR | BB | K | #P | AVG | OBP | SLG |
|---|---|---|---|---|---|---|---|---|---|---|---|---|
 Jake McCarthy | 2-5 | 5 | 2 | 2 | 0 | 0 | 0 | 0 | 18 | .305 | .344 | .493 |
 Mickey Moniak | 0-3 | 3 | 0 | 0 | 1 | 0 | 0 | 0 | 8 | .270 | .322 | .571 |
 Ezequiel Tovar | 1-1 | 1 | 1 | 1 | 0 | 0 | 1 | 0 | 9 | .211 | .258 | .333 |
 Hunter Goodman | 3-5 | 5 | 3 | 3 | 5 | 3 | 0 | 1 | 17 | .246 | .312 | .543 |
 TJ Rumfield | 2-4 | 4 | 0 | 2 | 0 | 0 | 1 | 0 | 19 | .291 | .370 | .491 |
 Willi Castro | 0-5 | 5 | 0 | 0 | 0 | 0 | 0 | 1 | 16 | .275 | .346 | .398 |
 Tyler Freeman | 2-5 | 5 | 0 | 2 | 0 | 0 | 0 | 0 | 18 | .280 | .358 | .374 |
 Troy Johnston | 0-2 | 2 | 0 | 0 | 0 | 0 | 0 | 0 | 8 | .312 | .375 | .437 |
 Cole Carrigg | 0-1 | 1 | 1 | 0 | 0 | 0 | 1 | 1 | 11 | .245 | .369 | .491 |
 Kyle Karros | 1-3 | 3 | 1 | 1 | 2 | 1 | 1 | 1 | 12 | .253 | .344 | .391 |
 Brett Sullivan | 1-4 | 4 | 0 | 1 | 0 | 0 | 0 | 0 | 12 | .213 | .250 | .380 |
Minnesota Twins
| Player | H-AB | AB | R | H | RBI | HR | BB | K | #P | AVG | OBP | SLG |
|---|---|---|---|---|---|---|---|---|---|---|---|---|
 Trevor Larnach | 3-5 | 5 | 1 | 3 | 3 | 0 | 0 | 0 | 18 | .288 | .381 | .434 |
 Byron Buxton | 0-4 | 4 | 0 | 0 | 0 | 0 | 0 | 0 | 16 | .272 | .329 | .581 |
 Kody Clemens | 1-3 | 3 | 0 | 1 | 1 | 0 | 0 | 0 | 14 | .242 | .309 | .468 |
 Austin Martin | 0-2 | 2 | 0 | 0 | 0 | 0 | 0 | 0 | 8 | .243 | .351 | .322 |
 Josh Bell | 1-4 | 4 | 1 | 1 | 0 | 0 | 0 | 0 | 15 | .244 | .301 | .397 |
 Victor Caratini | 1-3 | 3 | 0 | 1 | 1 | 0 | 0 | 1 | 15 | .238 | .329 | .363 |
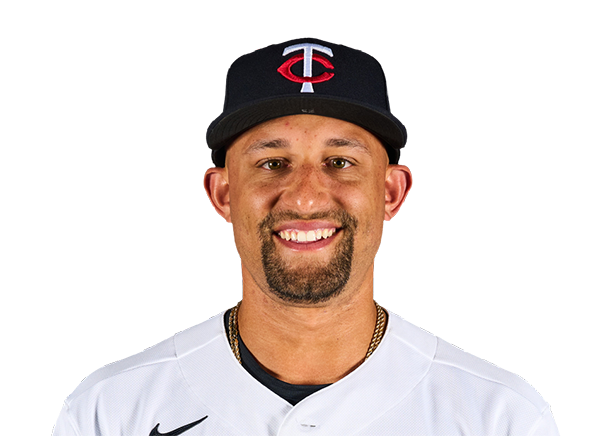 Royce Lewis | 0-4 | 4 | 0 | 0 | 0 | 0 | 0 | 1 | 18 | .212 | .289 | .369 |
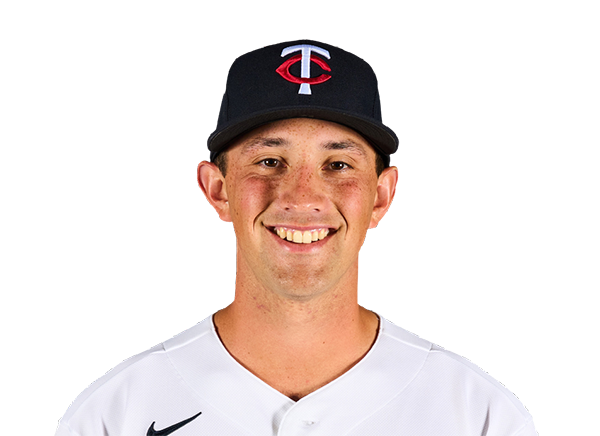 Brooks Lee | 2-4 | 4 | 1 | 2 | 0 | 0 | 0 | 0 | 17 | .244 | .301 | .443 |
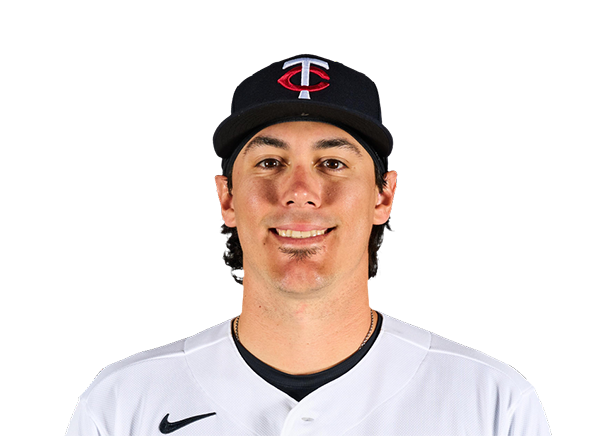 Tristan Gray | 1-4 | 4 | 1 | 1 | 0 | 0 | 0 | 2 | 20 | .248 | .287 | .366 |
 Luke Keaschall | 1-3 | 3 | 1 | 1 | 0 | 0 | 1 | 0 | 13 | .247 | .330 | .321 |
Colorado Rockies
| Player | IP | H | R | ER | BB | K | HR | PC-ST | ERA | PC |
|---|---|---|---|---|---|---|---|---|---|---|
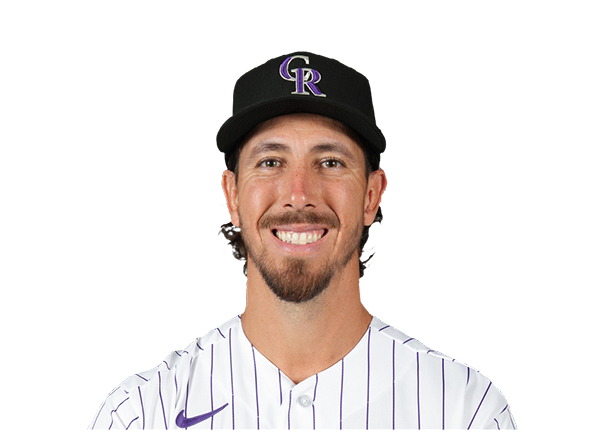 Michael Lorenzen | 5.2 | 7 | 2 | 2 | 0 | 1 | 0 | 92-63 | 6.83 | 92 |
 Victor Vodnik | 1.1 | 0 | 0 | 0 | 0 | 1 | 0 | 15-11 | 6.65 | 15 |
 Brennan Bernardino | 1.0 | 0 | 0 | 0 | 0 | 1 | 0 | 13-8 | 3.62 | 13 |
 Zach Agnos | 0.1 | 3 | 3 | 3 | 1 | 1 | 0 | 25-14 | 7.71 | 25 |
 Jimmy Herget | 0.2 | 0 | 0 | 0 | 0 | 0 | 0 | 9-4 | 4.05 | 9 |
Minnesota Twins
| Player | IP | H | R | ER | BB | K | HR | PC-ST | ERA | PC |
|---|---|---|---|---|---|---|---|---|---|---|
 Mike Paredes | 5.1 | 8 | 3 | 3 | 0 | 2 | 2 | 74-51 | 4.26 | 74 |
 Taylor Rogers | 0.2 | 0 | 0 | 0 | 1 | 1 | 0 | 9-7 | 6.16 | 9 |
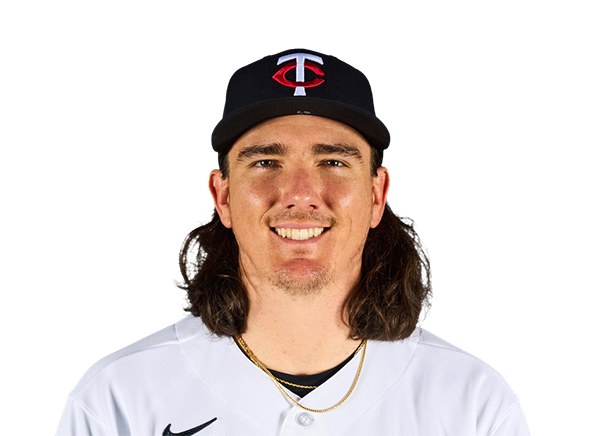 Kody Funderburk | 1.0 | 2 | 3 | 3 | 1 | 0 | 1 | 25-13 | 4.87 | 25 |
 Marco Raya | 2.0 | 2 | 2 | 2 | 2 | 1 | 1 | 40-23 | 9.00 | 40 |
H2H / Season Series
MIN3–2
COL
MIN5–8
COL
MIN9–8
COL
Last 5 Games
| Date | Opponent | Result |
|---|---|---|
| Aug 21 |  vs CLE | L1–9 |
| Aug 19 |  vs LAD | L4–6 |
| Aug 18 | vs LAD | L6–7 |
| Aug 17 | vs LAD | L5–11 |
| Aug 16 |  @ SF | W13–7 |
| Date | Opponent | Result |
|---|---|---|
| Aug 21 |  @ SD | L2–6 |
| Aug 19 |  vs ATL | W6–4 |
| Aug 18 | vs ATL | W4–1 |
| Aug 17 | vs ATL | W4–2 |
| Aug 16 |  vs PHI | L5–7 |
Standings
American League
| Team | W | L | PCT | GB | DIFF | STRK |
|---|---|---|---|---|---|---|
1 Rays | 76 | 52 | .594 | - | +43 | L2 |
2 White Sox | 67 | 61 | .523 | 9 | +47 | W1 |
3 Astros | 65 | 64 | .504 | 11.5 | -42 | W1 |
4 Yankees | 73 | 56 | .566 | 3.5 | +95 | L1 |
5 Red Sox | 69 | 59 | .539 | 7 | +97 | W1 |
6 Rangers | 64 | 65 | .496 | 12.5 | -45 | W2 |
7 Blue Jays | 64 | 67 | .489 | 13.5 | -50 | W1 |
| 8Twins | 63 | 66 | .488 | 13.5 | -45 | L1 |
| 9Guardians | 63 | 66 | .488 | 13.5 | -15 | W2 |
10 Orioles | 62 | 67 | .481 | 14.5 | -34 | W1 |
11 Tigers | 61 | 67 | .477 | 15 | +79 | L3 |
12 Mariners | 61 | 68 | .473 | 15.5 | -45 | W1 |
13 Royals | 56 | 74 | .431 | 21 | -97 | W6 |
14 Angels | 51 | 78 | .395 | 25.5 | -71 | L1 |
15 Athletics | 49 | 80 | .380 | 27.5 | -189 | L5 |
National League
| Team | W | L | PCT | GB | DIFF | STRK |
|---|---|---|---|---|---|---|
1 Brewers | 81 | 49 | .623 | - | +163 | W3 |
| 2Dodgers | 78 | 51 | .605 | 2.5 | +146 | W4 |
| 3Braves | 75 | 55 | .577 | 6 | +108 | L2 |
4 Cubs | 74 | 55 | .574 | 6.5 | +99 | L2 |
| 5Phillies | 71 | 58 | .550 | 9.5 | +16 | W7 |
| 6Padres | 69 | 60 | .535 | 11.5 | +7 | W1 |
7 Diamondbacks | 68 | 61 | .527 | 12.5 | +13 | W2 |
8 Cardinals | 66 | 64 | .508 | 15 | +9 | L1 |
9 Marlins | 65 | 64 | .504 | 15.5 | +15 | W1 |
10 Pirates | 63 | 67 | .485 | 18 | +30 | L1 |
11 Reds | 61 | 68 | .473 | 19.5 | -98 | L2 |
12 Nationals | 61 | 69 | .469 | 20 | +16 | L2 |
13 Mets | 58 | 71 | .450 | 22.5 | -44 | L1 |
| 14Giants | 52 | 76 | .406 | 28 | -78 | L2 |
| 15Rockies | 50 | 78 | .391 | 30 | -130 | L4 |
COL
VS
MIN
Pitchers
Michael Lorenzen
Victor Vodnik
Brennan Bernardino
Zach Agnos
Jimmy Herget
Catchers
Brett Sullivan
Infielders
Ezequiel Tovar
TJ Rumfield
Willi Castro
Kyle Karros
Outfielders
Jake McCarthy
Mickey Moniak
Tyler Freeman
Troy Johnston
Cole Carrigg
Designated Hitters
Hunter Goodman
Pitchers
Mike Paredes
Taylor Rogers
Kody Funderburk
Marco Raya
Catchers
Victor Caratini
Infielders
Kody Clemens
Royce Lewis
Brooks Lee
Tristan Gray
Luke Keaschall
Outfielders
Trevor Larnach
Byron Buxton
Austin Martin
Designated Hitters
Josh Bell
Rockies
VS
Twins
Batting
128
Team Games Played
129
4343
At Bats
4342
1099
Hits
1064
588
Runs Batted In
566
142
Home Runs
147
87
Stolen Bases
74
.253
Batting Average
.245
612
Runs
594
234
Doubles
210
26
Triples
19
1811
Total Bases
1753
405
Walks
420
1107
Strikeouts
1042
.323
On Base Percentage
.319
.417
Slugging Percentage
.404
.740
OBP Pct + SLG Pct
.723
128
Games Played
129
128
Games Started
129
63
Hit By Pitch
70
0.0
Wins Above Replacement
0.0
0.0
Offensive Wins Above Replacement
0.0
34
Caught Stealing
31
1
Is Qualified
1
595.2
Runs Created
569.2
4.7
Runs Created Per 27 Outs
4.5
.083
Walks Per Plate Appearance
.086
0.37
Walk To Strikeout Ratio
0.40
.164
Isolated Power
.159
.269
Secondary Average
.265
3.74
Pitches Per Plate Appearance
3.86
402
Extra Base Hits
376
4872
Plate Appearances
4876
30.6
At Bats Per Home Run
29.5
15
Sacrifice Hit
7
45
Sacrifice Flies
36
Pitching
128
Team Games Played
129
21
Quality Starts
43
50
Wins
63
78
Losses
66
29
Saves
37
50
Holds
88
1296
Hits
1100
693
Earned runs
586
179
Home Runs
148
417
Walks
470
871
Strikeouts
1067
7.0
Strikeouts Per 9 Innings
8.4
148.9
Pitches Per Start
149.9
1.52
Walks Plus Hits Per Inning Pitched
1.38
5.54
Earned Run Average
4.63
78
Losses
66
1125.2
Innings pitched
1138.2
.391
Win Percentage
.488
49
Save Opportunities
51
.289
Opponent Batting Average
.252
.352
Opponent's On-base pct.
.329
.492
Opponent's Slugging pct.
.412
.843
Opponent's OPB Pct + SLG Pct
.742
4487
At Bats
4366
290
Doubles
224
42
Triples
16
51
Batters Hit
55
100
Stolen Bases
109
128
Games Played
129
1
Complete Games
1
1
Shutouts
3
34
Wild Pitches
34
712
Runs Batted In
611
5
Balks
6
1125.2
Innings pitched
1138.2
7.0
Strikeouts Per 9 Innings
8.4
20
Caught Stealing
19
128
Games Started
129
0.0
Wins Above Replacement
0.0
1
Is Qualified
1
742
Runs
639
693
Earned Runs
586
2207
Total Bases
1800
Fielding
128
Team Games Played
129
1126
Full Innings
1139
4544
Total Chances
4457
3377
Putouts
3416
1083
Assists
982
84
Errors
59
234
Double Plays
210
0.982
Fielding Percentage
0.987
35.7
Range Factor
34.8
0.0
Zone Rating
0.0
128
Games Played
129
0
Games Started
0
0.0
Defensive Wins Above Replacement
0.0
1
Qualified
1