

Rockies vs White Sox Live Score (25 Sep, 2026)
Game Information
Stage
STD
Season
2026
First Pitch
Fri, Sep 25, 7:40 pm
Venue
Rate Field
Location
Chicago, Illinois
Venue Type
Outdoor
Broadcast
MLB.TV
Attendance
35,778
Live Situation
2Balls
2Strikes
0Outs
—Pitcher
—At Bat
Pitch Sequence
1
BALL
Sweeper
79 MPH
2
BALL
Four-seam FB
92 MPH
3
STRIKE FOUL
Four-seam FB
90 MPH
4
STRIKE FOUL
Four-seam FB
91 MPH
5
BALL IN PLAY
Four-seam FB
92 MPH
Injury Report





Team Stats
 COL
CHW


1
Runs
6
4
Hits
10
1
Errors
0
1
Home Runs
2
2
Walks
0
11
Strikeouts
6
Player Box Score
Colorado Rockies
| Player | H-AB | AB | R | H | RBI | HR | BB | K | #P | AVG | OBP | SLG |
|---|---|---|---|---|---|---|---|---|---|---|---|---|
 Jake McCarthy | 0-4 | 4 | 0 | 0 | 0 | 0 | 0 | 3 | 18 | .293 | .335 | .480 |
 Adael Amador | 0-3 | 3 | 0 | 0 | 0 | 0 | 1 | 1 | 17 | .276 | .360 | .500 |
 Hunter Goodman | 1-4 | 4 | 0 | 1 | 0 | 0 | 0 | 0 | 13 | .245 | .310 | .522 |
 TJ Rumfield | 2-4 | 4 | 1 | 2 | 1 | 1 | 0 | 0 | 21 | .299 | .389 | .452 |
 Kyle Karros | 0-3 | 3 | 0 | 0 | 0 | 0 | 1 | 2 | 18 | .256 | .351 | .419 |
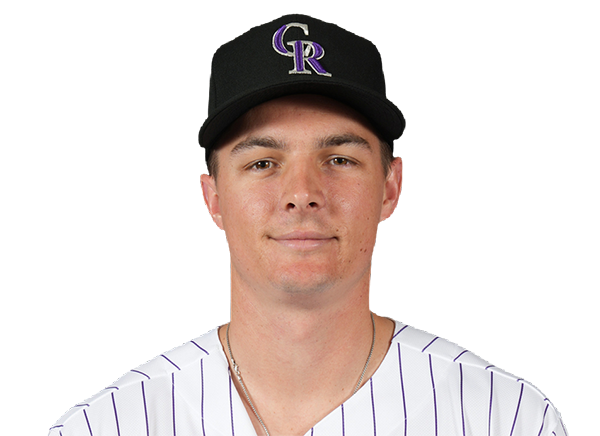 Mickey Moniak | 0-2 | 2 | 0 | 0 | 0 | 0 | 0 | 0 | 5 | .239 | .279 | .484 |
 Cole Carrigg | 0-2 | 2 | 0 | 0 | 0 | 0 | 0 | 1 | 14 | .275 | .338 | .466 |
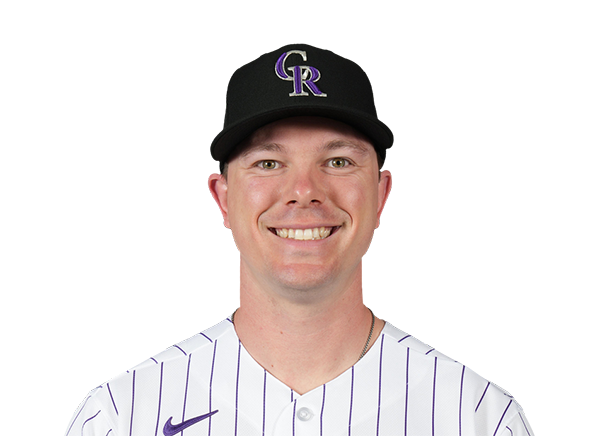 Troy Johnston | 0-3 | 3 | 0 | 0 | 0 | 0 | 0 | 1 | 7 | .280 | .351 | .397 |
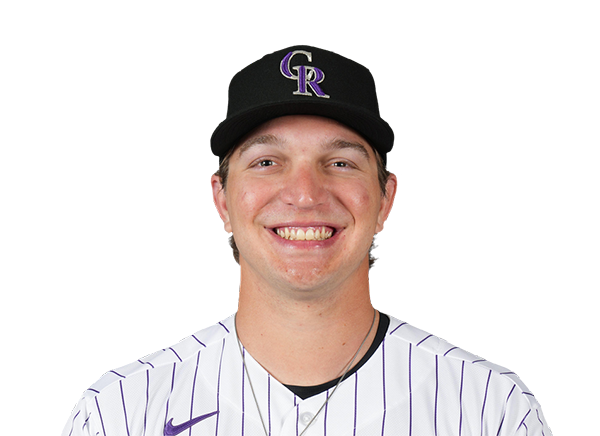 Zac Veen | 0-3 | 3 | 0 | 0 | 0 | 0 | 0 | 1 | 9 | .232 | .312 | .435 |
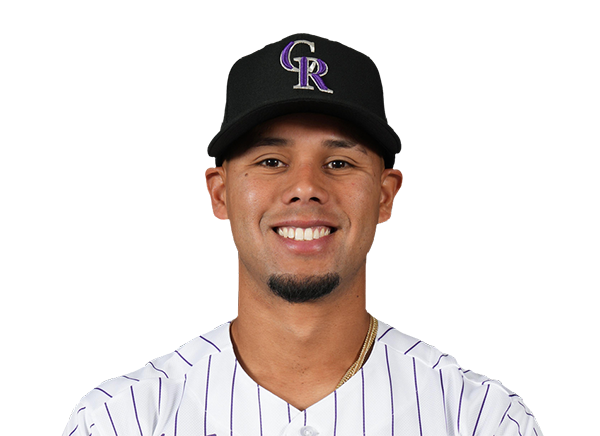 Ezequiel Tovar | 1-3 | 3 | 0 | 1 | 0 | 0 | 0 | 2 | 15 | .216 | .262 | .345 |
Chicago White Sox
| Player | H-AB | AB | R | H | RBI | HR | BB | K | #P | AVG | OBP | SLG |
|---|---|---|---|---|---|---|---|---|---|---|---|---|
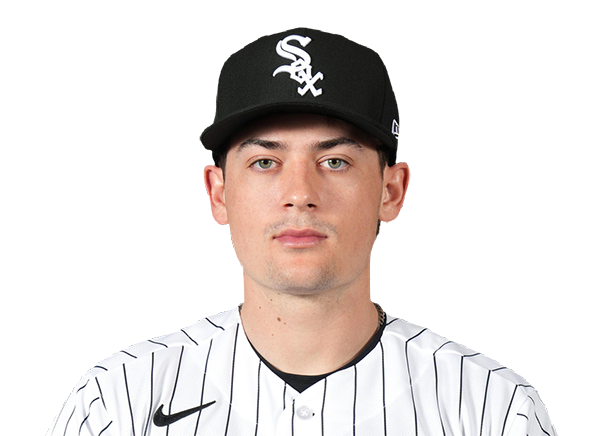 Sam Antonacci | 3-4 | 4 | 1 | 3 | 0 | 0 | 0 | 0 | 6 | .275 | .368 | .393 |
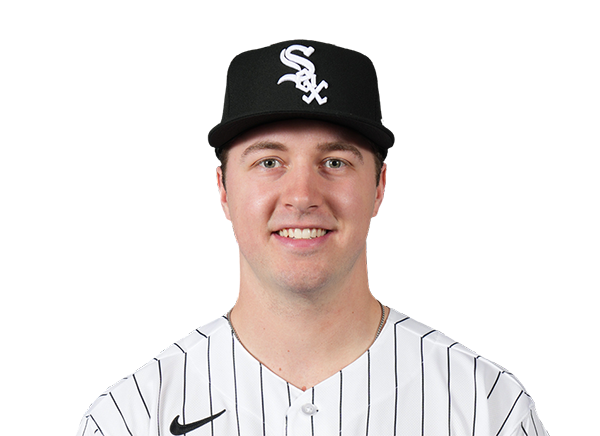 Kyle Teel | 1-3 | 3 | 1 | 1 | 2 | 0 | 0 | 0 | 10 | .200 | .331 | .357 |
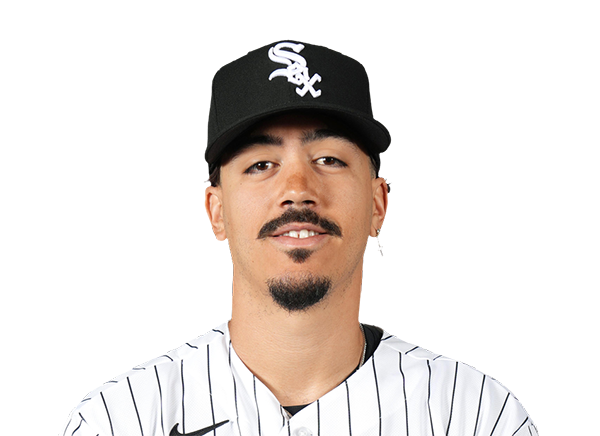 Miguel Vargas | 0-3 | 3 | 0 | 0 | 1 | 0 | 0 | 1 | 13 | .251 | .361 | .476 |
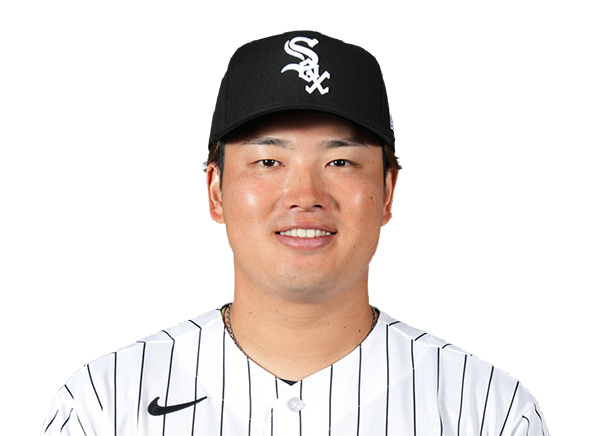 Munetaka Murakami | 3-4 | 4 | 2 | 3 | 3 | 2 | 0 | 1 | 15 | .209 | .351 | .483 |
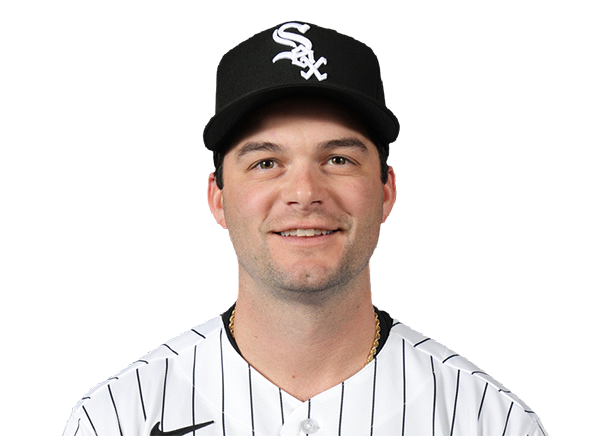 Andrew Benintendi | 0-4 | 4 | 0 | 0 | 0 | 0 | 0 | 3 | 22 | .239 | .300 | .406 |
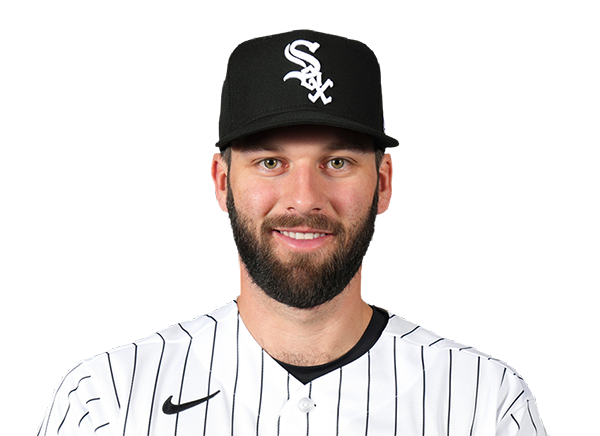 Tristan Peters | 0-4 | 4 | 0 | 0 | 0 | 0 | 0 | 0 | 8 | .266 | .338 | .440 |
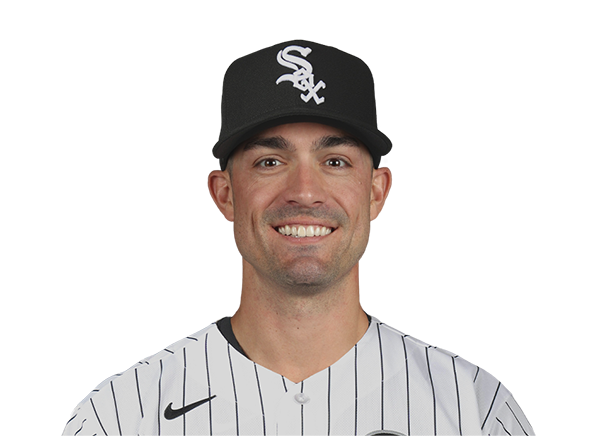 Randal Grichuk | 1-3 | 3 | 0 | 1 | 0 | 0 | 0 | 0 | 12 | .291 | .316 | .566 |
 Brenton Doyle | 0-0 | 0 | 0 | 0 | 0 | 0 | 0 | 0 | 0 | .230 | .273 | .333 |
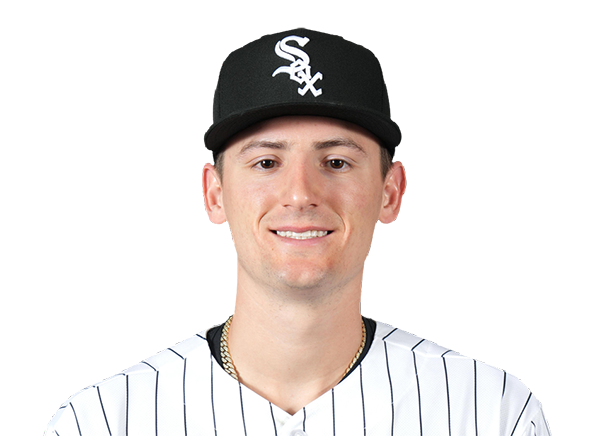 Colson Montgomery | 0-3 | 3 | 0 | 0 | 0 | 0 | 0 | 1 | 14 | .199 | .285 | .407 |
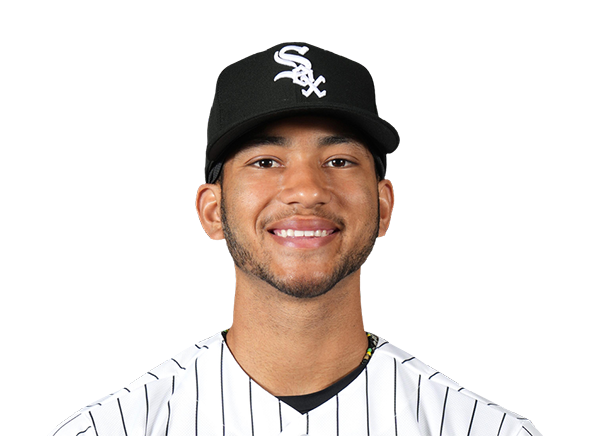 Braden Montgomery | 2-3 | 3 | 2 | 2 | 0 | 0 | 0 | 0 | 13 | .226 | .314 | .352 |
Colorado Rockies
| Player | IP | H | R | ER | BB | K | HR | PC-ST | ERA | PC |
|---|---|---|---|---|---|---|---|---|---|---|
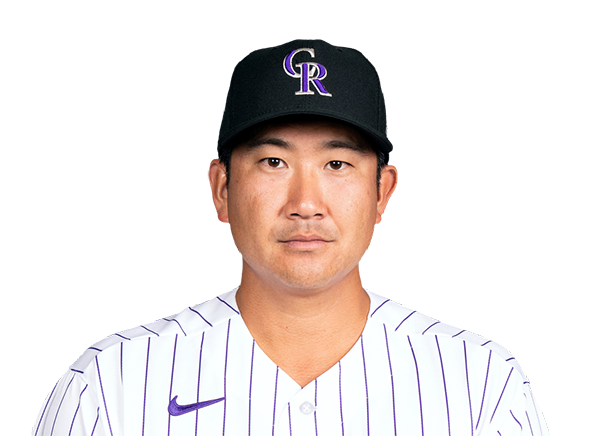 Tomoyuki Sugano | 6.2 | 6 | 4 | 4 | 0 | 5 | 2 | 90-57 | 5.37 | 90 |
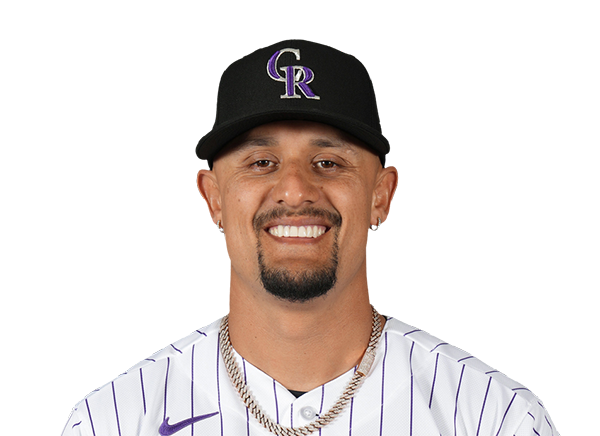 Brennan Bernardino | 0.1 | 0 | 0 | 0 | 0 | 0 | 0 | 3-3 | 2.87 | 3 |
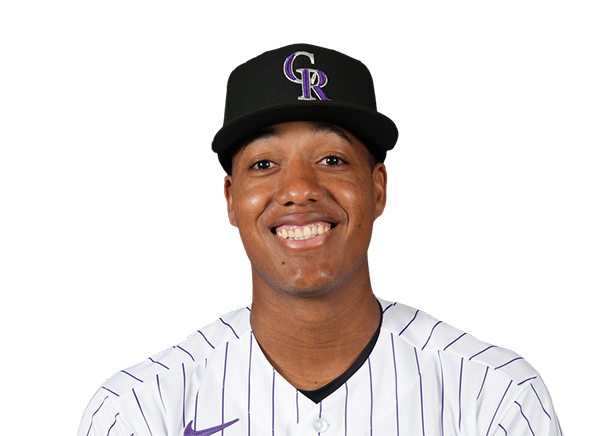 Juan Mejia | 1.0 | 4 | 2 | 2 | 0 | 1 | 0 | 20-14 | 5.27 | 20 |
Chicago White Sox
| Player | IP | H | R | ER | BB | K | HR | PC-ST | ERA | PC |
|---|---|---|---|---|---|---|---|---|---|---|
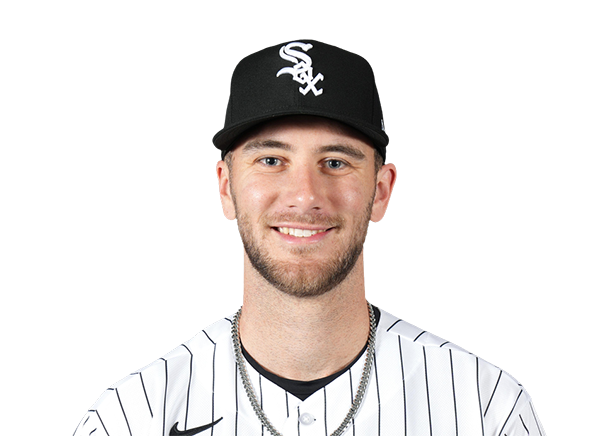 Sean Burke | 5.1 | 4 | 1 | 1 | 1 | 7 | 1 | 89-62 | 3.34 | 89 |
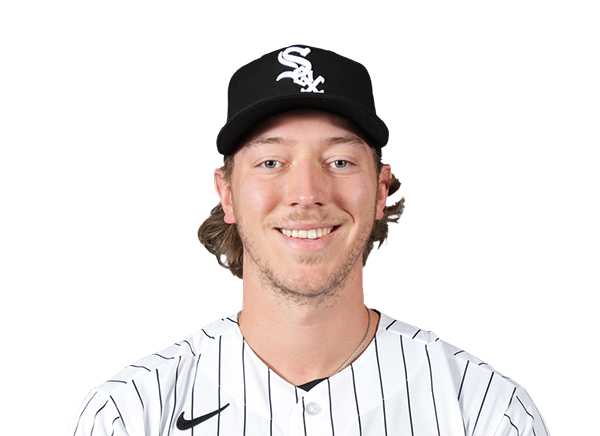 Hagen Smith | 0.2 | 0 | 0 | 0 | 1 | 1 | 0 | 18-11 | 1.29 | 18 |
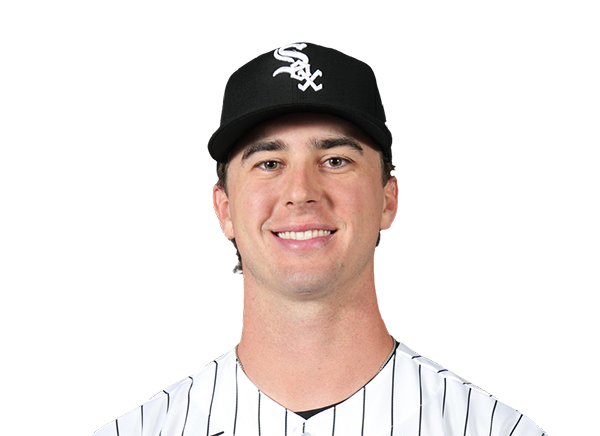 Grant Taylor | 2.0 | 0 | 0 | 0 | 0 | 3 | 0 | 17-14 | 2.25 | 17 |
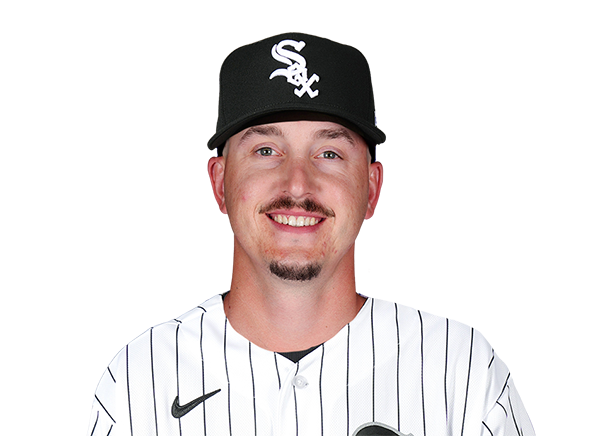 Bryan Hudson | 1.0 | 0 | 0 | 0 | 0 | 0 | 0 | 13-8 | 3.38 | 13 |
H2H / Season Series
CHW6–1
COL
CHW12–3
COL
COL5–4
CHW
Last 5 Games
| Date | Opponent | Result |
|---|---|---|
| Sep 25 | @ CHW | L1–6 |
| Sep 24 |  vs ARI | L8–12 |
| Sep 23 | vs ARI | L3–5 |
| Sep 22 | vs ARI | L2–7 |
| Sep 20 |  vs SEA | L1–2 |
| Date | Opponent | Result |
|---|---|---|
| Sep 25 | vs COL | W6–1 |
| Sep 24 |  @ KC | W9–1 |
| Sep 23 | @ KC | L4–5 |
| Sep 22 | @ KC | W14–11 |
| Sep 20 |  vs DET | W8–1 |
Standings
American League
| Team | W | L | PCT | GB | DIFF | STRK |
|---|---|---|---|---|---|---|
1 Rays | 97 | 63 | .606 | - | +79 | W1 |
2 Guardians | 84 | 76 | .525 | 13 | +6 | W2 |
3 Astros | 79 | 81 | .494 | 18 | -52 | L1 |
4 Yankees | 93 | 68 | .578 | 4.5 | +138 | W1 |
5 Red Sox | 87 | 74 | .540 | 10.5 | +82 | W2 |
| 6White Sox | 83 | 77 | .519 | 14 | +57 | W2 |
7 Rangers | 79 | 81 | .494 | 18 | -48 | L1 |
8 Orioles | 79 | 82 | .491 | 18.5 | -21 | L1 |
9 Blue Jays | 78 | 82 | .488 | 19 | -46 | W1 |
10 Twins | 76 | 84 | .475 | 21 | -56 | W3 |
| 11Tigers | 75 | 85 | .469 | 22 | +72 | W1 |
| 12Mariners | 74 | 86 | .463 | 23 | -66 | L2 |
| 13Royals | 68 | 92 | .425 | 29 | -115 | L2 |
14 Athletics | 64 | 96 | .400 | 33 | -218 | W1 |
15 Angels | 62 | 98 | .388 | 35 | -89 | W2 |
National League
| Team | W | L | PCT | GB | DIFF | STRK |
|---|---|---|---|---|---|---|
1 Brewers | 101 | 59 | .631 | - | +211 | W3 |
2 Dodgers | 98 | 62 | .613 | 3 | +196 | W1 |
3 Braves | 93 | 67 | .581 | 8 | +113 | L2 |
4 Padres | 89 | 71 | .556 | 12 | +33 | L1 |
5 Cubs | 88 | 73 | .547 | 13.5 | +143 | L2 |
6 Phillies | 87 | 73 | .544 | 14 | +22 | L3 |
| 7Diamondbacks | 86 | 74 | .538 | 15 | +17 | W6 |
8 Pirates | 81 | 79 | .506 | 20 | +27 | L1 |
9 Marlins | 79 | 81 | .494 | 22 | +6 | W1 |
10 Cardinals | 77 | 83 | .481 | 24 | -26 | L2 |
11 Nationals | 76 | 84 | .475 | 25 | +10 | W3 |
12 Reds | 74 | 86 | .463 | 27 | -160 | L1 |
13 Mets | 73 | 87 | .456 | 28 | -36 | L2 |
14 Giants | 65 | 95 | .406 | 36 | -86 | L3 |
| 15Rockies | 57 | 103 | .356 | 44 | -193 | L5 |
COL
VS
CHW
Pitchers
Tomoyuki Sugano
Catchers
Hunter Goodman
Infielders
Adael Amador
TJ Rumfield
Kyle Karros
Ezequiel Tovar
Outfielders
Jake McCarthy
Mickey Moniak
Troy Johnston
Designated Hitters
Zac Veen
Pitchers
Sean Burke
Catchers
Kyle Teel
Infielders
Sam Antonacci
Miguel Vargas
Munetaka Murakami
Colson Montgomery
Outfielders
Tristan Peters
Randal Grichuk
Braden Montgomery
Designated Hitters
Andrew Benintendi
Rockies
VS
White Sox
Batting
160
Team Games Played
160
5451
At Bats
5361
1382
Hits
1266
710
Runs Batted In
730
176
Home Runs
206
109
Stolen Bases
90
.254
Batting Average
.236
741
Runs
766
281
Doubles
248
39
Triples
18
2269
Total Bases
2168
495
Walks
584
1392
Strikeouts
1479
.322
On Base Percentage
.321
.416
Slugging Percentage
.404
.738
OBP Pct + SLG Pct
.725
160
Games Played
160
160
Games Started
160
80
Hit By Pitch
100
0.0
Wins Above Replacement
0.0
0.0
Offensive Wins Above Replacement
0.0
41
Caught Stealing
35
1
Is Qualified
1
743.7
Runs Created
721.8
4.7
Runs Created Per 27 Outs
4.6
.081
Walks Per Plate Appearance
.096
0.36
Walk To Strikeout Ratio
0.39
.163
Isolated Power
.168
.266
Secondary Average
.287
3.74
Pitches Per Plate Appearance
3.88
496
Extra Base Hits
472
6098
Plate Appearances
6112
31.0
At Bats Per Home Run
26.0
21
Sacrifice Hit
27
50
Sacrifice Flies
38
Pitching
160
Team Games Played
160
24
Quality Starts
34
57
Wins
83
103
Losses
77
33
Saves
40
60
Holds
63
1619
Hits
1300
874
Earned runs
650
222
Home Runs
176
526
Walks
566
1098
Strikeouts
1320
7.0
Strikeouts Per 9 Innings
8.4
149.4
Pitches Per Start
150.4
1.53
Walks Plus Hits Per Inning Pitched
1.31
5.60
Earned Run Average
4.11
103
Losses
77
1404.2
Innings pitched
1422.2
.356
Win Percentage
.519
58
Save Opportunities
70
.289
Opponent Batting Average
.242
.352
Opponent's On-base pct.
.323
.491
Opponent's Slugging pct.
.397
.843
Opponent's OPB Pct + SLG Pct
.720
5600
At Bats
5361
354
Doubles
258
55
Triples
22
60
Batters Hit
90
127
Stolen Bases
119
160
Games Played
160
1
Complete Games
0
1
Shutouts
9
46
Wild Pitches
70
897
Runs Batted In
682
5
Balks
9
1404.2
Innings pitched
1422.2
7.0
Strikeouts Per 9 Innings
8.4
30
Caught Stealing
41
160
Games Started
160
0.0
Wins Above Replacement
0.0
1
Is Qualified
1
934
Runs
709
874
Earned Runs
650
2749
Total Bases
2130
Fielding
160
Team Games Played
160
1405
Full Innings
1423
5647
Total Chances
5647
4214
Putouts
4268
1335
Assists
1298
98
Errors
81
281
Double Plays
248
0.983
Fielding Percentage
0.986
35.6
Range Factor
35.2
0.0
Zone Rating
0.0
160
Games Played
160
0
Games Started
0
0.0
Defensive Wins Above Replacement
0.0
1
Qualified
1