

Rockies vs Yankees Live Score (10 Sep, 2026)
Game Information
Stage
STD
Season
2026
First Pitch
Thu, Sep 10, 7:05 pm
Venue
Yankee Stadium
Location
Bronx, New York
Venue Type
Outdoor
Broadcast
MLB.TV
Attendance
40,706
Live Situation
0Balls
3Strikes
0Outs
—Pitcher
—At Bat
Pitch Sequence
1
STRIKE FOUL
Four-seam FB
97 MPH
2
STRIKE FOUL
Slider
88 MPH
3
STRIKE SWINGING
Four-seam FB
97 MPH
Injury Report


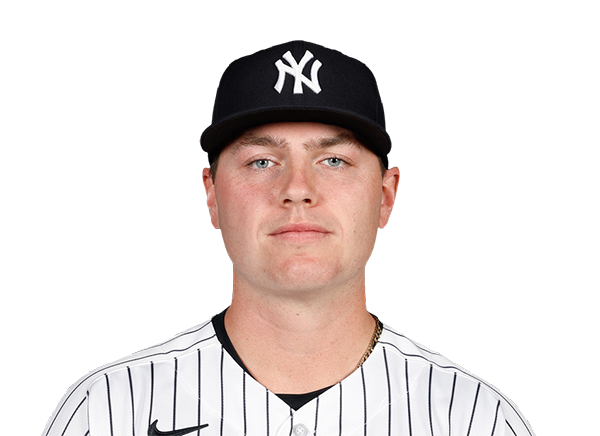
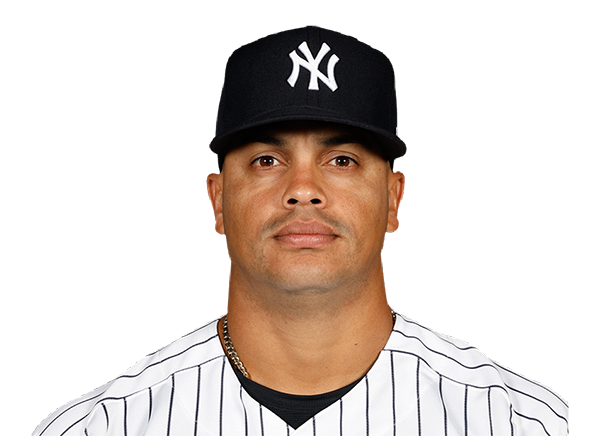
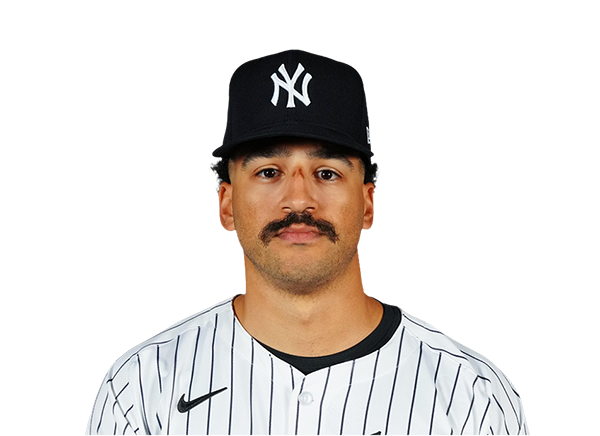
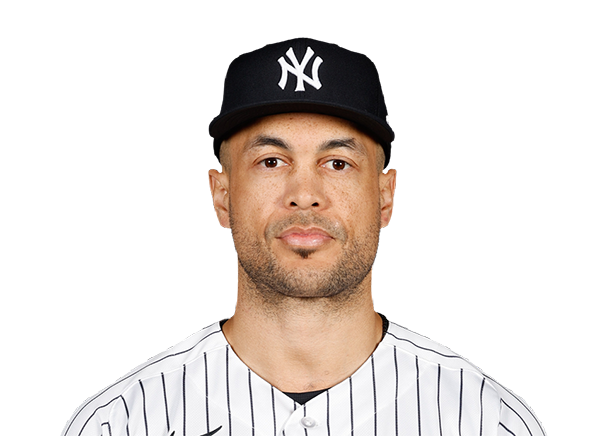
Team Stats
 COL
NYY


3
Runs
10
8
Hits
11
0
Errors
2
1
Home Runs
2
5
Walks
5
12
Strikeouts
5
Player Box Score
Colorado Rockies
| Player | H-AB | AB | R | H | RBI | HR | BB | K | #P | AVG | OBP | SLG |
|---|---|---|---|---|---|---|---|---|---|---|---|---|
 Jake McCarthy | 2-5 | 5 | 0 | 2 | 1 | 0 | 0 | 1 | 20 | .293 | .337 | .483 |
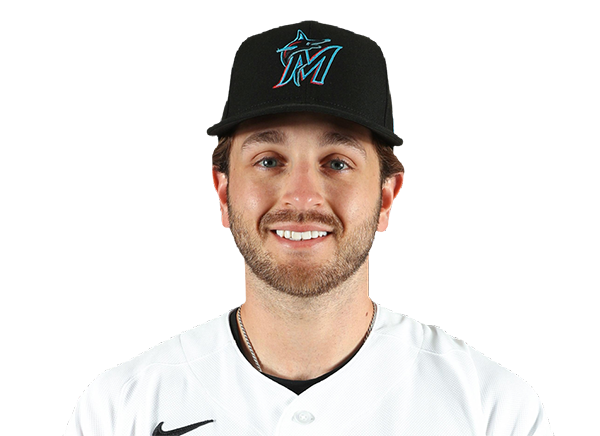 Connor Norby | 0-3 | 3 | 0 | 0 | 0 | 0 | 1 | 2 | 22 | .225 | .329 | .361 |
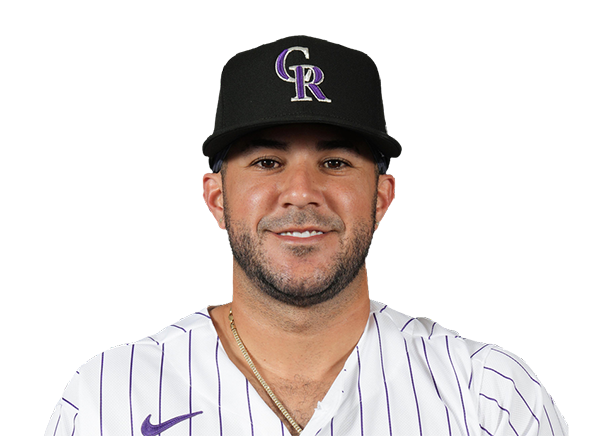 Vimael Machin | 1-1 | 1 | 0 | 1 | 0 | 0 | 0 | 0 | 2 | .333 | .333 | .333 |
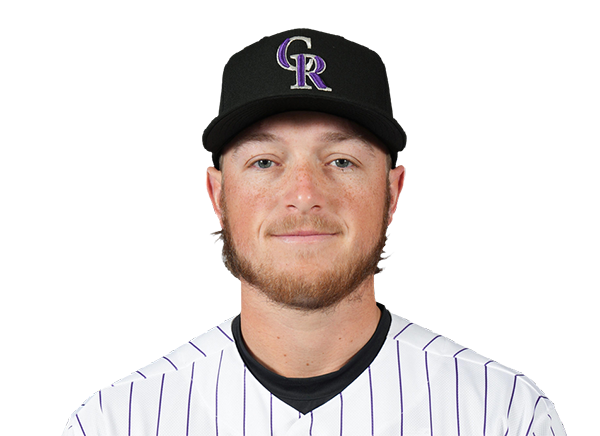 Hunter Goodman | 0-5 | 5 | 0 | 0 | 0 | 0 | 0 | 1 | 14 | .244 | .310 | .522 |
 TJ Rumfield | 0-4 | 4 | 0 | 0 | 0 | 0 | 1 | 1 | 21 | .295 | .388 | .453 |
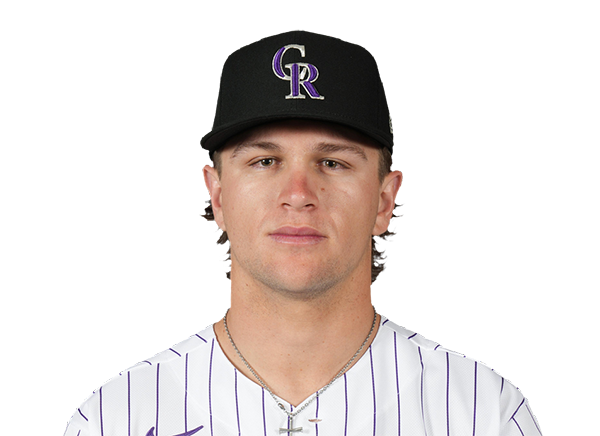 Cole Carrigg | 1-3 | 3 | 0 | 1 | 0 | 0 | 0 | 2 | 19 | .262 | .337 | .446 |
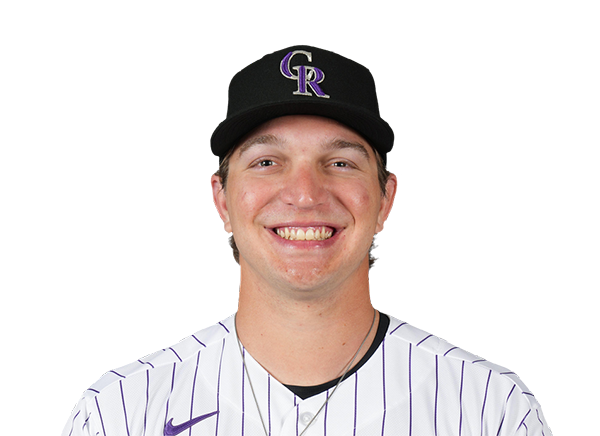 Zac Veen | 0-1 | 1 | 1 | 0 | 0 | 0 | 1 | 1 | 10 | .256 | .360 | .488 |
 Kyle Karros | 1-4 | 4 | 1 | 1 | 1 | 1 | 0 | 3 | 16 | .261 | .355 | .426 |
 Adael Amador | 1-4 | 4 | 0 | 1 | 0 | 0 | 0 | 1 | 21 | .333 | .400 | .639 |
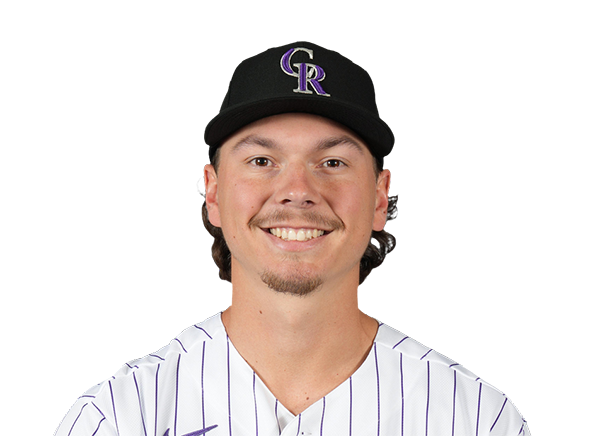 Jordan Beck | 0-3 | 3 | 0 | 0 | 0 | 0 | 1 | 0 | 16 | .193 | .250 | .293 |
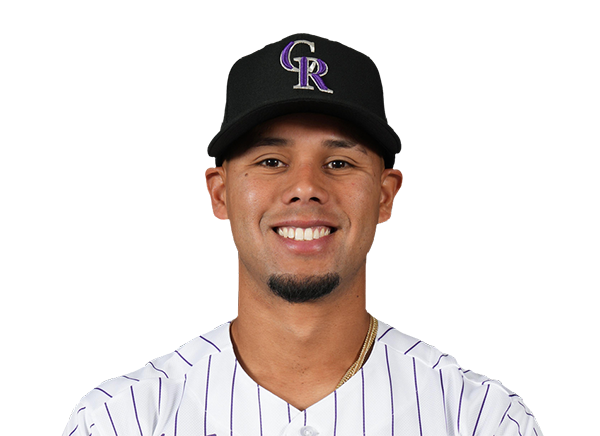 Ezequiel Tovar | 2-3 | 3 | 1 | 2 | 0 | 0 | 1 | 0 | 19 | .214 | .261 | .333 |
New York Yankees
| Player | H-AB | AB | R | H | RBI | HR | BB | K | #P | AVG | OBP | SLG |
|---|---|---|---|---|---|---|---|---|---|---|---|---|
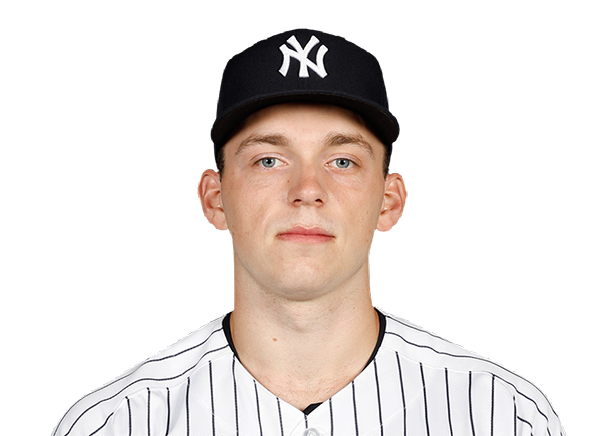 Ben Rice | 1-5 | 5 | 1 | 1 | 0 | 0 | 0 | 1 | 16 | .256 | .351 | .515 |
 Cody Bellinger | 2-3 | 3 | 1 | 2 | 1 | 0 | 0 | 1 | 12 | .266 | .344 | .424 |
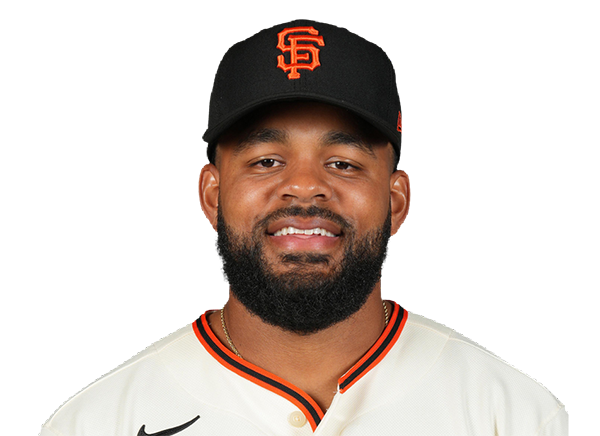 Heliot Ramos | 0-1 | 1 | 0 | 0 | 0 | 0 | 0 | 0 | 3 | .242 | .302 | .401 |
 Jasson Dominguez | 0-4 | 4 | 1 | 0 | 0 | 0 | 1 | 2 | 27 | .225 | .267 | .368 |
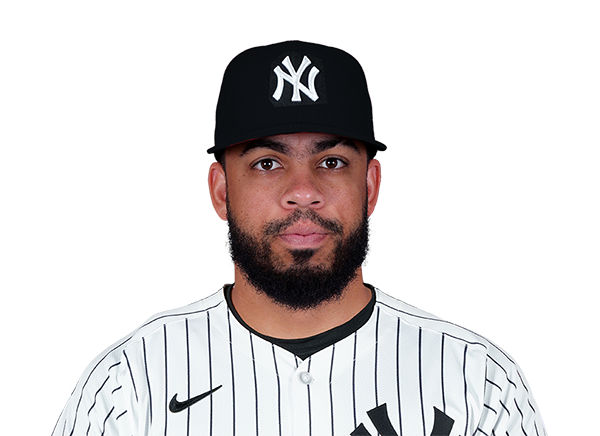 Luis Garcia Jr. | 1-5 | 5 | 1 | 1 | 2 | 1 | 0 | 0 | 14 | .287 | .319 | .553 |
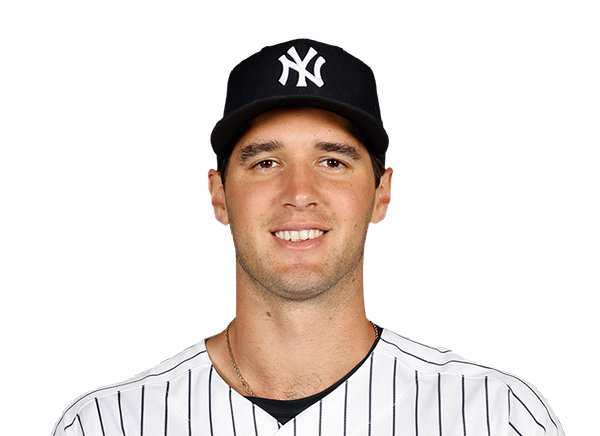 Spencer Jones | 3-4 | 4 | 1 | 3 | 2 | 0 | 0 | 0 | 11 | .255 | .333 | .452 |
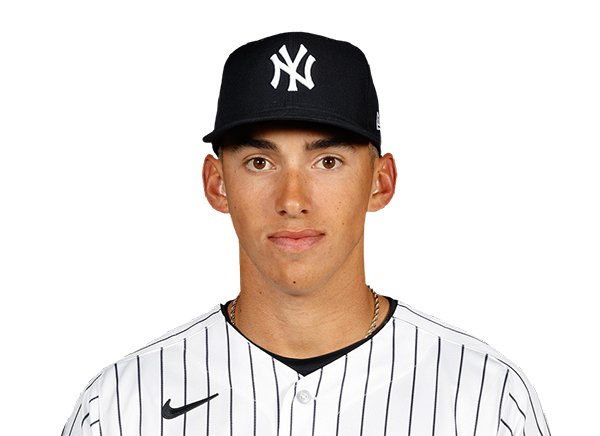 George Lombard Jr. | 0-4 | 4 | 0 | 0 | 0 | 0 | 0 | 1 | 10 | .230 | .288 | .360 |
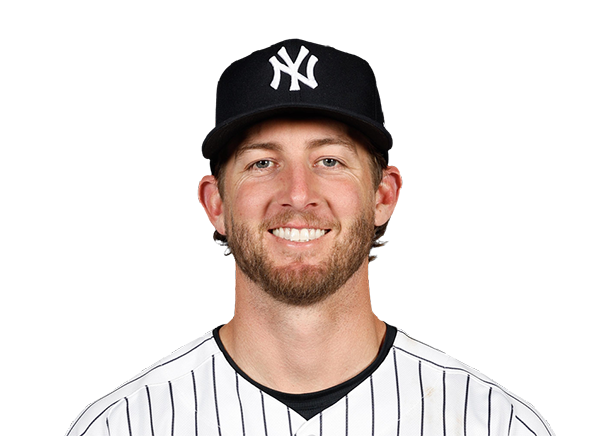 Ryan McMahon | 1-3 | 3 | 2 | 1 | 0 | 0 | 1 | 0 | 19 | .214 | .283 | .358 |
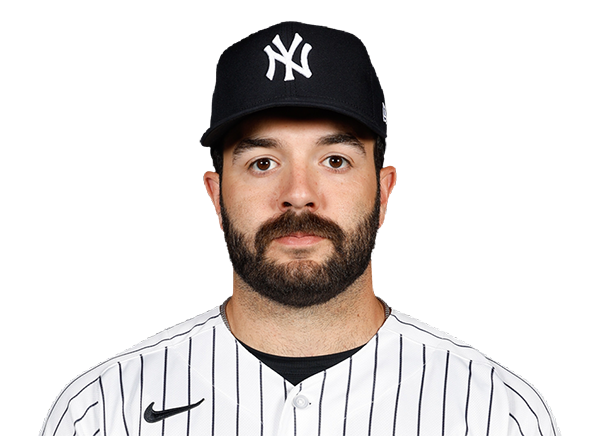 Austin Wells | 0-1 | 1 | 2 | 0 | 0 | 0 | 3 | 0 | 19 | .181 | .283 | .303 |
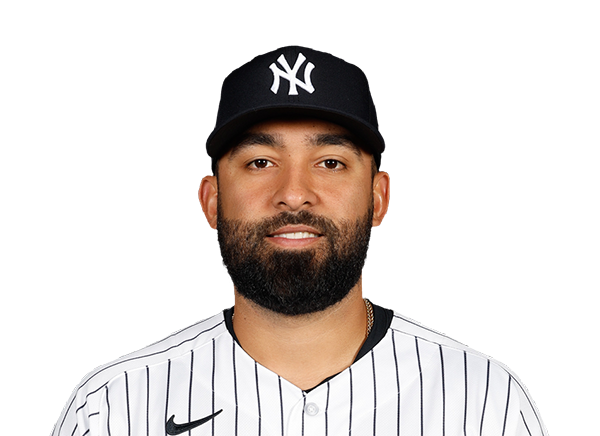 Ali Sanchez | 0-0 | 0 | 0 | 0 | 0 | 0 | 0 | 0 | 0 | .235 | .264 | .309 |
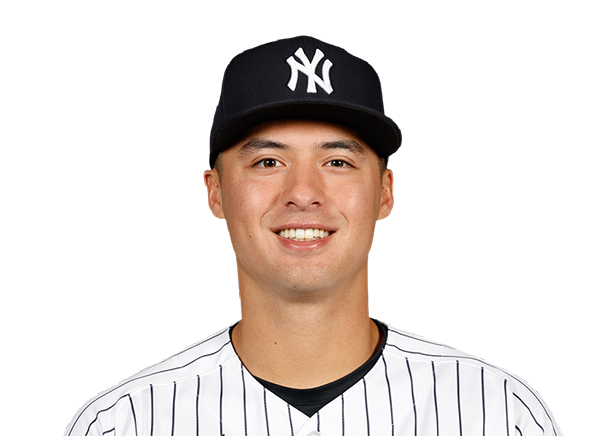 Anthony Volpe | 3-4 | 4 | 1 | 3 | 5 | 1 | 0 | 0 | 21 | .251 | .333 | .349 |
Colorado Rockies
| Player | IP | H | R | ER | BB | K | HR | PC-ST | ERA | PC |
|---|---|---|---|---|---|---|---|---|---|---|
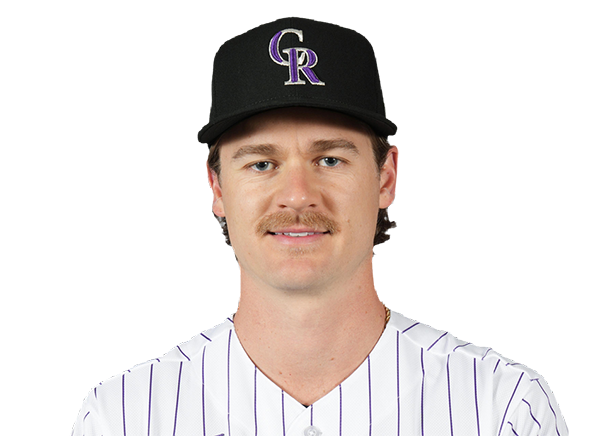 Ryan Feltner | 5.0 | 6 | 4 | 4 | 1 | 2 | 1 | 83-52 | 5.88 | 83 |
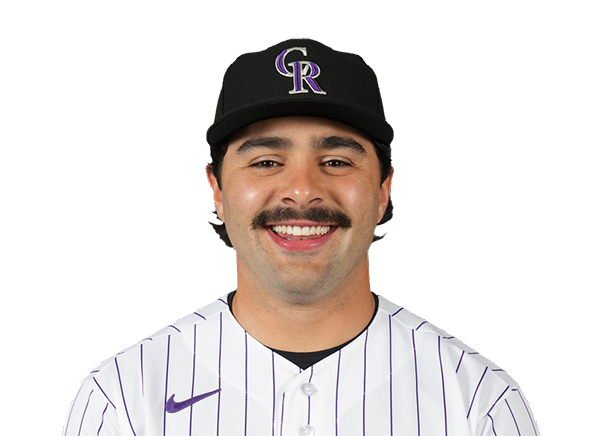 Zach Agnos | 1.2 | 4 | 4 | 4 | 3 | 1 | 0 | 45-24 | 5.93 | 45 |
 Jimmy Herget | 1.1 | 1 | 2 | 2 | 1 | 2 | 1 | 24-12 | 6.26 | 24 |
New York Yankees
| Player | IP | H | R | ER | BB | K | HR | PC-ST | ERA | PC |
|---|---|---|---|---|---|---|---|---|---|---|
 Max Fried | 3.1 | 1 | 1 | 1 | 2 | 7 | 1 | 80-48 | 2.73 | 80 |
 Michael Fulmer | 0.2 | 0 | 0 | 0 | 0 | 1 | 0 | 9-7 | 1.86 | 9 |
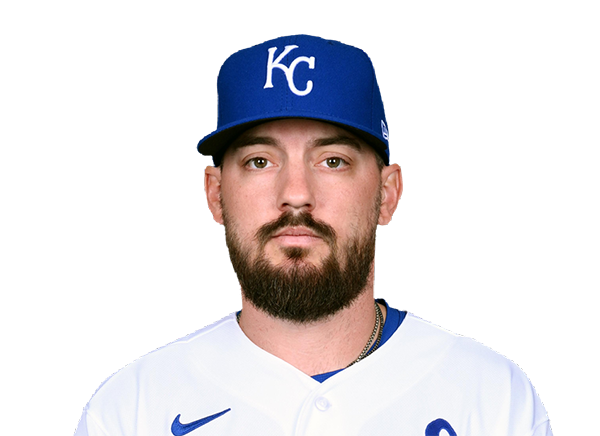 John Schreiber | 1.1 | 1 | 0 | 0 | 0 | 1 | 0 | 13-10 | 3.27 | 13 |
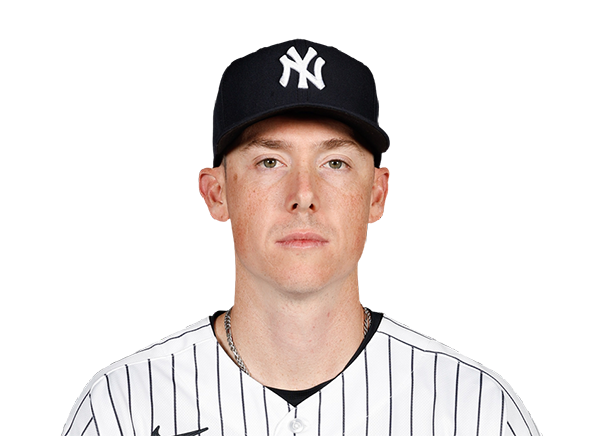 Ryan Yarbrough | 1.1 | 1 | 1 | 1 | 1 | 1 | 0 | 29-14 | 3.98 | 29 |
 Brent Headrick | 0.1 | 1 | 0 | 0 | 1 | 0 | 0 | 8-4 | 1.86 | 8 |
 Luis Gil | 2.0 | 4 | 1 | 0 | 1 | 2 | 0 | 41-31 | 5.40 | 41 |
H2H / Season Series
NYY10–3
COL
NYY6–1
COL
NYY5–3
COL
Last 5 Games
| Date | Opponent | Result |
|---|---|---|
| Sep 10 | @ NYY | L3–10 |
| Sep 9 | @ NYY | L1–6 |
| Sep 8 | @ NYY | L3–5 |
| Sep 6 |  vs STL | L8–10 |
| Sep 5 | vs STL | W10–7 |
| Date | Opponent | Result |
|---|---|---|
| Sep 10 | vs COL | W10–3 |
| Sep 9 | vs COL | W6–1 |
| Sep 8 | vs COL | W5–3 |
| Sep 6 |  @ SD | L3–4 |
| Sep 5 | @ SD | W5–1 |
Standings
American League
| Team | W | L | PCT | GB | DIFF | STRK |
|---|---|---|---|---|---|---|
1 Rays | 87 | 59 | .596 | - | +56 | L1 |
2 White Sox | 75 | 71 | .514 | 12 | +39 | L3 |
3 Astros | 75 | 72 | .510 | 12.5 | -40 | W1 |
| 4Yankees | 84 | 62 | .575 | 3 | +131 | W3 |
5 Red Sox | 80 | 67 | .544 | 7.5 | +82 | L2 |
6 Guardians | 74 | 73 | .503 | 13.5 | -16 | L1 |
7 Blue Jays | 73 | 74 | .497 | 14.5 | -39 | L1 |
8 Rangers | 72 | 75 | .490 | 15.5 | -41 | L2 |
9 Orioles | 71 | 76 | .483 | 16.5 | -27 | W1 |
10 Twins | 69 | 77 | .473 | 18 | -53 | L1 |
11 Mariners | 69 | 78 | .469 | 18.5 | -74 | W2 |
12 Tigers | 67 | 79 | .459 | 20 | +55 | W1 |
13 Royals | 65 | 82 | .442 | 22.5 | -88 | W1 |
14 Athletics | 59 | 88 | .401 | 28.5 | -187 | W1 |
15 Angels | 56 | 90 | .384 | 31 | -73 | W2 |
National League
| Team | W | L | PCT | GB | DIFF | STRK |
|---|---|---|---|---|---|---|
1 Brewers | 91 | 56 | .619 | - | +172 | W3 |
2 Dodgers | 89 | 57 | .610 | 1.5 | +169 | W7 |
3 Braves | 86 | 61 | .585 | 5 | +110 | W1 |
4 Phillies | 82 | 65 | .558 | 9 | +37 | L1 |
5 Cubs | 81 | 66 | .551 | 10 | +128 | L4 |
| 6Padres | 78 | 68 | .534 | 12.5 | +17 | W4 |
7 Diamondbacks | 78 | 69 | .531 | 13 | -1 | L1 |
8 Pirates | 74 | 73 | .503 | 17 | +36 | W4 |
9 Marlins | 72 | 75 | .490 | 19 | +7 | L3 |
| 10Cardinals | 72 | 75 | .490 | 19 | -12 | L3 |
11 Reds | 69 | 77 | .473 | 21.5 | -122 | L3 |
12 Mets | 68 | 78 | .466 | 22.5 | -40 | W4 |
13 Nationals | 67 | 81 | .453 | 24.5 | 0 | L7 |
14 Giants | 62 | 85 | .422 | 29 | -72 | W3 |
| 15Rockies | 55 | 91 | .377 | 35.5 | -154 | L4 |
COL
VS
NYY
Pitchers
Ryan Feltner
Catchers
Hunter Goodman
Infielders
Connor Norby
TJ Rumfield
Kyle Karros
Ezequiel Tovar
Outfielders
Jake McCarthy
Cole Carrigg
Jordan Beck
Designated Hitters
Adael Amador
Pitchers
Max Fried
Catchers
Austin Wells
Infielders
Luis Garcia Jr.
George Lombard Jr.
Ryan McMahon
Anthony Volpe
Outfielders
Cody Bellinger
Jasson Dominguez
Spencer Jones
Designated Hitters
Ben Rice
Rockies
VS
Yankees
Batting
146
Team Games Played
146
4962
At Bats
4823
1252
Hits
1130
657
Runs Batted In
636
162
Home Runs
199
100
Stolen Bases
140
.252
Batting Average
.234
686
Runs
667
259
Doubles
211
32
Triples
17
2061
Total Bases
1972
465
Walks
527
1282
Strikeouts
1340
.322
On Base Percentage
.312
.415
Slugging Percentage
.409
.738
OBP Pct + SLG Pct
.721
146
Games Played
146
146
Games Started
146
71
Hit By Pitch
37
0.0
Wins Above Replacement
0.0
0.0
Offensive Wins Above Replacement
0.0
37
Caught Stealing
47
1
Is Qualified
1
677.1
Runs Created
632.5
4.7
Runs Created Per 27 Outs
4.4
.084
Walks Per Plate Appearance
.097
0.36
Walk To Strikeout Ratio
0.39
.163
Isolated Power
.175
.269
Secondary Average
.303
3.76
Pitches Per Plate Appearance
3.98
453
Extra Base Hits
427
5566
Plate Appearances
5439
30.6
At Bats Per Home Run
24.2
19
Sacrifice Hit
9
48
Sacrifice Flies
38
Pitching
146
Team Games Played
146
23
Quality Starts
58
55
Wins
84
91
Losses
62
32
Saves
41
59
Holds
83
1467
Hits
1079
785
Earned runs
464
198
Home Runs
147
482
Walks
439
999
Strikeouts
1313
7.0
Strikeouts Per 9 Innings
9.1
149.1
Pitches Per Start
144.8
1.52
Walks Plus Hits Per Inning Pitched
1.16
5.51
Earned Run Average
3.20
91
Losses
62
1282.2
Innings pitched
1305.0
.377
Win Percentage
.575
55
Save Opportunities
68
.287
Opponent Batting Average
.223
.351
Opponent's On-base pct.
.292
.485
Opponent's Slugging pct.
.364
.836
Opponent's OPB Pct + SLG Pct
.657
5107
At Bats
4849
325
Doubles
203
45
Triples
22
55
Batters Hit
54
119
Stolen Bases
66
146
Games Played
146
1
Complete Games
0
1
Shutouts
13
41
Wild Pitches
32
804
Runs Batted In
511
5
Balks
3
1282.2
Innings pitched
1305.0
7.0
Strikeouts Per 9 Innings
9.1
25
Caught Stealing
19
146
Games Started
146
0.0
Wins Above Replacement
0.0
1
Is Qualified
1
840
Runs
536
785
Earned Runs
464
2476
Total Bases
1767
Fielding
146
Team Games Played
146
1283
Full Innings
1305
5166
Total Chances
5259
3848
Putouts
3915
1224
Assists
1259
94
Errors
85
259
Double Plays
211
0.982
Fielding Percentage
0.984
35.6
Range Factor
35.7
0.0
Zone Rating
0.0
146
Games Played
146
0
Games Started
0
0.0
Defensive Wins Above Replacement
0.0
1
Qualified
1