

Royals vs Angels Live Score (15 Aug, 2026)
Game Information
Stage
Standard
Season
2026
First Pitch
Fri, Aug 14, 9:38 pm
Venue
Angel Stadium
Location
Anaheim, California
Attendance
23,139
Home Runs
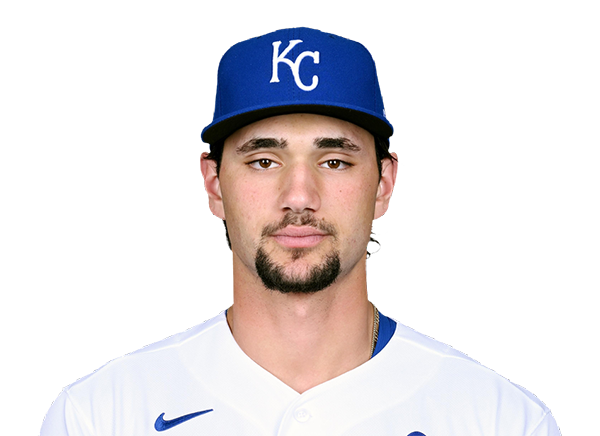
Jac Caglianone
21 HR
.268 AVG
53 RBI
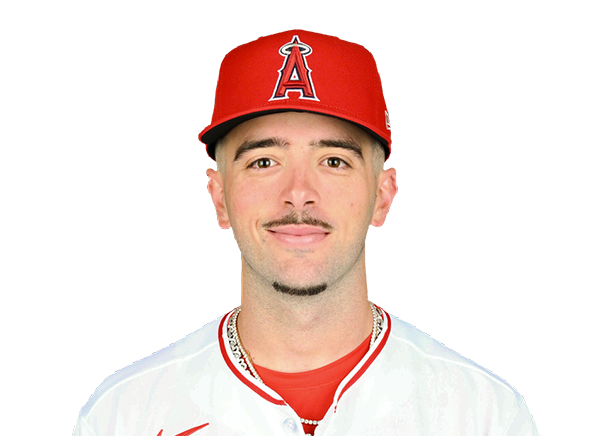
Mike Trout
20 HR
.245 AVG
45 RBI

Batting Average
Bobby Witt Jr.
.285 AVG
.355 OBP
.448 SLG

Nolan Schanuel
.271 AVG
.350 OBP
.383 SLG

Runs Batted In
Carter Jensen
55 RBI
16 HR
.222 AVG

Zach Neto
52 RBI
20 HR
.224 AVG
Earned Run Average
Michael Wacha
3.46 ERA
5 W
117 K

Reid Detmers
4.00 ERA
3 W
156 K

Wins
Noah Cameron
6 W
4.45 ERA
118 K

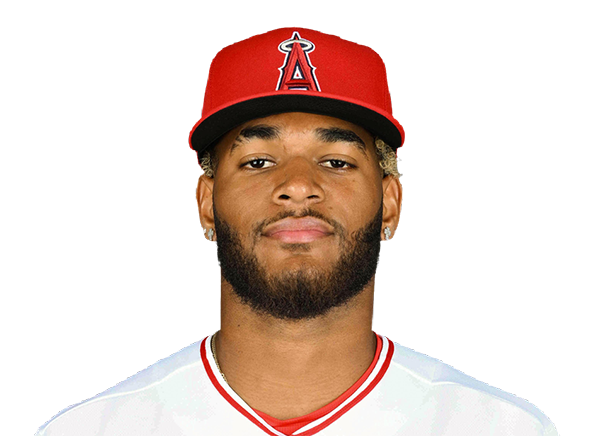
Walbert Urena
8 W
2.67 ERA
102 K
Strikeouts
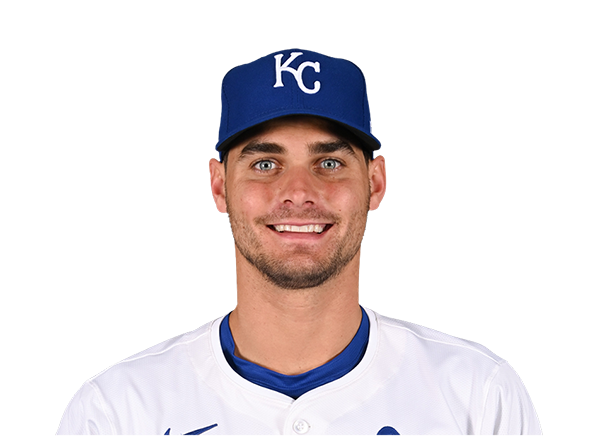
Noah Cameron
118 K
6 W
4.45 ERA
Reid Detmers
156 K
3 W
4.00 ERA
Injury Report

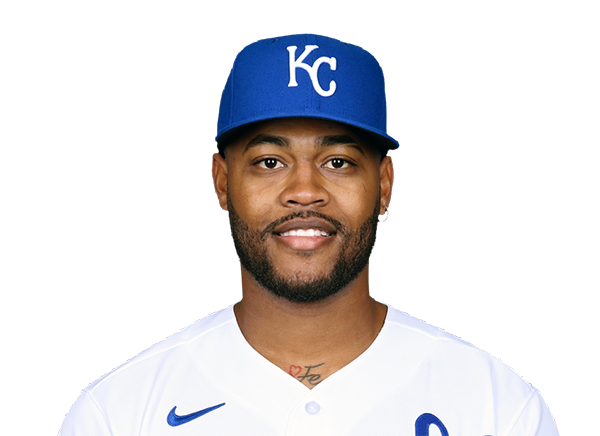


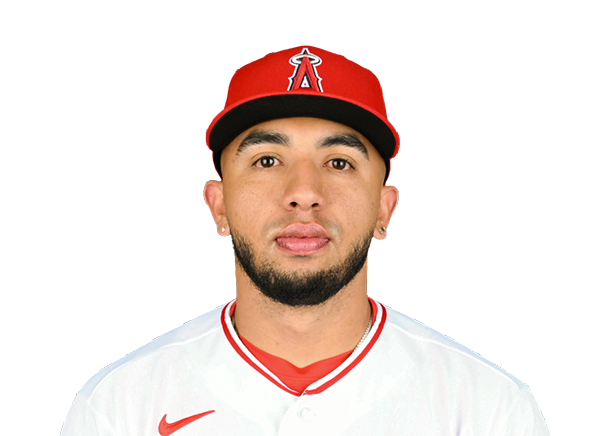
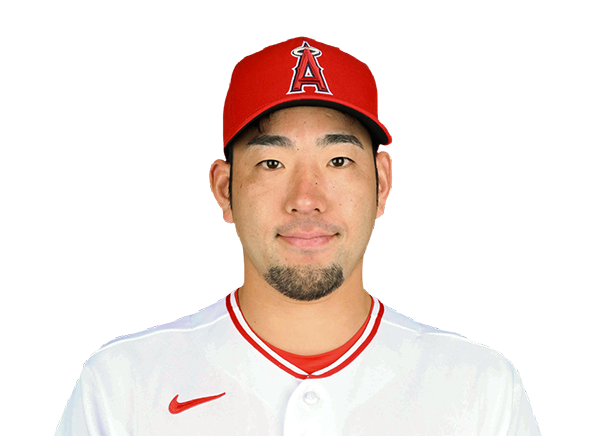

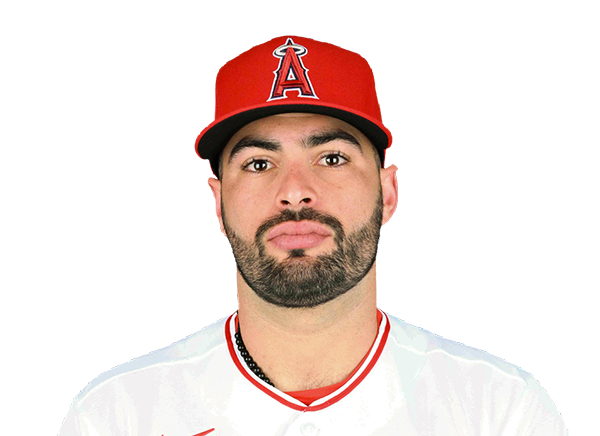

Team Stats
 KC
LAA


Array
Runs
Array
10
Hits
10
0
Errors
1
—
Home Runs
—
—
Walks
—
—
Strikeouts
—
Standings
American League
| Team | W | L | PCT | GB | DIFF | STRK |
|---|---|---|---|---|---|---|
1 Rays | 76 | 52 | .594 | - | +43 | L2 |
2 White Sox | 67 | 61 | .523 | 9 | +47 | W1 |
3 Astros | 65 | 64 | .504 | 11.5 | -42 | W1 |
4 Yankees | 73 | 56 | .566 | 3.5 | +95 | L1 |
5 Red Sox | 69 | 59 | .539 | 7 | +97 | W1 |
6 Rangers | 64 | 65 | .496 | 12.5 | -45 | W2 |
7 Blue Jays | 64 | 67 | .489 | 13.5 | -50 | W1 |
8 Twins | 63 | 66 | .488 | 13.5 | -45 | L1 |
9 Guardians | 63 | 66 | .488 | 13.5 | -15 | W2 |
10 Orioles | 62 | 67 | .481 | 14.5 | -34 | W1 |
11 Tigers | 61 | 67 | .477 | 15 | +79 | L3 |
12 Mariners | 61 | 68 | .473 | 15.5 | -45 | W1 |
| 13Royals | 56 | 74 | .431 | 21 | -97 | W6 |
| 14Angels | 51 | 78 | .395 | 25.5 | -71 | L1 |
15 Athletics | 49 | 80 | .380 | 27.5 | -189 | L5 |
National League
| Team | W | L | PCT | GB | DIFF | STRK |
|---|---|---|---|---|---|---|
1 Brewers | 81 | 49 | .623 | - | +163 | W3 |
2 Dodgers | 78 | 51 | .605 | 2.5 | +146 | W4 |
3 Braves | 75 | 55 | .577 | 6 | +108 | L2 |
4 Cubs | 74 | 55 | .574 | 6.5 | +99 | L2 |
5 Phillies | 71 | 58 | .550 | 9.5 | +16 | W7 |
6 Padres | 69 | 60 | .535 | 11.5 | +7 | W1 |
7 Diamondbacks | 68 | 61 | .527 | 12.5 | +13 | W2 |
8 Cardinals | 66 | 64 | .508 | 15 | +9 | L1 |
9 Marlins | 65 | 64 | .504 | 15.5 | +15 | W1 |
10 Pirates | 63 | 67 | .485 | 18 | +30 | L1 |
11 Reds | 61 | 68 | .473 | 19.5 | -98 | L2 |
12 Nationals | 61 | 69 | .469 | 20 | +16 | L2 |
13 Mets | 58 | 71 | .450 | 22.5 | -44 | L1 |
14 Giants | 52 | 76 | .406 | 28 | -78 | L2 |
15 Rockies | 50 | 78 | .391 | 30 | -130 | L4 |
KC
VS
LAA
Pitchers
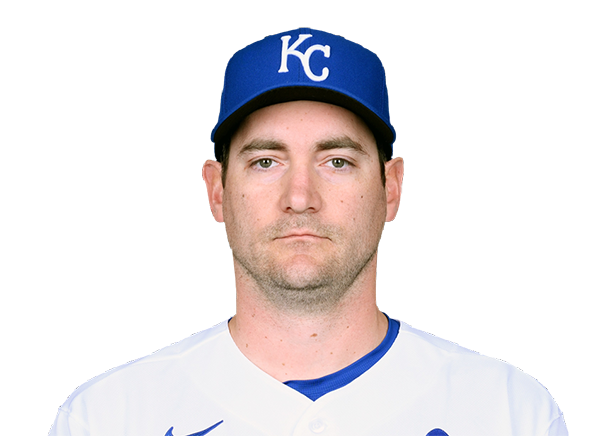
Seth Lugo
Catchers
Carter Jensen
Infielders
Bobby Witt Jr.
Jac Caglianone

Nick Loftin

Michael Massey
Outfielders
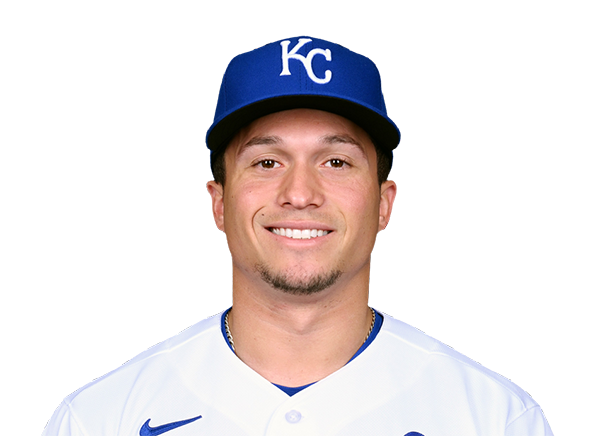
Isaac Collins

John Rave

Kyle Isbel
Designated Hitters
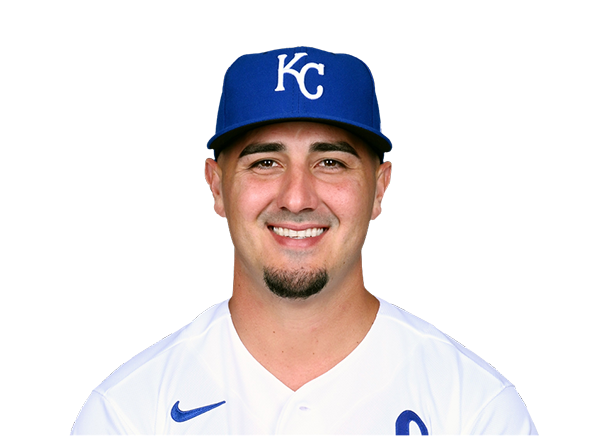
Josh Rojas
Pitchers
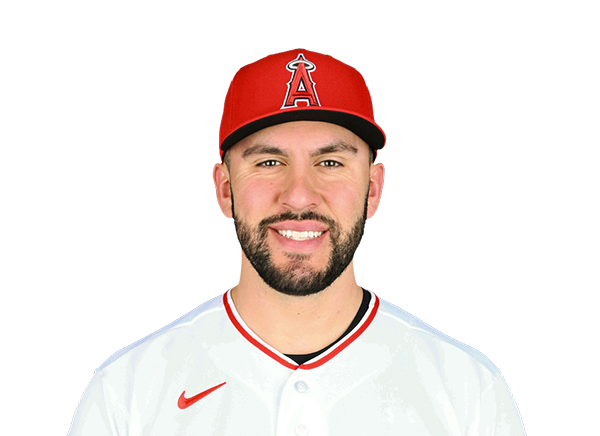
Grayson Rodriguez
Catchers

Tyler Heineman
Infielders
Nolan Schanuel
Zach Neto
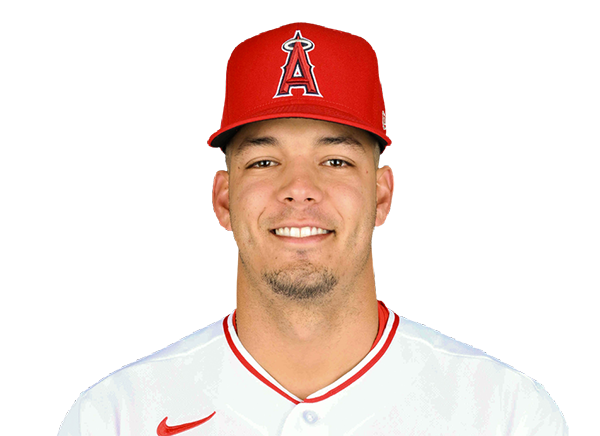
Vaughn Grissom
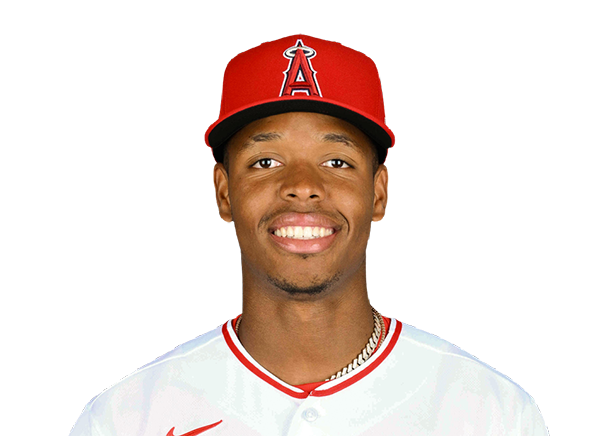
Denzer Guzman
Outfielders
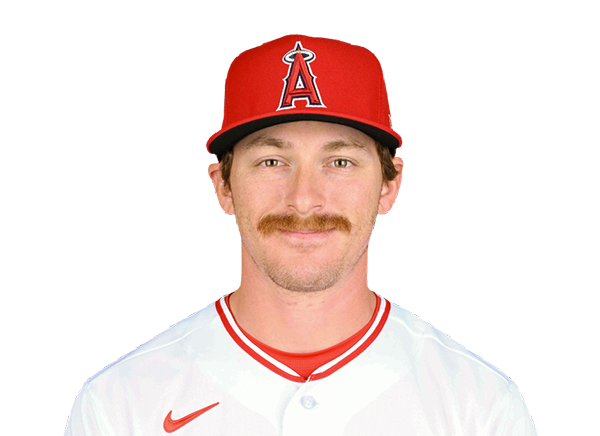
Wade Meckler
Mike Trout

Josh Lowe
Designated Hitters
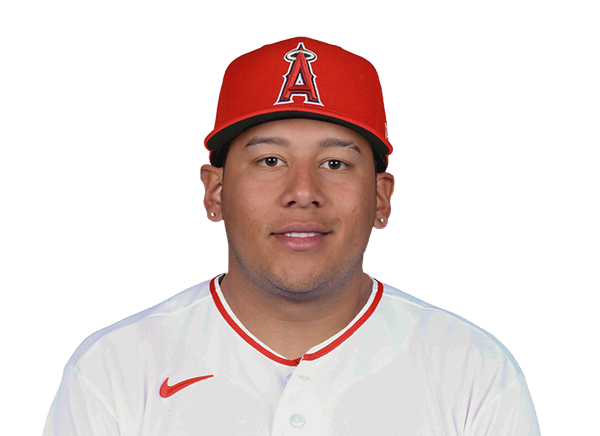
Moises Ballesteros
Royals
VS
Angels
Batting
123
Team Games Played
123
4122
At Bats
4114
1005
Hits
974
486
Runs Batted In
487
124
Home Runs
125
95
Stolen Bases
64
.244
Batting Average
.237
510
Runs
506
220
Doubles
182
16
Triples
11
1629
Total Bases
1553
379
Walks
388
973
Strikeouts
1163
.311
On Base Percentage
.311
.395
Slugging Percentage
.377
.706
OBP Pct + SLG Pct
.689
123
Games Played
123
123
Games Started
123
43
Hit By Pitch
69
0.0
Wins Above Replacement
0.0
0.0
Offensive Wins Above Replacement
0.0
26
Caught Stealing
18
1
Is Qualified
1
520.6
Runs Created
486.8
4.3
Runs Created Per 27 Outs
4.0
.082
Walks Per Plate Appearance
.084
0.39
Walk To Strikeout Ratio
0.33
.151
Isolated Power
.141
.260
Secondary Average
.246
3.81
Pitches Per Plate Appearance
3.89
360
Extra Base Hits
318
4605
Plate Appearances
4614
33.2
At Bats Per Home Run
32.9
21
Sacrifice Hit
17
40
Sacrifice Flies
24
Pitching
123
Team Games Played
123
51
Quality Starts
36
50
Wins
48
73
Losses
75
30
Saves
18
56
Holds
67
1082
Hits
961
582
Earned runs
536
157
Home Runs
133
457
Walks
518
910
Strikeouts
1101
7.6
Strikeouts Per 9 Innings
9.1
147.9
Pitches Per Start
154.0
1.42
Walks Plus Hits Per Inning Pitched
1.37
4.85
Earned Run Average
4.45
73
Losses
75
1080.1
Innings pitched
1083.1
.407
Win Percentage
.390
53
Save Opportunities
39
.261
Opponent Batting Average
.235
.340
Opponent's On-base pct.
.328
.440
Opponent's Slugging pct.
.383
.780
Opponent's OPB Pct + SLG Pct
.711
4138
At Bats
4086
229
Doubles
173
20
Triples
16
47
Batters Hit
64
62
Stolen Bases
87
123
Games Played
123
1
Complete Games
0
6
Shutouts
9
44
Wild Pitches
50
593
Runs Batted In
561
2
Balks
2
1080.1
Innings pitched
1083.1
7.6
Strikeouts Per 9 Innings
9.1
31
Caught Stealing
23
123
Games Started
123
0.0
Wins Above Replacement
0.0
1
Is Qualified
1
623
Runs
590
582
Earned Runs
536
1822
Total Bases
1565
Fielding
123
Team Games Played
123
1080
Full Innings
1083
4411
Total Chances
4335
3241
Putouts
3250
1114
Assists
1012
56
Errors
73
220
Double Plays
182
0.987
Fielding Percentage
0.983
36.3
Range Factor
35.4
0.0
Zone Rating
0.0
123
Games Played
123
0
Games Started
0
0.0
Defensive Wins Above Replacement
0.0
1
Qualified
1