

Royals vs Astros Live Score (17 Sep, 2026)
Game Information
Stage
STD
Season
2026
First Pitch
Wed, Sep 16, 8:10 pm
Venue
Daikin Park
Location
Houston, Texas
Venue Type
Indoor
Broadcast
MLB.TV
Attendance
28,497
Live Situation
2Balls
3Strikes
0Outs
—Pitcher
—At Bat
Pitch Sequence
1
BALL
Four-seam FB
97 MPH
2
STRIKE SWINGING
Four-seam FB
98 MPH
3
STRIKE FOUL
Cutter
95 MPH
4
BALL
Four-seam FB
99 MPH
5
STRIKE SWINGING
Four-seam FB
98 MPH
Injury Report


Team Stats
 KC
HOU


5
Runs
2
8
Hits
8
0
Errors
1
2
Home Runs
1
7
Walks
2
6
Strikeouts
7
Player Box Score
Kansas City Royals
| Player | H-AB | AB | R | H | RBI | HR | BB | K | #P | AVG | OBP | SLG |
|---|---|---|---|---|---|---|---|---|---|---|---|---|
 Carter Jensen | 1-4 | 4 | 0 | 1 | 1 | 0 | 1 | 0 | 16 | .232 | .319 | .453 |
 Bobby Witt Jr. | 0-3 | 3 | 0 | 0 | 0 | 0 | 2 | 1 | 12 | .278 | .359 | .444 |
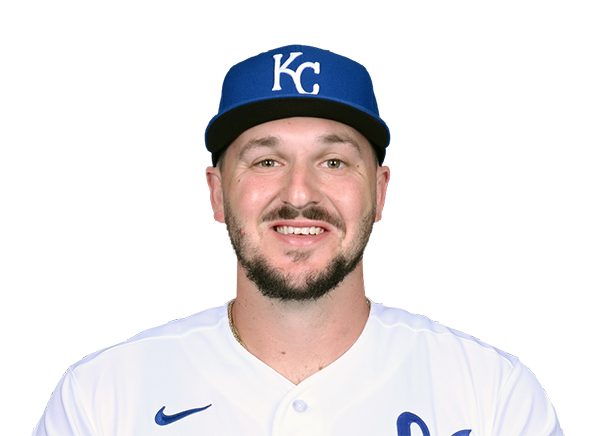 Vinnie Pasquantino | 0-4 | 4 | 0 | 0 | 0 | 0 | 1 | 0 | 19 | .237 | .325 | .387 |
 Salvador Perez | 0-5 | 5 | 0 | 0 | 0 | 0 | 0 | 1 | 14 | .229 | .273 | .378 |
 Michael Massey | 3-5 | 5 | 2 | 3 | 1 | 1 | 0 | 1 | 15 | .282 | .316 | .443 |
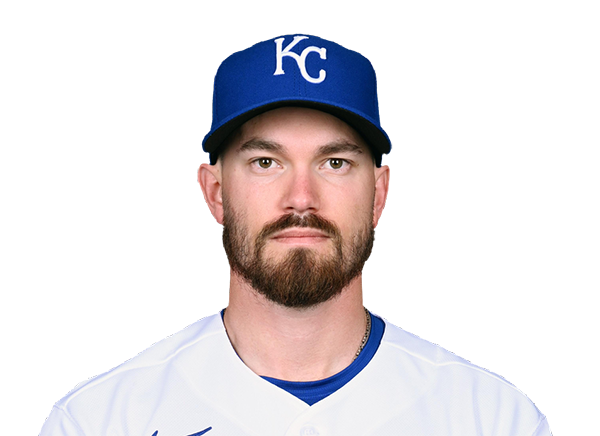 Nick Loftin | 1-2 | 2 | 0 | 1 | 0 | 0 | 1 | 0 | 12 | .231 | .318 | .374 |
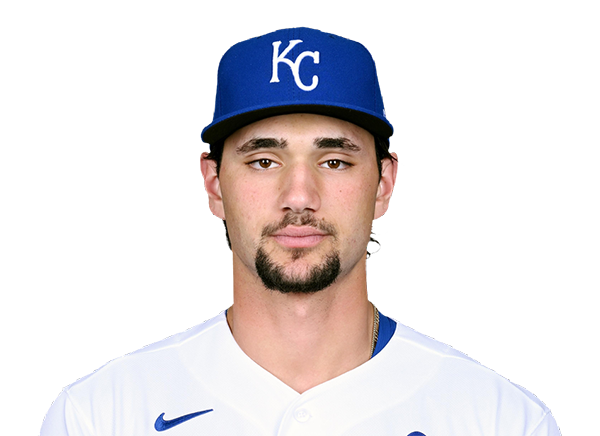 Jac Caglianone | 0-1 | 1 | 0 | 0 | 0 | 0 | 0 | 1 | 5 | .278 | .328 | .485 |
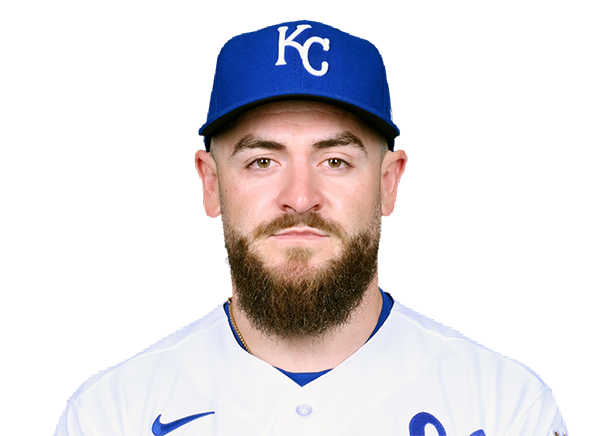 Kyle Isbel | 0-1 | 1 | 0 | 0 | 0 | 0 | 0 | 0 | 2 | .221 | .268 | .328 |
 John Rave | 1-4 | 4 | 1 | 1 | 2 | 1 | 0 | 1 | 19 | .219 | .310 | .447 |
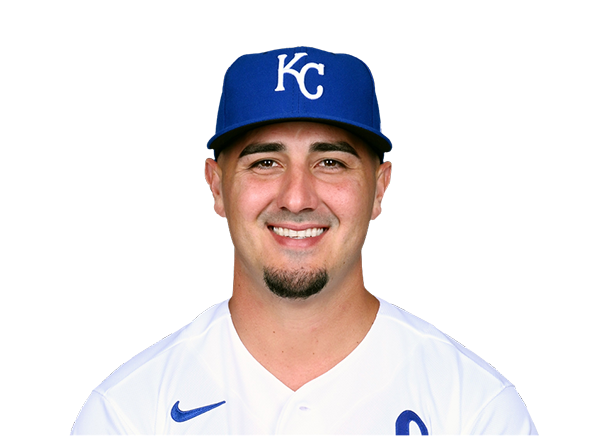 Josh Rojas | 1-3 | 3 | 1 | 1 | 0 | 0 | 1 | 0 | 17 | .240 | .283 | .340 |
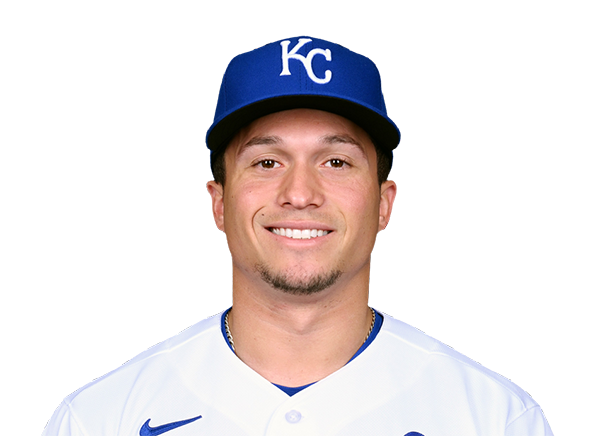 Isaac Collins | 1-3 | 3 | 1 | 1 | 0 | 0 | 1 | 1 | 18 | .221 | .327 | .335 |
Houston Astros
| Player | H-AB | AB | R | H | RBI | HR | BB | K | #P | AVG | OBP | SLG |
|---|---|---|---|---|---|---|---|---|---|---|---|---|
 Jeremy Pena | 3-4 | 4 | 0 | 3 | 0 | 0 | 0 | 0 | 17 | .277 | .329 | .470 |
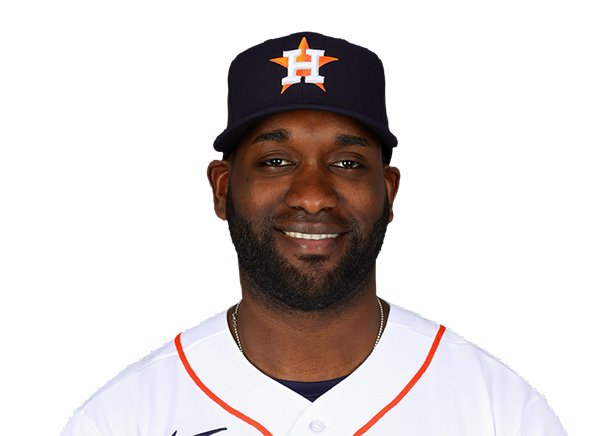 Yordan Alvarez | 1-4 | 4 | 0 | 1 | 0 | 0 | 0 | 1 | 11 | .310 | .428 | .594 |
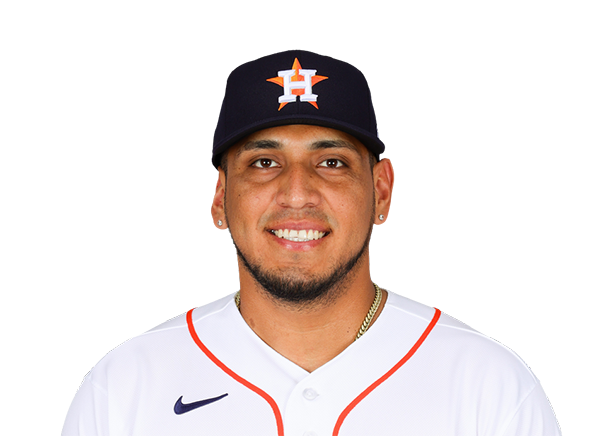 Isaac Paredes | 0-3 | 3 | 0 | 0 | 1 | 0 | 0 | 1 | 15 | .257 | .354 | .430 |
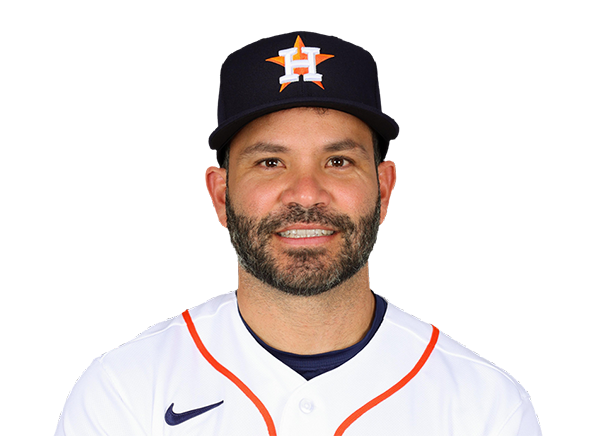 Jose Altuve | 1-4 | 4 | 0 | 1 | 0 | 0 | 0 | 0 | 15 | .243 | .303 | .392 |
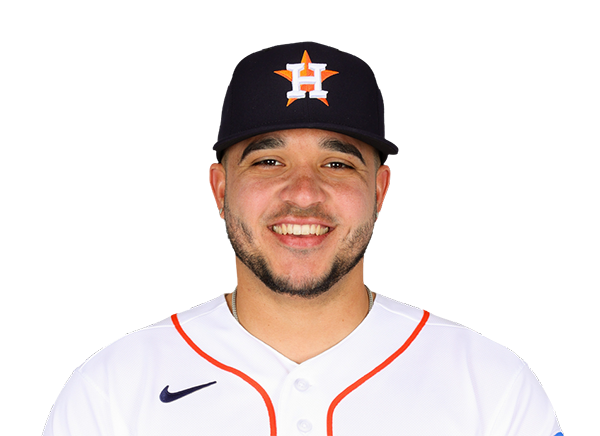 Yainer Diaz | 2-4 | 4 | 1 | 2 | 1 | 1 | 0 | 0 | 9 | .277 | .309 | .439 |
 Christian Walker | 0-4 | 4 | 0 | 0 | 0 | 0 | 0 | 2 | 15 | .222 | .295 | .412 |
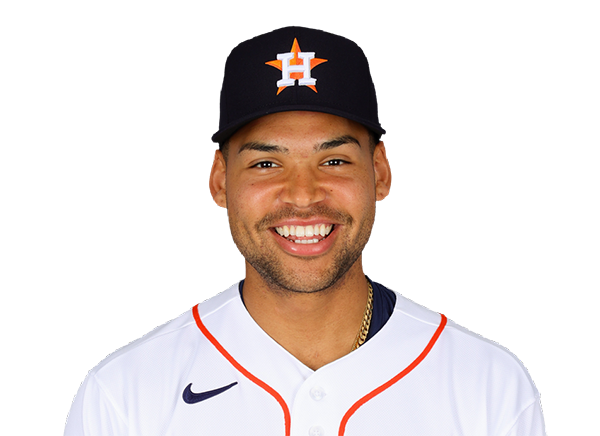 Cam Smith | 0-2 | 2 | 0 | 0 | 0 | 0 | 0 | 0 | 15 | .213 | .278 | .397 |
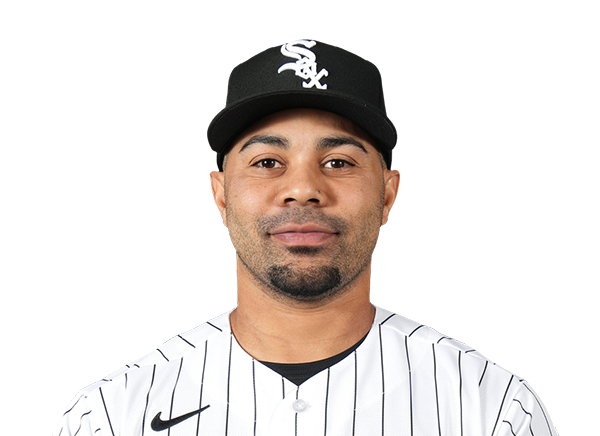 LaMonte Wade Jr. | 0-0 | 0 | 0 | 0 | 0 | 0 | 0 | 0 | 0 | .202 | .311 | .325 |
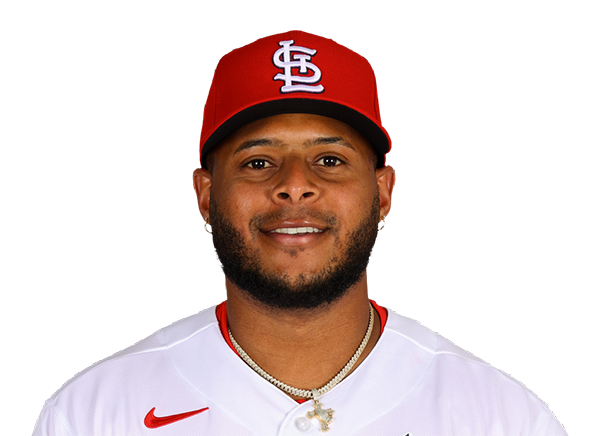 Nelson Velazquez | 0-1 | 1 | 0 | 0 | 0 | 0 | 0 | 1 | 3 | .196 | .259 | .423 |
 Joey Loperfido | 0-1 | 1 | 0 | 0 | 0 | 0 | 0 | 1 | 3 | .214 | .311 | .330 |
 Daulton Varsho | 1-4 | 4 | 0 | 1 | 0 | 0 | 0 | 0 | 11 | .224 | .285 | .355 |
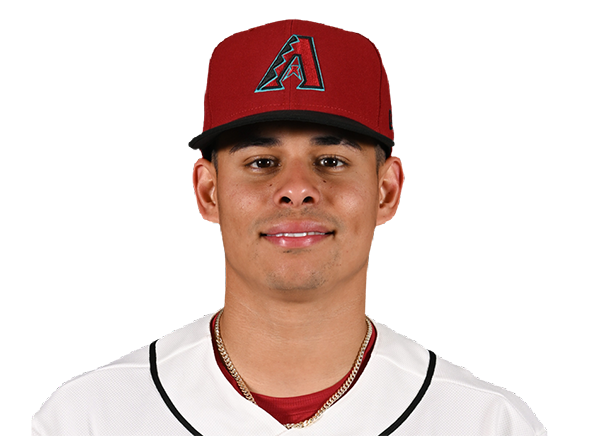 Jorge Barrosa | 0-2 | 2 | 1 | 0 | 0 | 0 | 2 | 1 | 22 | .199 | .288 | .340 |
Kansas City Royals
| Player | IP | H | R | ER | BB | K | HR | PC-ST | ERA | PC |
|---|---|---|---|---|---|---|---|---|---|---|
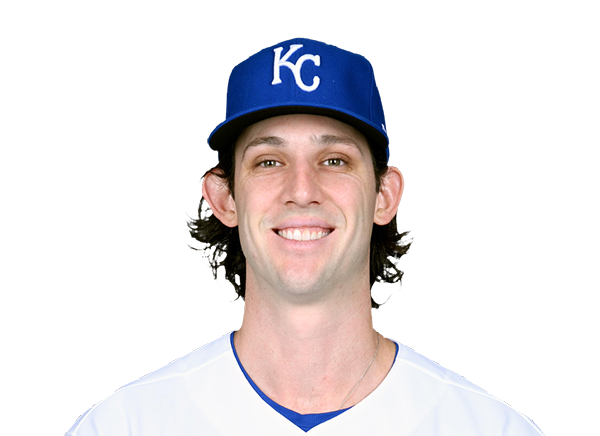 Daniel Lynch IV | 5.0 | 2 | 0 | 0 | 1 | 3 | 0 | 72-49 | 3.29 | 72 |
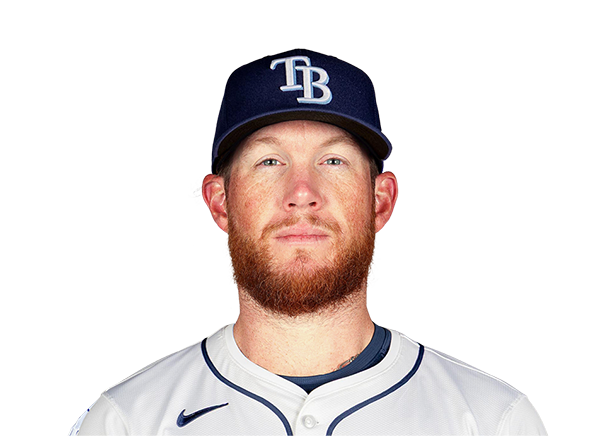 Craig Kimbrel | 1.0 | 1 | 0 | 0 | 0 | 0 | 0 | 17-10 | 4.50 | 17 |
 Nolan Hoffman | 0.1 | 2 | 0 | 0 | 0 | 0 | 0 | 6-6 | 4.35 | 6 |
 Anthony Gose | 0.2 | 0 | 0 | 0 | 0 | 1 | 0 | 5-4 | 0.00 | 5 |
 Nate Pearson | 1.0 | 1 | 1 | 1 | 1 | 0 | 0 | 16-9 | 2.51 | 16 |
 Steven Cruz | 1.0 | 2 | 1 | 1 | 0 | 3 | 1 | 20-15 | 4.13 | 20 |
Houston Astros
| Player | IP | H | R | ER | BB | K | HR | PC-ST | ERA | PC |
|---|---|---|---|---|---|---|---|---|---|---|
 Cristian Javier | 5.1 | 5 | 2 | 2 | 3 | 2 | 1 | 85-53 | 5.31 | 85 |
 Bryan King | 1.1 | 1 | 0 | 0 | 1 | 1 | 0 | 18-14 | 4.89 | 18 |
 Enyel De Los Santos | 1.1 | 2 | 3 | 2 | 2 | 2 | 1 | 28-15 | 4.67 | 28 |
 Tatsuya Imai | 1.0 | 0 | 0 | 0 | 1 | 1 | 0 | 18-11 | 5.13 | 18 |
H2H / Season Series
HOU2–5
KC
HOU4–2
KC
KC4–0
HOU
KC7–8
HOU
KC8–10
HOU
Last 5 Games
| Date | Opponent | Result |
|---|---|---|
| Sep 16 | @ HOU | W5–2 |
| Sep 15 | @ HOU | L2–4 |
| Sep 13 |  @ BOS | L1–4 |
| Sep 12 | @ BOS | L1–5 |
| Sep 11 | @ BOS | W3–2 |
| Date | Opponent | Result |
|---|---|---|
| Sep 16 | vs KC | L2–5 |
| Sep 15 | vs KC | W4–2 |
| Sep 13 |  @ TB | L4–14 |
| Sep 12 | @ TB | L2–3 |
| Sep 11 | @ TB | L1–3 |
Standings
American League
| Team | W | L | PCT | GB | DIFF | STRK |
|---|---|---|---|---|---|---|
| 1Rays | 92 | 59 | .609 | - | +71 | W5 |
2 Guardians | 78 | 75 | .510 | 15 | -7 | W2 |
| 3Astros | 76 | 76 | .500 | 16.5 | -54 | L1 |
4 Yankees | 88 | 64 | .579 | 4.5 | +136 | L1 |
| 5Red Sox | 82 | 70 | .539 | 10.5 | +82 | L2 |
6 White Sox | 77 | 75 | .507 | 15.5 | +34 | L2 |
7 Rangers | 76 | 76 | .500 | 16.5 | -38 | W4 |
8 Blue Jays | 76 | 77 | .497 | 17 | -37 | W1 |
9 Orioles | 75 | 78 | .490 | 18 | -26 | W3 |
10 Tigers | 72 | 80 | .474 | 20.5 | +76 | L1 |
11 Twins | 71 | 81 | .467 | 21.5 | -73 | W1 |
12 Mariners | 71 | 82 | .464 | 22 | -56 | W1 |
| 13Royals | 67 | 85 | .441 | 25.5 | -93 | W1 |
14 Athletics | 61 | 91 | .401 | 31.5 | -205 | L2 |
15 Angels | 58 | 94 | .382 | 34.5 | -78 | L1 |
National League
| Team | W | L | PCT | GB | DIFF | STRK |
|---|---|---|---|---|---|---|
1 Brewers | 95 | 57 | .625 | - | +200 | W2 |
2 Dodgers | 92 | 60 | .605 | 3 | +173 | L1 |
3 Braves | 89 | 64 | .582 | 6.5 | +111 | L1 |
4 Cubs | 85 | 68 | .556 | 10.5 | +143 | W1 |
5 Phillies | 84 | 68 | .553 | 11 | +31 | W1 |
6 Padres | 83 | 69 | .546 | 12 | +23 | W1 |
7 Diamondbacks | 80 | 73 | .523 | 15.5 | 0 | L2 |
8 Marlins | 76 | 77 | .497 | 19.5 | +8 | W2 |
9 Pirates | 75 | 77 | .493 | 20 | +21 | L2 |
10 Cardinals | 75 | 78 | .490 | 20.5 | -14 | L2 |
11 Reds | 71 | 81 | .467 | 24 | -148 | W1 |
12 Nationals | 71 | 82 | .464 | 24.5 | +3 | L1 |
13 Mets | 69 | 83 | .454 | 26 | -43 | L4 |
14 Giants | 64 | 89 | .418 | 31.5 | -70 | W2 |
15 Rockies | 56 | 96 | .368 | 39 | -170 | L1 |
KC
VS
HOU
Pitchers
Daniel Lynch IV
Catchers
Carter Jensen
Infielders
Bobby Witt Jr.
Vinnie Pasquantino
Michael Massey
Josh Rojas
Outfielders
Nick Loftin
John Rave
Isaac Collins
Designated Hitters
Salvador Perez
Pitchers
Cristian Javier
Catchers
Yainer Diaz
Infielders
Jeremy Pena
Isaac Paredes
Jose Altuve
Christian Walker
Outfielders
Cam Smith
Daulton Varsho
Jorge Barrosa
Designated Hitters
Yordan Alvarez
Royals
VS
Astros
Batting
152
Team Games Played
152
5095
At Bats
5100
1248
Hits
1221
610
Runs Batted In
644
158
Home Runs
201
123
Stolen Bases
45
.245
Batting Average
.239
641
Runs
675
272
Doubles
224
19
Triples
18
2032
Total Bases
2084
490
Walks
495
1192
Strikeouts
1245
.315
On Base Percentage
.313
.399
Slugging Percentage
.409
.714
OBP Pct + SLG Pct
.722
152
Games Played
152
152
Games Started
152
53
Hit By Pitch
71
0.0
Wins Above Replacement
0.0
0.0
Offensive Wins Above Replacement
0.0
32
Caught Stealing
20
1
Is Qualified
1
658.0
Runs Created
656.2
4.4
Runs Created Per 27 Outs
4.4
.086
Walks Per Plate Appearance
.086
0.41
Walk To Strikeout Ratio
0.40
.154
Isolated Power
.169
.268
Secondary Average
.271
3.80
Pitches Per Plate Appearance
3.88
449
Extra Base Hits
443
5709
Plate Appearances
5723
32.2
At Bats Per Home Run
25.4
25
Sacrifice Hit
18
44
Sacrifice Flies
37
Pitching
152
Team Games Played
152
61
Quality Starts
43
67
Wins
76
85
Losses
76
36
Saves
48
79
Holds
83
1315
Hits
1202
686
Earned runs
678
185
Home Runs
195
539
Walks
614
1100
Strikeouts
1325
7.4
Strikeouts Per 9 Innings
8.8
146.6
Pitches Per Start
151.6
1.39
Walks Plus Hits Per Inning Pitched
1.35
4.61
Earned Run Average
4.53
85
Losses
76
1338.1
Innings pitched
1347.2
.441
Win Percentage
.500
60
Save Opportunities
59
.258
Opponent Batting Average
.238
.334
Opponent's On-base pct.
.329
.428
Opponent's Slugging pct.
.404
.762
Opponent's OPB Pct + SLG Pct
.733
5101
At Bats
5049
271
Doubles
205
22
Triples
23
62
Batters Hit
87
69
Stolen Bases
123
152
Games Played
152
2
Complete Games
0
8
Shutouts
9
50
Wild Pitches
50
701
Runs Batted In
696
3
Balks
6
1338.1
Innings pitched
1347.2
7.4
Strikeouts Per 9 Innings
8.8
34
Caught Stealing
39
152
Games Started
152
0.0
Wins Above Replacement
0.0
1
Is Qualified
1
734
Runs
729
686
Earned Runs
678
2185
Total Bases
2038
Fielding
152
Team Games Played
152
1338
Full Innings
1348
5464
Total Chances
5231
4015
Putouts
4043
1382
Assists
1120
67
Errors
68
272
Double Plays
224
0.988
Fielding Percentage
0.987
36.3
Range Factor
34.5
0.0
Zone Rating
0.0
152
Games Played
152
0
Games Started
0
0.0
Defensive Wins Above Replacement
0.0
1
Qualified
1