

Royals vs Braves Live Score (29 Mar, 2026)
Game Information
Stage
Standard
Season
2026
First Pitch
Sun, Mar 29, 1:35 pm
Venue
Truist Park
Location
Atlanta, Georgia
Attendance
37,961
Live Situation
1Balls
1Strikes
0Outs
—Pitcher
—At Bat
Pitch Sequence
1
BALL
Slider
85 MPH
2
STRIKE FOUL
Slider
84 MPH
3
BALL IN PLAY
Four-seam FB
98 MPH
Injury Report
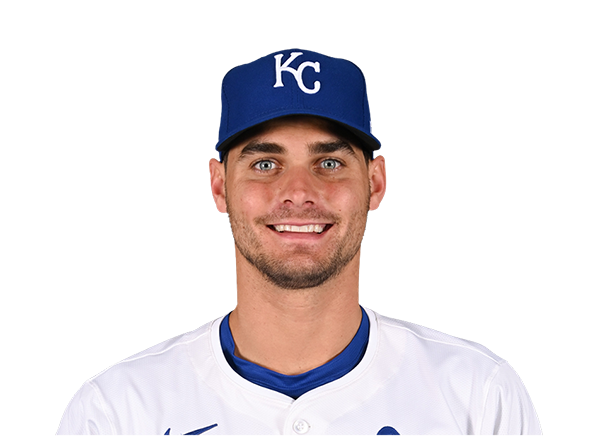
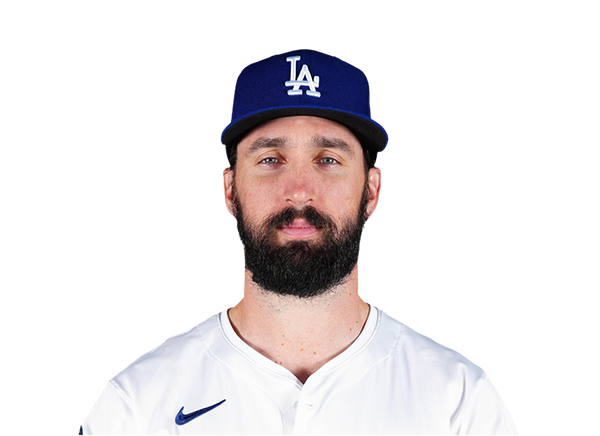
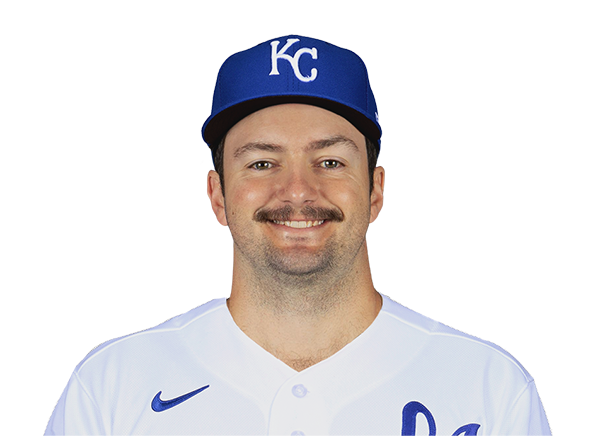
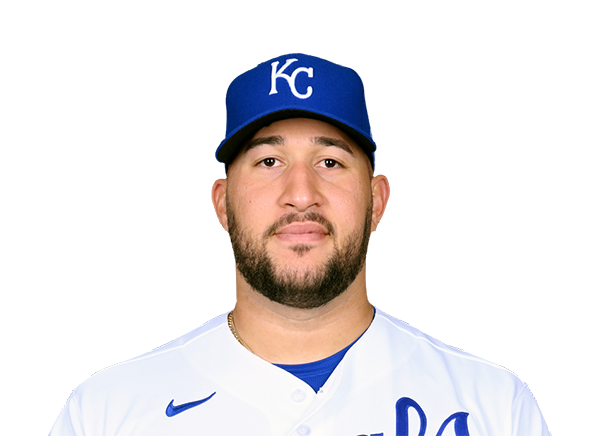

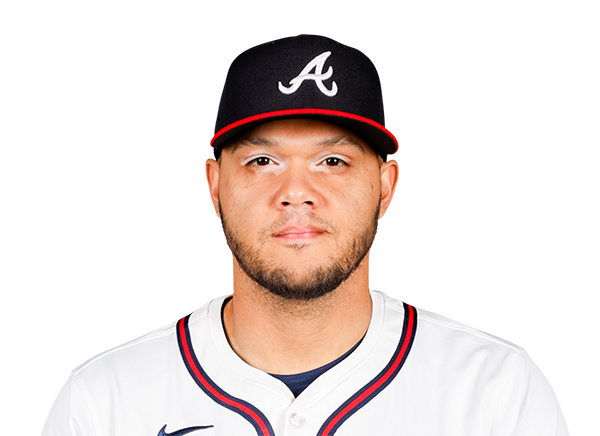
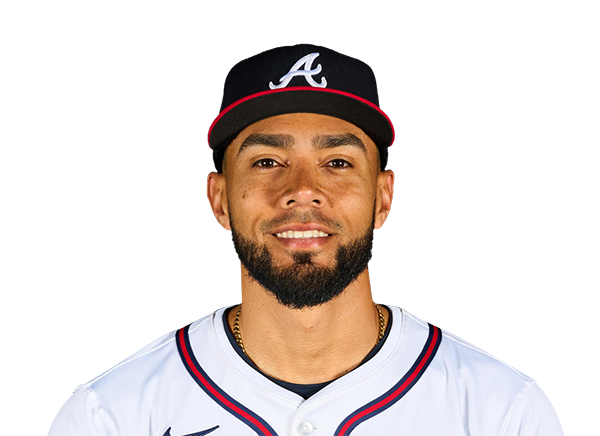
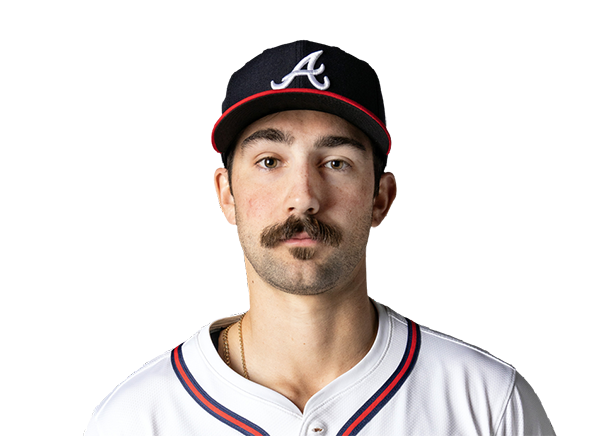
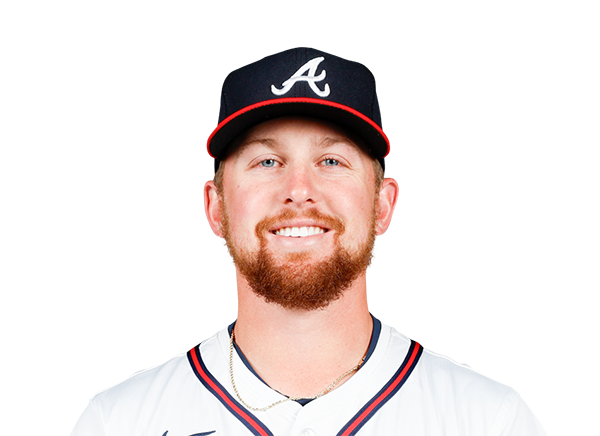
Team Stats
 KC
ATL


4
Runs
1
7
Hits
7
0
Errors
0
1
Home Runs
1
3
Walks
0
8
Strikeouts
5
Player Box Score
Kansas City Royals
| Player | H-AB | AB | R | H | RBI | HR | BB | K | #P | AVG | OBP | SLG |
|---|---|---|---|---|---|---|---|---|---|---|---|---|
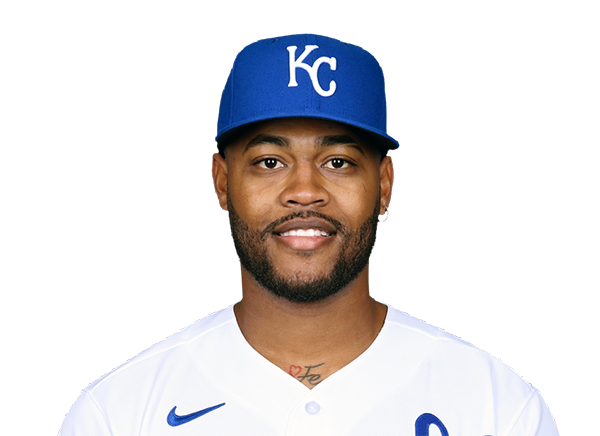 Maikel Garcia | 1-4 | 4 | 0 | 1 | 0 | 0 | 1 | 0 | 20 | .200 | .385 | .200 |
 Bobby Witt Jr. | 1-3 | 3 | 1 | 1 | 1 | 0 | 1 | 0 | 16 | .364 | .417 | .364 |
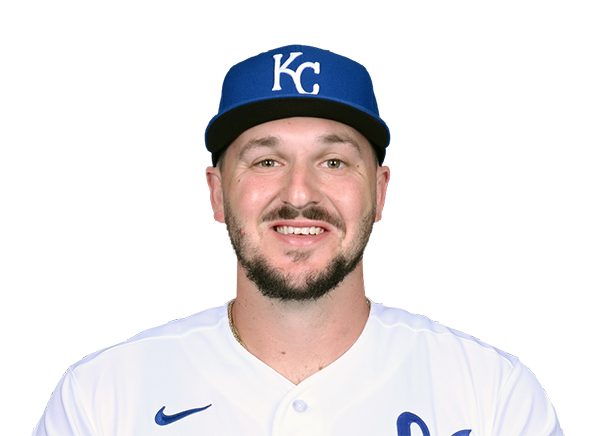 Vinnie Pasquantino | 2-4 | 4 | 0 | 2 | 1 | 0 | 0 | 0 | 12 | .182 | .250 | .182 |
 Salvador Perez | 0-4 | 4 | 0 | 0 | 0 | 0 | 0 | 1 | 10 | .167 | .167 | .417 |
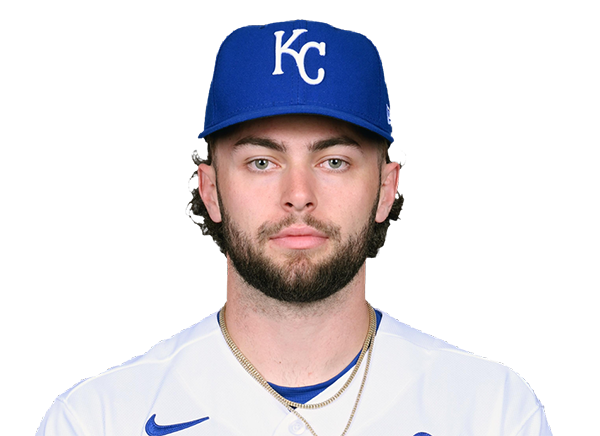 Carter Jensen | 1-3 | 3 | 1 | 1 | 2 | 1 | 0 | 2 | 25 | .125 | .200 | .500 |
 Lane Thomas | 0-4 | 4 | 0 | 0 | 0 | 0 | 0 | 2 | 16 | .125 | .222 | .125 |
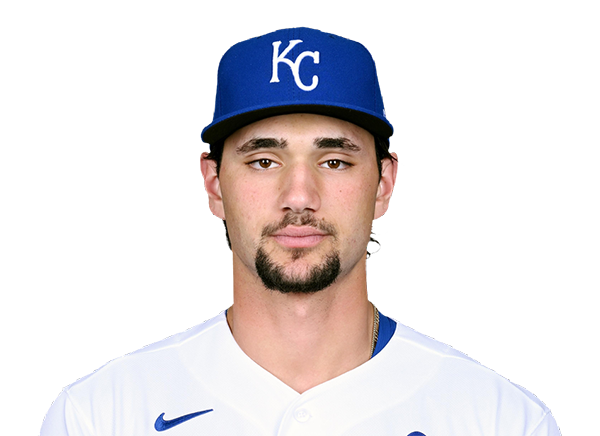 Jac Caglianone | 0-3 | 3 | 0 | 0 | 0 | 0 | 1 | 1 | 14 | .286 | .375 | .429 |
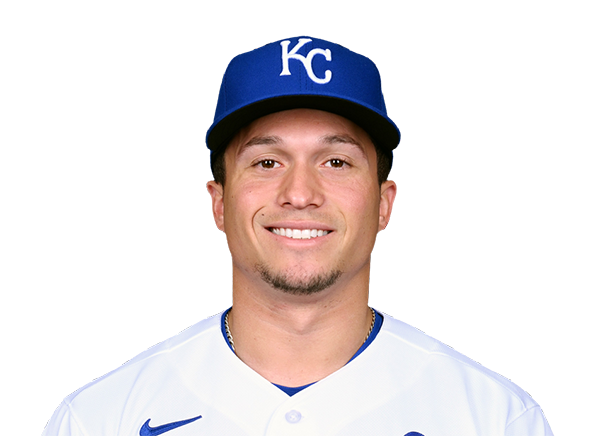 Isaac Collins | 0-0 | 0 | 0 | 0 | 0 | 0 | 0 | 0 | 0 | .000 | .143 | .000 |
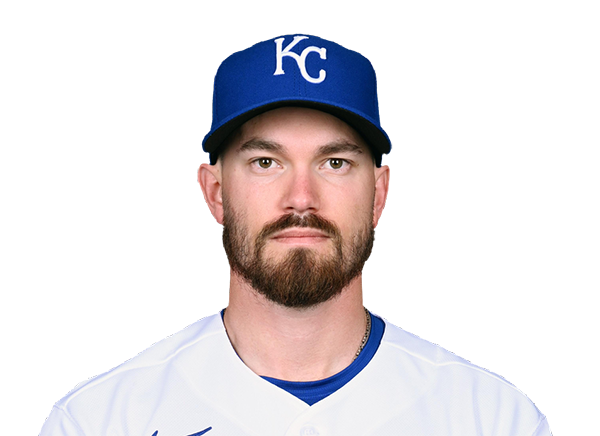 Nick Loftin | 1-4 | 4 | 2 | 1 | 0 | 0 | 0 | 0 | 7 | .250 | .250 | .500 |
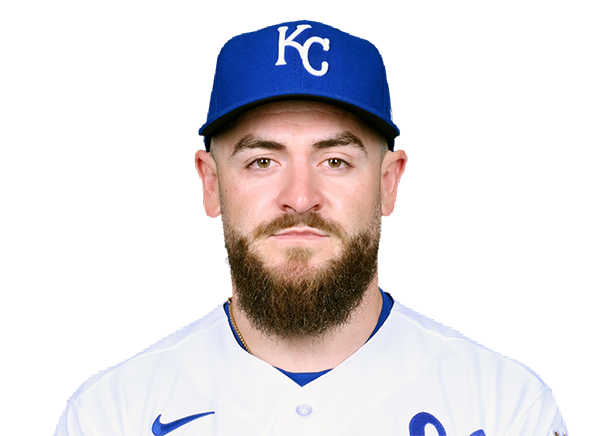 Kyle Isbel | 1-4 | 4 | 0 | 1 | 0 | 0 | 0 | 2 | 12 | .286 | .286 | .286 |
Atlanta Braves
| Player | H-AB | AB | R | H | RBI | HR | BB | K | #P | AVG | OBP | SLG |
|---|---|---|---|---|---|---|---|---|---|---|---|---|
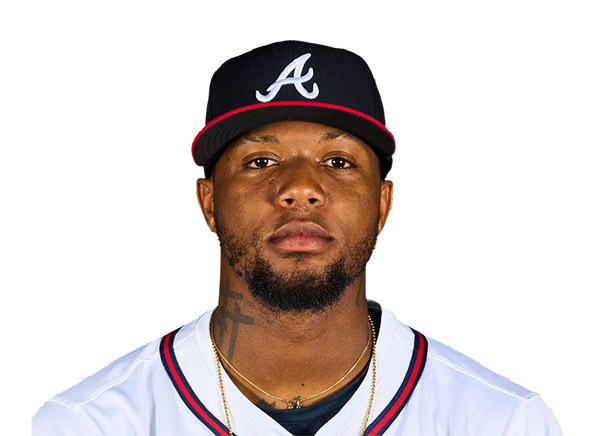 Ronald Acuna Jr. | 0-4 | 4 | 0 | 0 | 0 | 0 | 0 | 0 | 12 | .083 | .154 | .083 |
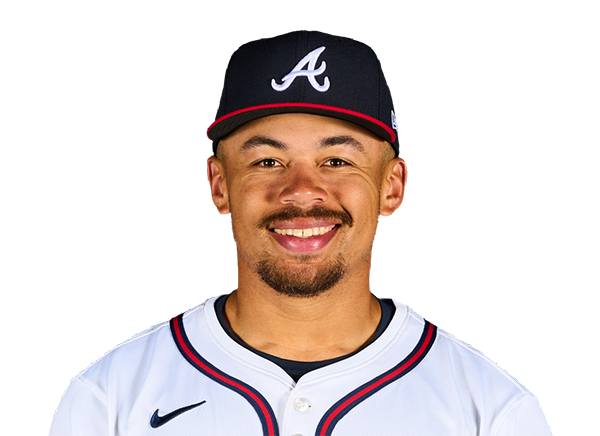 Drake Baldwin | 2-4 | 4 | 1 | 2 | 1 | 1 | 0 | 1 | 12 | .273 | .385 | .818 |
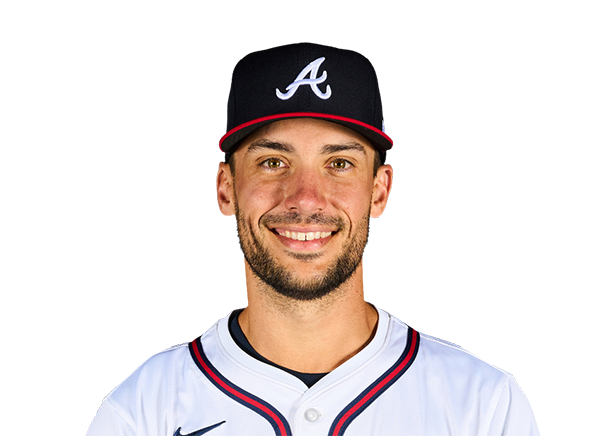 Matt Olson | 0-4 | 4 | 0 | 0 | 0 | 0 | 0 | 1 | 21 | .250 | .250 | .333 |
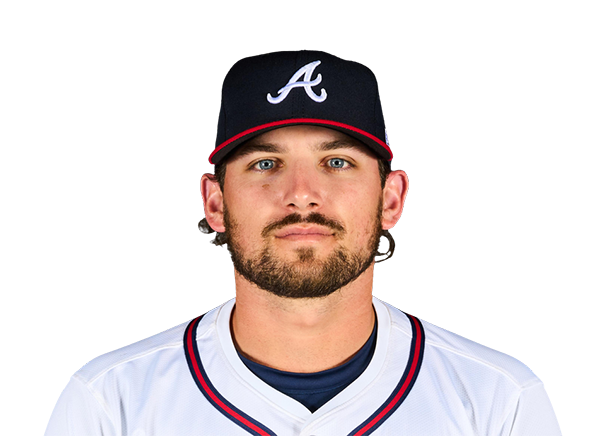 Austin Riley | 0-4 | 4 | 0 | 0 | 0 | 0 | 0 | 1 | 14 | .364 | .417 | .364 |
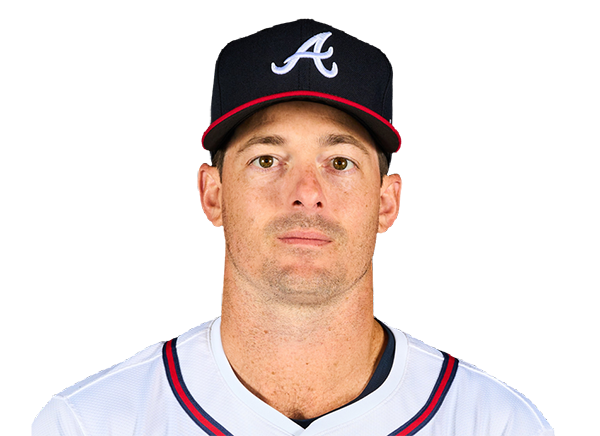 Mike Yastrzemski | 2-4 | 4 | 0 | 2 | 0 | 0 | 0 | 1 | 12 | .500 | .500 | .625 |
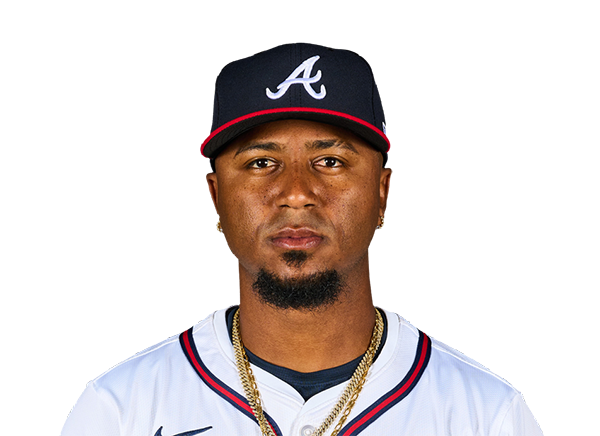 Ozzie Albies | 2-4 | 4 | 0 | 2 | 0 | 0 | 0 | 0 | 11 | .364 | .417 | .636 |
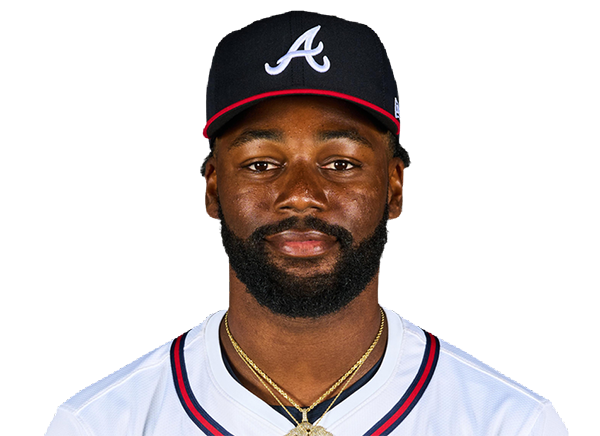 Michael Harris II | 0-3 | 3 | 0 | 0 | 0 | 0 | 0 | 0 | 6 | .364 | .364 | .636 |
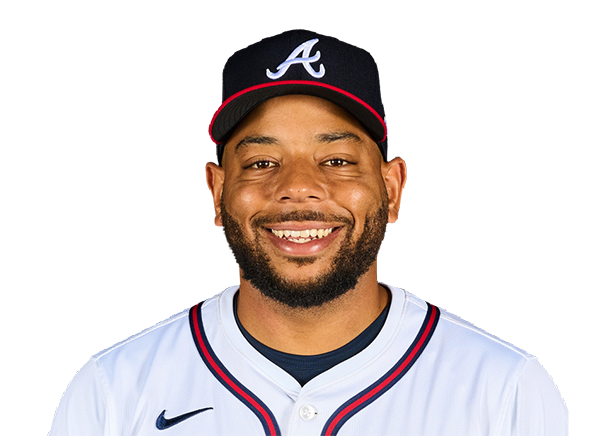 Dominic Smith | 1-2 | 2 | 0 | 1 | 0 | 0 | 0 | 0 | 12 | .333 | .333 | .833 |
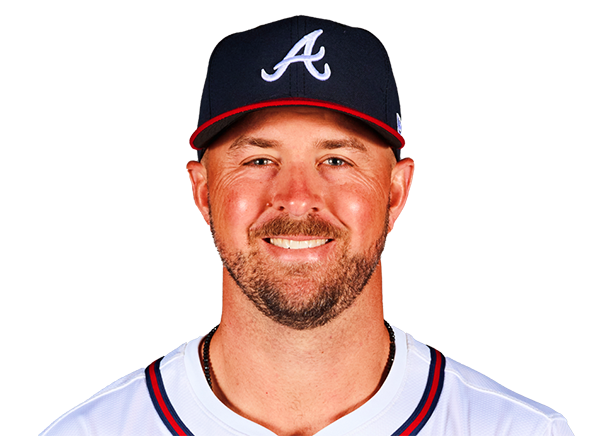 Kyle Farmer | 0-1 | 1 | 0 | 0 | 0 | 0 | 0 | 0 | 1 | .000 | .000 | .000 |
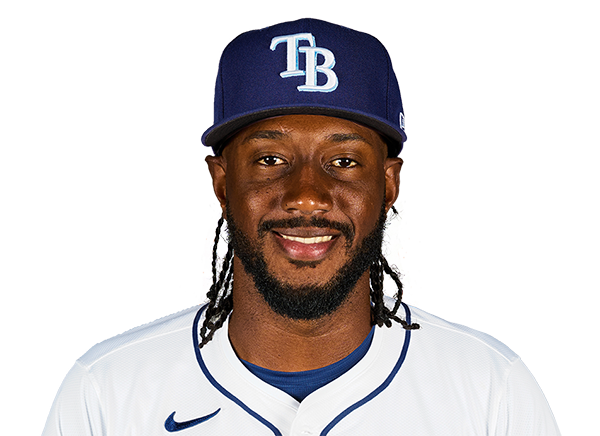 Jorge Mateo | 0-3 | 3 | 0 | 0 | 0 | 0 | 0 | 1 | 15 | .000 | .000 | .000 |
Kansas City Royals
| Player | IP | H | R | ER | BB | K | HR | PC-ST | ERA | PC |
|---|---|---|---|---|---|---|---|---|---|---|
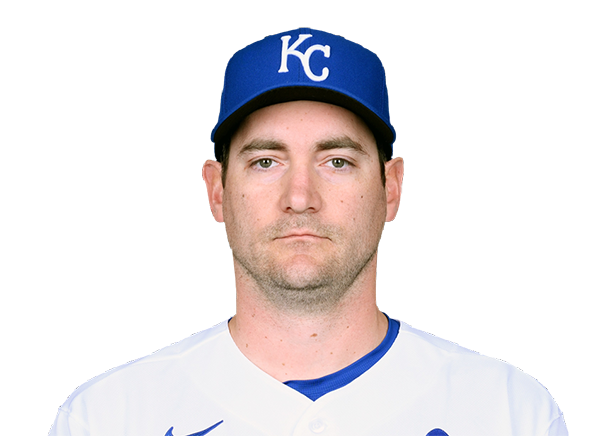 Seth Lugo | 6.1 | 5 | 0 | 0 | 0 | 3 | 0 | 77-55 | 0.00 | 77 |
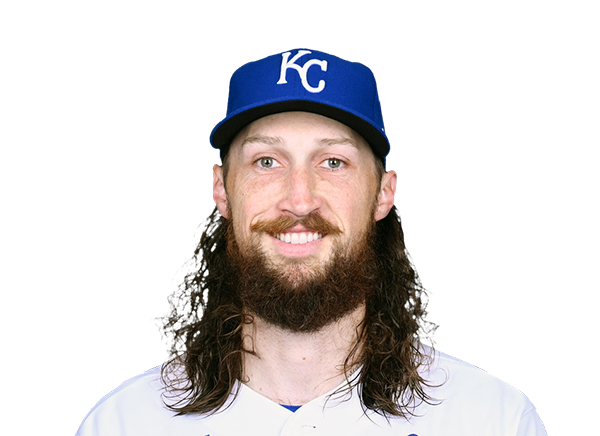 Matt Strahm | 0.2 | 0 | 0 | 0 | 0 | 0 | 0 | 4-4 | 0.00 | 4 |
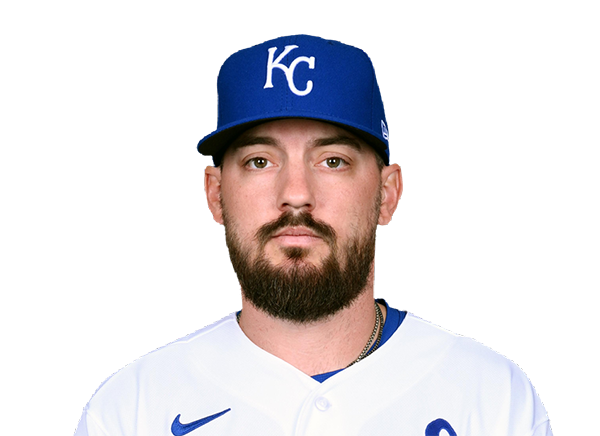 John Schreiber | 1.0 | 1 | 1 | 1 | 0 | 1 | 1 | 23-14 | 9.00 | 23 |
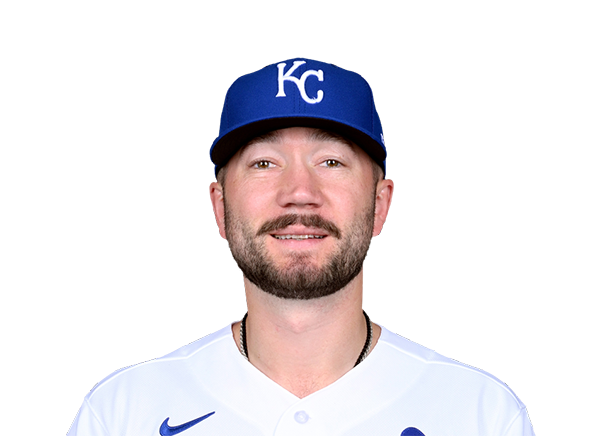 Lucas Erceg | 1.0 | 1 | 0 | 0 | 0 | 1 | 0 | 12-7 | 0.00 | 12 |
Atlanta Braves
| Player | IP | H | R | ER | BB | K | HR | PC-ST | ERA | PC |
|---|---|---|---|---|---|---|---|---|---|---|
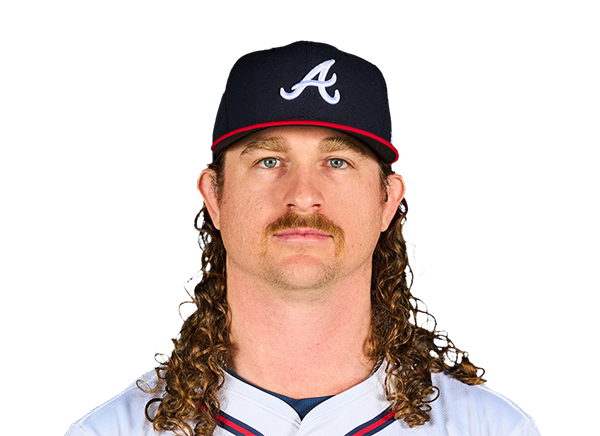 Grant Holmes | 5.0 | 5 | 3 | 3 | 2 | 4 | 1 | 76-45 | 5.40 | 76 |
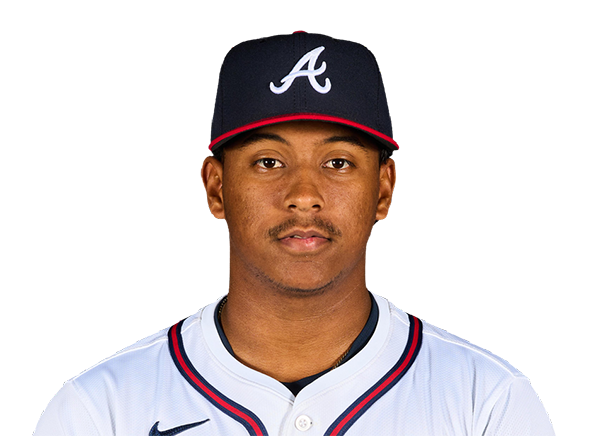 Didier Fuentes | 4.0 | 2 | 1 | 1 | 1 | 4 | 0 | 56-36 | 2.25 | 56 |
H2H / Season Series
ATL1–4
KC
ATL6–2
KC
ATL6–0
KC
Last 5 Games
| Date | Opponent | Result |
|---|---|---|
| Aug 22 |  vs DET | W3–1 |
| Aug 21 | vs DET | W5–2 |
| Aug 20 |  vs ATH | W6–2 |
| Aug 19 | vs ATH | W9–7 |
| Aug 18 | vs ATH | W4–3 |
| Date | Opponent | Result |
|---|---|---|
| Aug 22 |  @ MIL | L1–4 |
| Aug 21 | @ MIL | L1–2 |
| Aug 20 |  @ CHW | W2–0 |
| Aug 19 |  @ MIN | L4–6 |
| Aug 18 | @ MIN | L1–4 |
Standings
American League
| Team | W | L | PCT | GB | DIFF | STRK |
|---|---|---|---|---|---|---|
1 Rays | 76 | 52 | .594 | - | +43 | L2 |
| 2White Sox | 67 | 61 | .523 | 9 | +47 | W1 |
3 Astros | 65 | 64 | .504 | 11.5 | -42 | W1 |
4 Yankees | 73 | 56 | .566 | 3.5 | +95 | L1 |
5 Red Sox | 69 | 59 | .539 | 7 | +97 | W1 |
6 Rangers | 64 | 66 | .492 | 13 | -48 | L1 |
7 Blue Jays | 64 | 67 | .489 | 13.5 | -50 | W1 |
| 8Twins | 63 | 66 | .488 | 13.5 | -45 | L1 |
9 Guardians | 63 | 66 | .488 | 13.5 | -15 | W2 |
10 Orioles | 62 | 67 | .481 | 14.5 | -34 | W1 |
| 11Tigers | 61 | 68 | .473 | 15.5 | +77 | L4 |
12 Mariners | 61 | 68 | .473 | 15.5 | -45 | W1 |
| 13Royals | 57 | 74 | .435 | 20.5 | -95 | W7 |
14 Angels | 52 | 78 | .400 | 25 | -68 | W1 |
| 15Athletics | 49 | 80 | .380 | 27.5 | -189 | L5 |
National League
| Team | W | L | PCT | GB | DIFF | STRK |
|---|---|---|---|---|---|---|
| 1Brewers | 81 | 49 | .623 | - | +163 | W3 |
2 Dodgers | 78 | 51 | .605 | 2.5 | +146 | W4 |
| 3Braves | 75 | 55 | .577 | 6 | +108 | L2 |
4 Cubs | 74 | 55 | .574 | 6.5 | +99 | L2 |
5 Phillies | 72 | 58 | .554 | 9 | +25 | W8 |
6 Padres | 69 | 60 | .535 | 11.5 | +7 | W1 |
7 Diamondbacks | 68 | 61 | .527 | 12.5 | +13 | W2 |
8 Marlins | 66 | 64 | .508 | 15 | +17 | W2 |
9 Cardinals | 66 | 65 | .504 | 15.5 | 0 | L2 |
10 Pirates | 63 | 67 | .485 | 18 | +30 | L1 |
11 Reds | 61 | 68 | .473 | 19.5 | -98 | L2 |
12 Nationals | 61 | 70 | .466 | 20.5 | +14 | L3 |
13 Mets | 58 | 71 | .450 | 22.5 | -44 | L1 |
14 Giants | 52 | 76 | .406 | 28 | -78 | L2 |
15 Rockies | 50 | 78 | .391 | 30 | -130 | L4 |
KC
VS
ATL
Pitchers
Seth Lugo
Matt Strahm
John Schreiber
Lucas Erceg
Catchers
Carter Jensen
Infielders
Maikel Garcia
Bobby Witt Jr.
Vinnie Pasquantino
Nick Loftin
Outfielders
Lane Thomas
Jac Caglianone
Isaac Collins
Kyle Isbel
Designated Hitters
Salvador Perez
Pitchers
Grant Holmes
Didier Fuentes
Catchers
Drake Baldwin
Infielders
Matt Olson
Austin Riley
Ozzie Albies
Jorge Mateo
Outfielders
Ronald Acuna Jr.
Mike Yastrzemski
Michael Harris II
Designated Hitters
Dominic Smith
Kyle Farmer
Royals
VS
Braves
Batting
130
Team Games Played
129
4351
At Bats
4363
1069
Hits
1074
521
Runs Batted In
584
132
Home Runs
167
98
Stolen Bases
63
.246
Batting Average
.246
546
Runs
609
232
Doubles
206
18
Triples
9
1733
Total Bases
1799
405
Walks
375
1018
Strikeouts
1046
.314
On Base Percentage
.310
.398
Slugging Percentage
.412
.712
OBP Pct + SLG Pct
.723
130
Games Played
129
130
Games Started
129
46
Hit By Pitch
48
0.0
Wins Above Replacement
0.0
0.0
Offensive Wins Above Replacement
0.0
28
Caught Stealing
21
1
Is Qualified
1
555.7
Runs Created
570.3
4.3
Runs Created Per 27 Outs
4.5
.083
Walks Per Plate Appearance
.078
0.40
Walk To Strikeout Ratio
0.36
.153
Isolated Power
.166
.262
Secondary Average
.262
3.81
Pitches Per Plate Appearance
3.88
382
Extra Base Hits
382
4867
Plate Appearances
4833
33.0
At Bats Per Home Run
26.1
22
Sacrifice Hit
7
41
Sacrifice Flies
37
Pitching
130
Team Games Played
129
52
Quality Starts
49
56
Wins
75
74
Losses
54
32
Saves
39
62
Holds
92
1127
Hits
983
602
Earned runs
462
161
Home Runs
145
483
Walks
439
949
Strikeouts
1101
7.5
Strikeouts Per 9 Innings
8.7
147.3
Pitches Per Start
144.4
1.41
Walks Plus Hits Per Inning Pitched
1.24
4.74
Earned Run Average
3.63
74
Losses
54
1142.1
Innings pitched
1145.0
.431
Win Percentage
.581
55
Save Opportunities
56
.259
Opponent Batting Average
.230
.337
Opponent's On-base pct.
.307
.433
Opponent's Slugging pct.
.378
.770
Opponent's OPB Pct + SLG Pct
.685
4359
At Bats
4270
236
Doubles
162
20
Triples
17
48
Batters Hit
45
64
Stolen Bases
95
130
Games Played
129
2
Complete Games
0
7
Shutouts
8
46
Wild Pitches
26
612
Runs Batted In
478
2
Balks
4
1142.1
Innings pitched
1145.0
7.5
Strikeouts Per 9 Innings
8.7
33
Caught Stealing
17
130
Games Started
129
0.0
Wins Above Replacement
0.0
1
Is Qualified
1
643
Runs
498
602
Earned Runs
462
1886
Total Bases
1614
Fielding
130
Team Games Played
129
1142
Full Innings
1145
4666
Total Chances
4538
3427
Putouts
3435
1183
Assists
1045
56
Errors
58
232
Double Plays
206
0.988
Fielding Percentage
0.987
36.3
Range Factor
35.2
0.0
Zone Rating
0.0
130
Games Played
129
0
Games Started
0
0.0
Defensive Wins Above Replacement
0.0
1
Qualified
1