

Royals vs Dodgers Live Score (11 Aug, 2026)
Game Information
Stage
Standard
Season
2026
First Pitch
Mon, Aug 10, 10:10 pm
Venue
Dodger Stadium
Location
Los Angeles, California
Attendance
51,799
Home Runs
Jac Caglianone
20 HR
.264 AVG
49 RBI
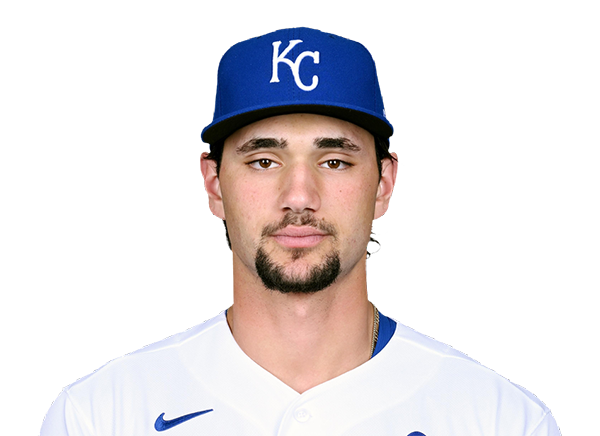
Shohei Ohtani
26 HR
.292 AVG
71 RBI
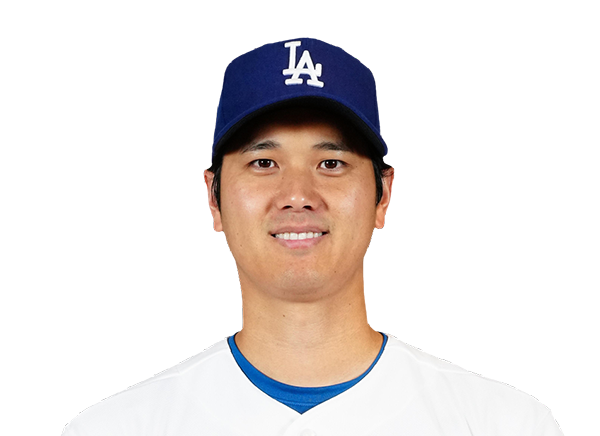
Batting Average
Bobby Witt Jr.
.284 AVG
.355 OBP
.450 SLG

Freddie Freeman
.303 AVG
.377 OBP
.474 SLG
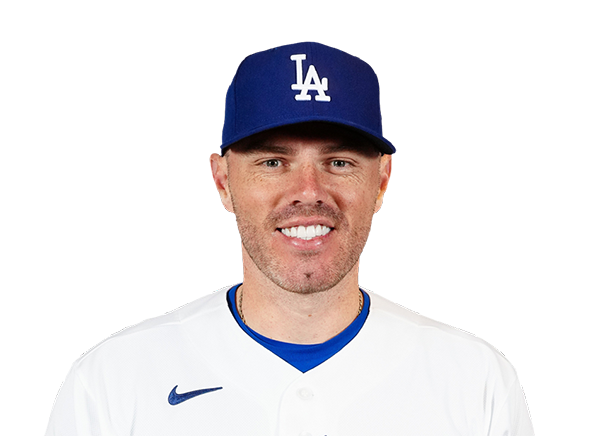
Runs Batted In
Carter Jensen
55 RBI
16 HR
.227 AVG
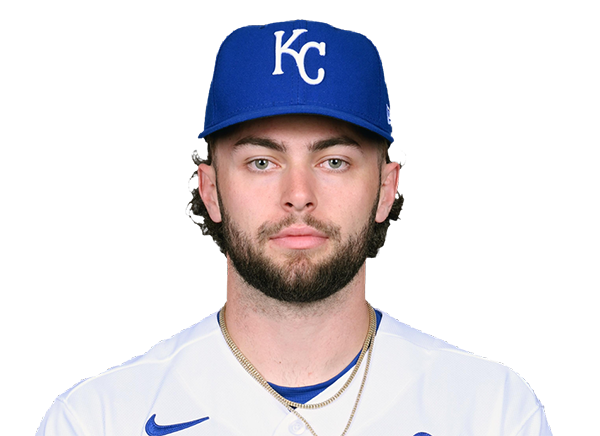
Andy Pages
76 RBI
19 HR
.272 AVG
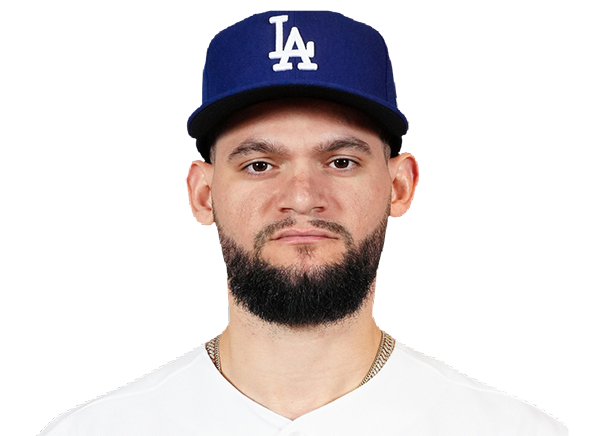
Earned Run Average
Michael Wacha
3.44 ERA
5 W
112 K
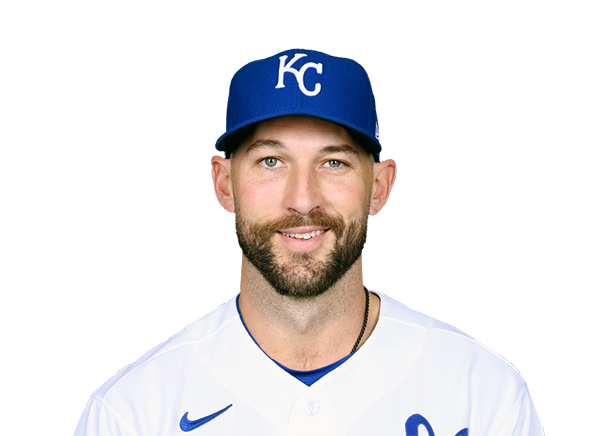
Yoshinobu Yamamoto
2.65 ERA
11 W
127 K
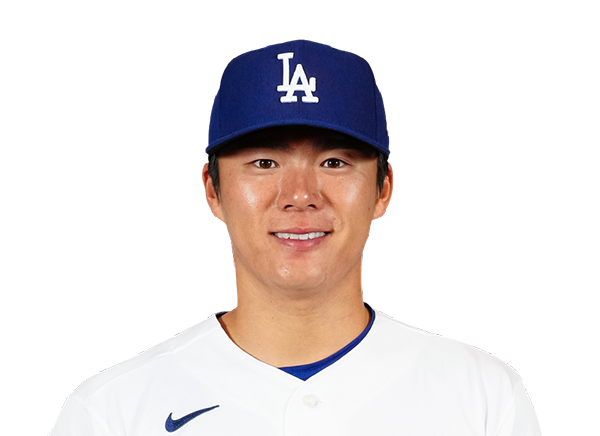
Wins
Noah Cameron
6 W
4.37 ERA
116 K
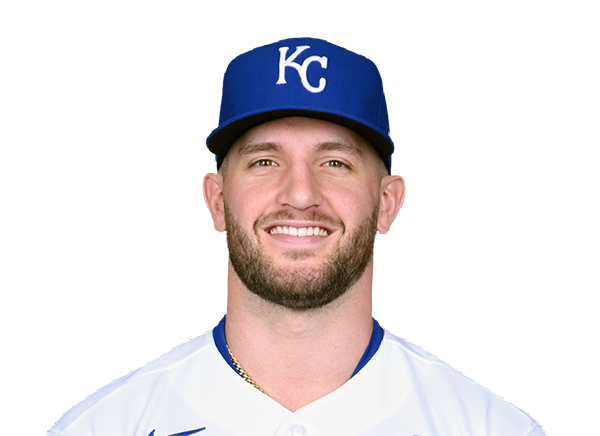
Yoshinobu Yamamoto
11 W
2.65 ERA
127 K
Strikeouts
Noah Cameron
116 K
6 W
4.37 ERA
Yoshinobu Yamamoto
127 K
11 W
2.65 ERA
Injury Report
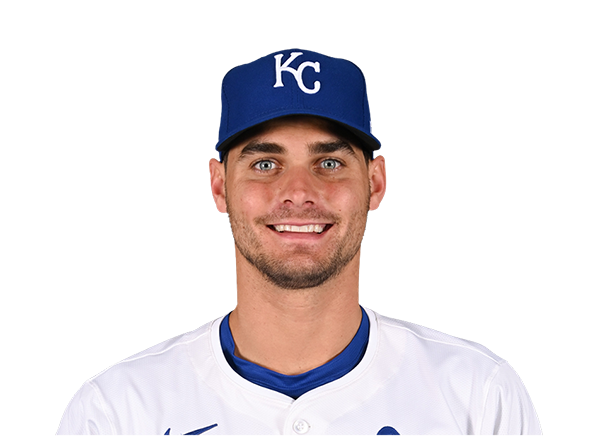
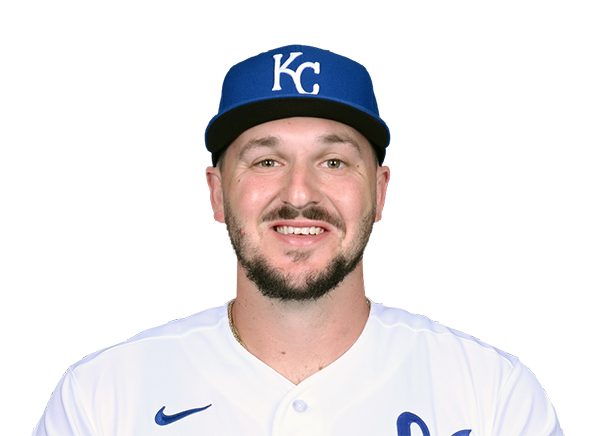
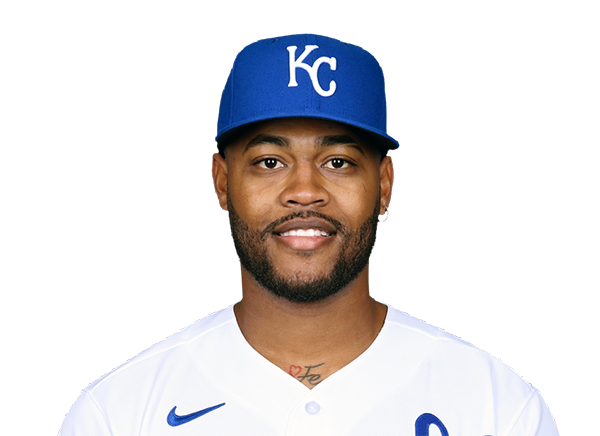

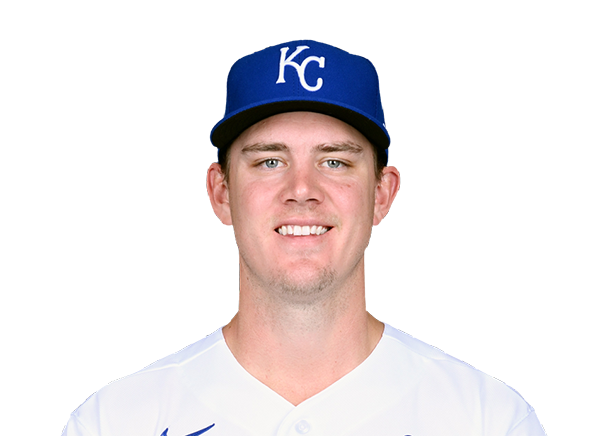
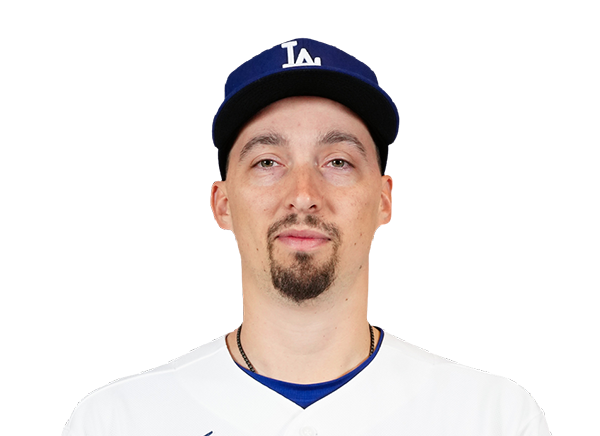
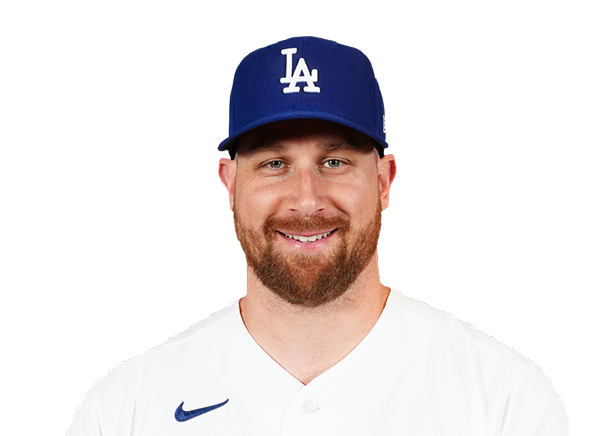
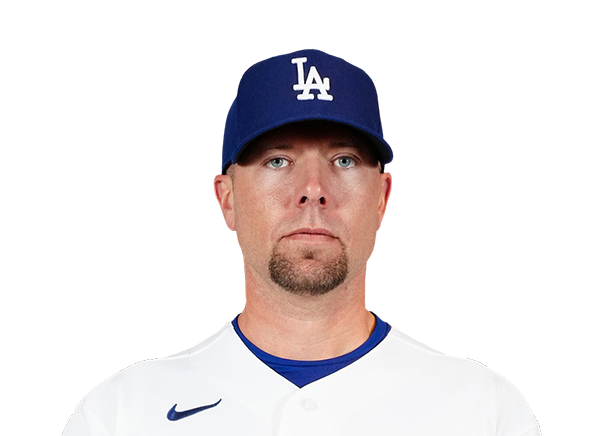
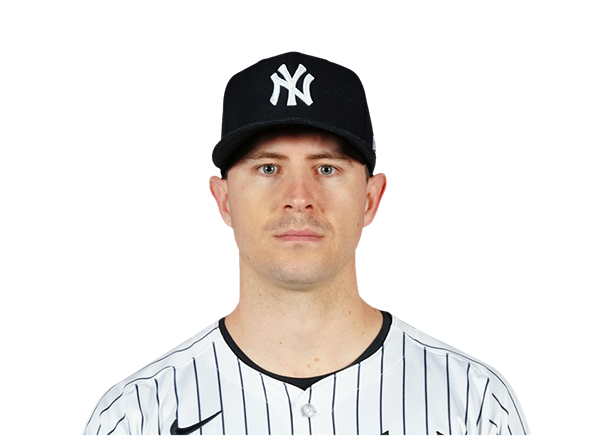

Team Stats
 KC
LAD


Array
Runs
Array
6
Hits
10
0
Errors
0
—
Home Runs
—
—
Walks
—
—
Strikeouts
—
Standings
American League
| Team | W | L | PCT | GB | DIFF | STRK |
|---|---|---|---|---|---|---|
1 Rays | 76 | 53 | .589 | - | +42 | L3 |
2 White Sox | 67 | 62 | .519 | 9 | +42 | L1 |
3 Astros | 65 | 65 | .500 | 11.5 | -43 | L1 |
4 Yankees | 73 | 56 | .566 | 3 | +95 | L1 |
5 Red Sox | 70 | 59 | .543 | 6 | +98 | W2 |
6 Rangers | 64 | 66 | .492 | 12.5 | -48 | L1 |
7 Guardians | 64 | 66 | .492 | 12.5 | -14 | W3 |
8 Blue Jays | 64 | 67 | .489 | 13 | -50 | W1 |
9 Twins | 63 | 67 | .485 | 13.5 | -47 | L2 |
10 Orioles | 63 | 67 | .485 | 13.5 | -33 | W2 |
11 Mariners | 62 | 68 | .477 | 14.5 | -44 | W2 |
12 Tigers | 61 | 68 | .473 | 15 | +77 | L4 |
| 13Royals | 57 | 74 | .435 | 20 | -95 | W7 |
14 Angels | 52 | 78 | .400 | 24.5 | -68 | W1 |
15 Athletics | 50 | 80 | .385 | 26.5 | -188 | W1 |
National League
| Team | W | L | PCT | GB | DIFF | STRK |
|---|---|---|---|---|---|---|
1 Brewers | 81 | 49 | .623 | - | +163 | W3 |
| 2Dodgers | 79 | 51 | .608 | 2 | +147 | W5 |
3 Braves | 75 | 55 | .577 | 6 | +108 | L2 |
4 Cubs | 74 | 56 | .569 | 7 | +98 | L3 |
5 Phillies | 72 | 58 | .554 | 9 | +25 | W8 |
6 Padres | 70 | 60 | .538 | 11 | +9 | W2 |
7 Diamondbacks | 68 | 62 | .523 | 13 | +7 | L1 |
8 Marlins | 66 | 64 | .508 | 15 | +17 | W2 |
9 Cardinals | 66 | 65 | .504 | 15.5 | 0 | L2 |
10 Pirates | 63 | 68 | .481 | 18.5 | +29 | L2 |
11 Reds | 62 | 68 | .477 | 19 | -92 | W1 |
12 Nationals | 61 | 70 | .466 | 20.5 | +14 | L3 |
13 Mets | 59 | 71 | .454 | 22 | -39 | W1 |
14 Giants | 52 | 77 | .403 | 28.5 | -79 | L3 |
15 Rockies | 50 | 79 | .388 | 30.5 | -131 | L5 |
KC
VS
LAD
Pitchers
Noah Cameron
Catchers

Salvador Perez
Infielders
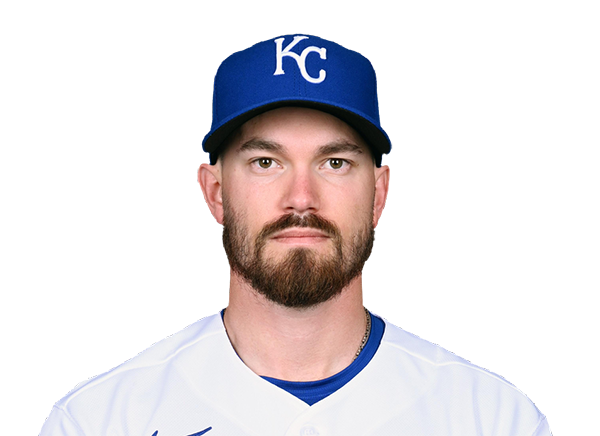
Nick Loftin
Bobby Witt Jr.
Jac Caglianone
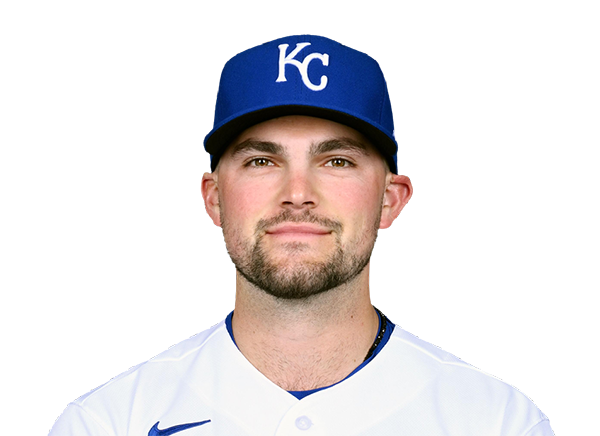
Michael Massey
Outfielders
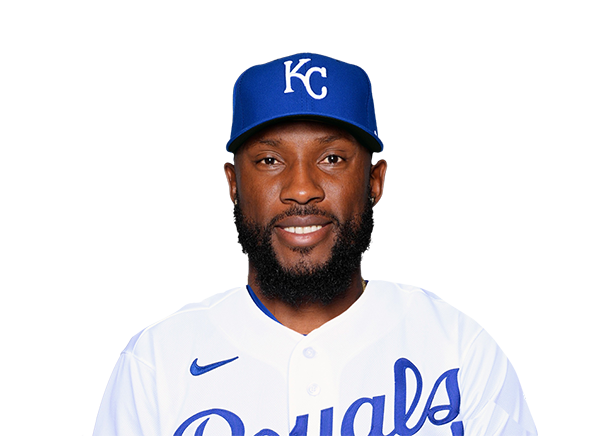
Starling Marte
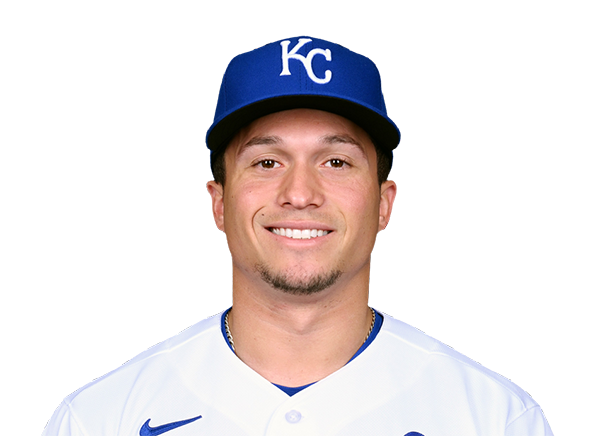
Isaac Collins
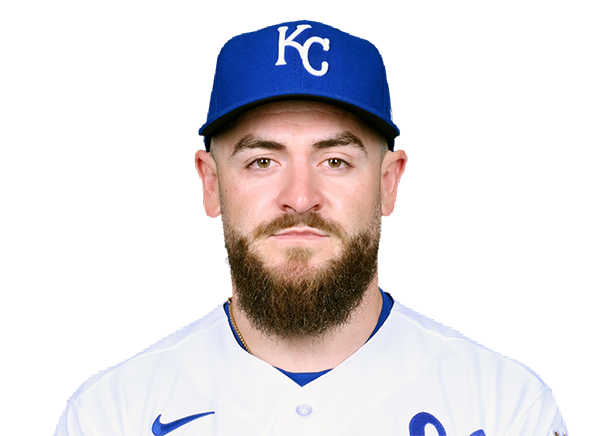
Kyle Isbel
Designated Hitters
Carter Jensen
Pitchers

Tarik Skubal
Catchers

Hunter Feduccia
Infielders
Freddie Freeman

Mookie Betts
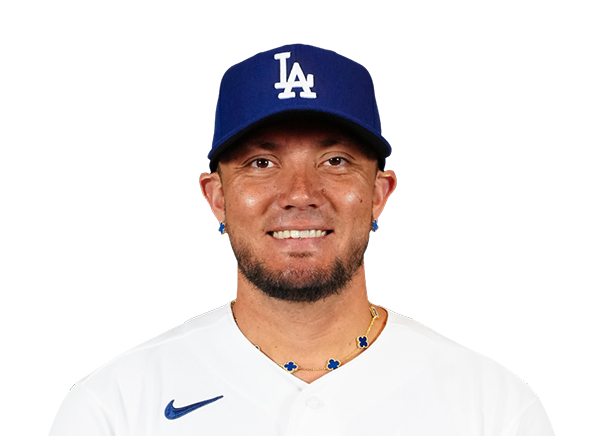
Miguel Rojas
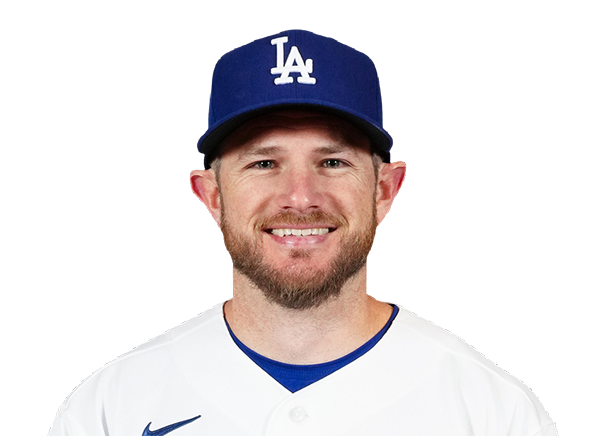
Max Muncy
Outfielders
Andy Pages
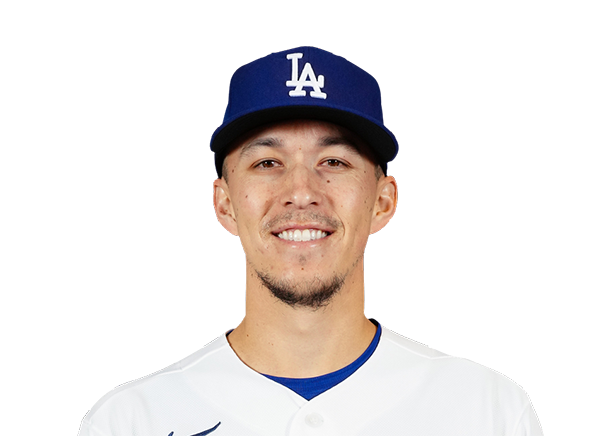
Tommy Edman
Teoscar Hernandez
Designated Hitters
Shohei Ohtani
Royals
VS
Dodgers
Batting
120
Team Games Played
119
4018
At Bats
4009
983
Hits
1046
474
Runs Batted In
562
122
Home Runs
151
92
Stolen Bases
46
.245
Batting Average
.261
497
Runs
597
217
Doubles
195
16
Triples
12
1598
Total Bases
1718
370
Walks
446
941
Strikeouts
930
.312
On Base Percentage
.338
.398
Slugging Percentage
.429
.710
OBP Pct + SLG Pct
.767
120
Games Played
119
120
Games Started
119
42
Hit By Pitch
41
0.0
Wins Above Replacement
0.0
0.0
Offensive Wins Above Replacement
0.0
25
Caught Stealing
16
1
Is Qualified
1
511.4
Runs Created
582.0
4.3
Runs Created Per 27 Outs
5.0
.082
Walks Per Plate Appearance
.098
0.39
Walk To Strikeout Ratio
0.48
.153
Isolated Power
.168
.262
Secondary Average
.286
3.80
Pitches Per Plate Appearance
3.94
355
Extra Base Hits
358
4489
Plate Appearances
4550
32.9
At Bats Per Home Run
26.5
20
Sacrifice Hit
12
39
Sacrifice Flies
39
Pitching
120
Team Games Played
119
50
Quality Starts
61
49
Wins
71
71
Losses
48
29
Saves
32
54
Holds
74
1055
Hits
852
568
Earned runs
435
152
Home Runs
143
449
Walks
369
887
Strikeouts
1059
7.6
Strikeouts Per 9 Innings
9.1
148.1
Pitches Per Start
142.5
1.43
Walks Plus Hits Per Inning Pitched
1.16
4.85
Earned Run Average
3.73
71
Losses
48
1054.0
Innings pitched
1049.2
.408
Win Percentage
.597
52
Save Opportunities
47
.261
Opponent Batting Average
.219
.340
Opponent's On-base pct.
.293
.439
Opponent's Slugging pct.
.377
.779
Opponent's OPB Pct + SLG Pct
.670
4037
At Bats
3898
222
Doubles
169
20
Triples
10
45
Batters Hit
49
62
Stolen Bases
68
120
Games Played
119
1
Complete Games
1
6
Shutouts
10
43
Wild Pitches
27
578
Runs Batted In
436
2
Balks
4
1054.0
Innings pitched
1049.2
7.6
Strikeouts Per 9 Innings
9.1
30
Caught Stealing
17
120
Games Started
119
0.0
Wins Above Replacement
0.0
1
Is Qualified
1
608
Runs
458
568
Earned Runs
435
1773
Total Bases
1470
Fielding
120
Team Games Played
119
1054
Full Innings
1050
4304
Total Chances
4167
3162
Putouts
3149
1086
Assists
973
56
Errors
45
217
Double Plays
195
0.987
Fielding Percentage
0.989
36.3
Range Factor
35.3
0.0
Zone Rating
0.0
120
Games Played
119
0
Games Started
0
0.0
Defensive Wins Above Replacement
0.0
1
Qualified
1