

Royals vs Dodgers Live Score (13 Aug, 2026)
Game Information
Stage
Standard
Season
2026
First Pitch
Wed, Aug 12, 10:10 pm
Venue
Dodger Stadium
Location
Los Angeles, California
Attendance
47,578
Home Runs
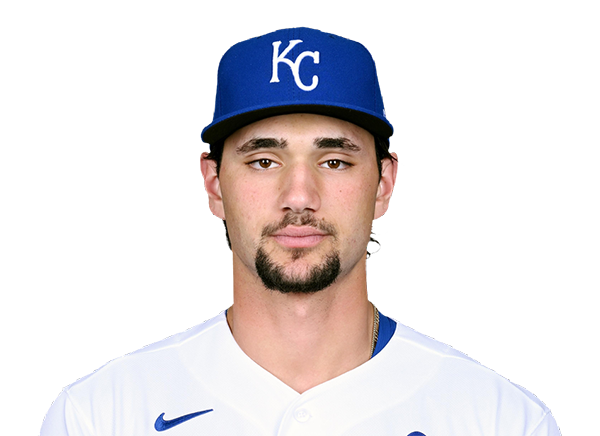
Jac Caglianone
21 HR
.269 AVG
53 RBI
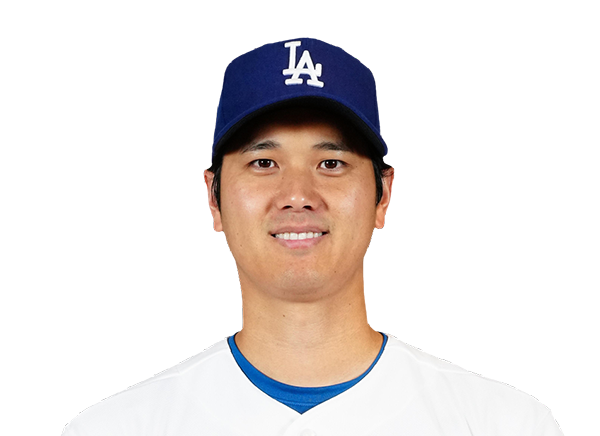
Shohei Ohtani
26 HR
.290 AVG
72 RBI
Batting Average
Bobby Witt Jr.
.283 AVG
.355 OBP
.446 SLG

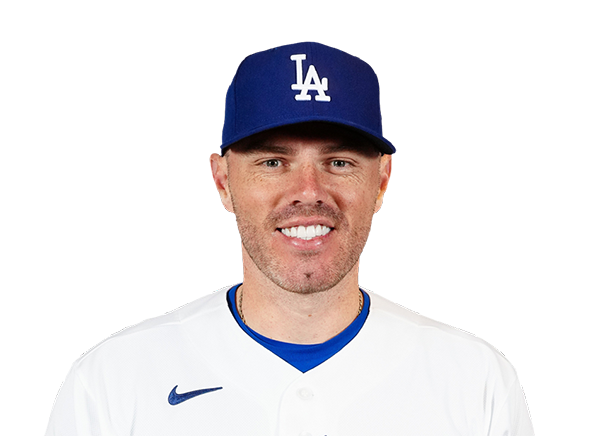
Freddie Freeman
.305 AVG
.378 OBP
.472 SLG
Runs Batted In
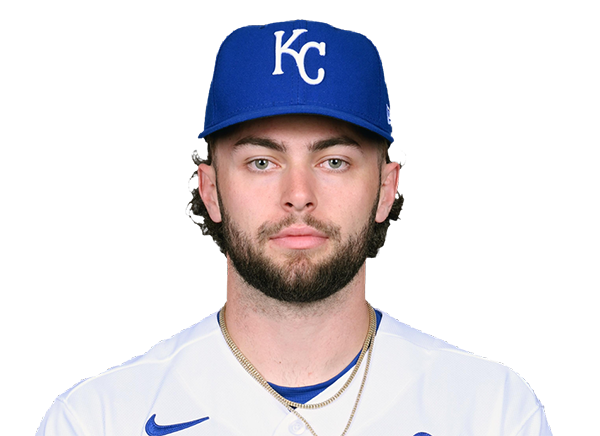
Carter Jensen
55 RBI
16 HR
.224 AVG
Andy Pages
76 RBI
19 HR
.270 AVG
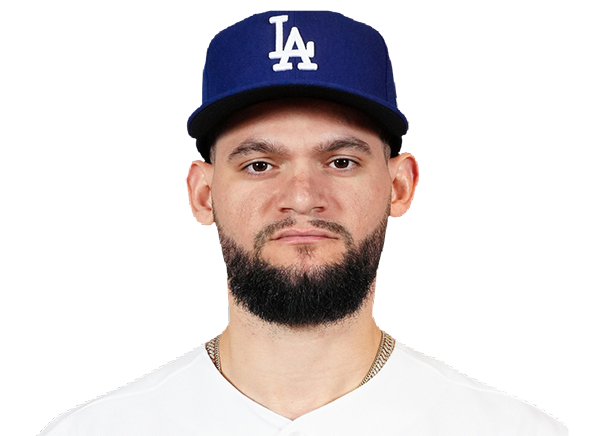
Earned Run Average
Michael Wacha
3.46 ERA
5 W
117 K
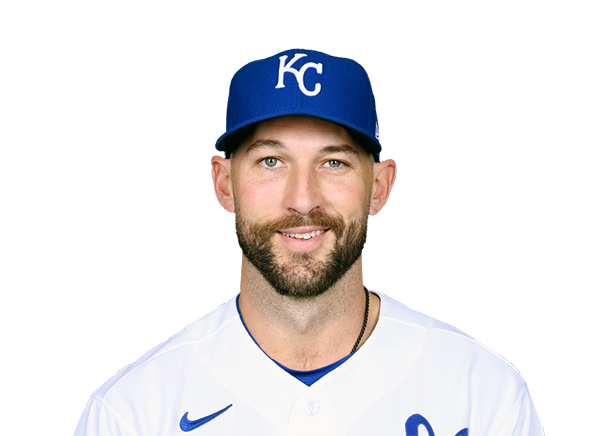
Yoshinobu Yamamoto
2.65 ERA
11 W
127 K
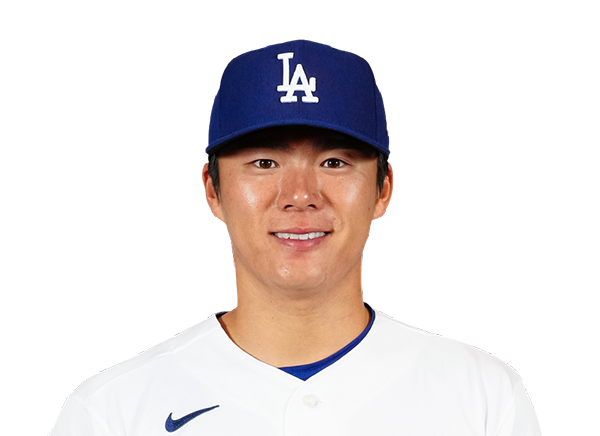
Wins
Noah Cameron
6 W
4.45 ERA
118 K
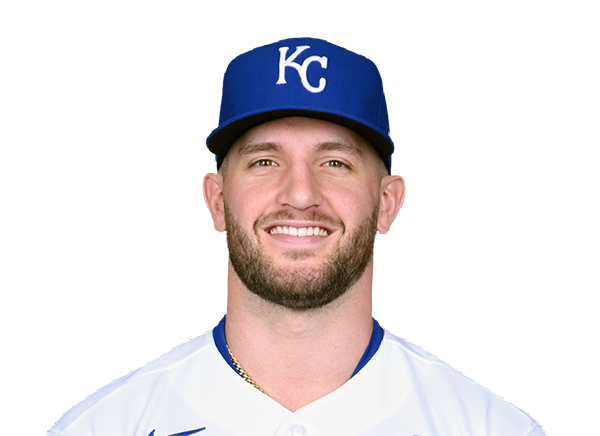
Yoshinobu Yamamoto
11 W
2.65 ERA
127 K
Strikeouts
Noah Cameron
118 K
6 W
4.45 ERA
Yoshinobu Yamamoto
127 K
11 W
2.65 ERA
Injury Report

Team Stats
 KC
LAD


Array
Runs
Array
6
Hits
8
0
Errors
2
—
Home Runs
—
—
Walks
—
—
Strikeouts
—
Standings
American League
| Team | W | L | PCT | GB | DIFF | STRK |
|---|---|---|---|---|---|---|
1 Rays | 76 | 53 | .589 | - | +42 | L3 |
2 White Sox | 67 | 62 | .519 | 9 | +42 | L1 |
3 Astros | 65 | 65 | .500 | 11.5 | -43 | L1 |
4 Yankees | 73 | 56 | .566 | 3 | +95 | L1 |
5 Red Sox | 70 | 59 | .543 | 6 | +98 | W2 |
6 Rangers | 64 | 66 | .492 | 12.5 | -48 | L1 |
7 Guardians | 64 | 66 | .492 | 12.5 | -14 | W3 |
8 Blue Jays | 64 | 67 | .489 | 13 | -50 | W1 |
9 Twins | 63 | 67 | .485 | 13.5 | -47 | L2 |
10 Orioles | 63 | 67 | .485 | 13.5 | -33 | W2 |
11 Mariners | 62 | 68 | .477 | 14.5 | -44 | W2 |
12 Tigers | 61 | 68 | .473 | 15 | +77 | L4 |
| 13Royals | 57 | 74 | .435 | 20 | -95 | W7 |
14 Angels | 52 | 78 | .400 | 24.5 | -68 | W1 |
15 Athletics | 50 | 80 | .385 | 26.5 | -188 | W1 |
National League
| Team | W | L | PCT | GB | DIFF | STRK |
|---|---|---|---|---|---|---|
1 Brewers | 81 | 49 | .623 | - | +163 | W3 |
| 2Dodgers | 79 | 51 | .608 | 2 | +147 | W5 |
3 Braves | 75 | 55 | .577 | 6 | +108 | L2 |
4 Cubs | 74 | 56 | .569 | 7 | +98 | L3 |
5 Phillies | 72 | 58 | .554 | 9 | +25 | W8 |
6 Padres | 70 | 60 | .538 | 11 | +9 | W2 |
7 Diamondbacks | 68 | 62 | .523 | 13 | +7 | L1 |
8 Marlins | 66 | 64 | .508 | 15 | +17 | W2 |
9 Cardinals | 66 | 65 | .504 | 15.5 | 0 | L2 |
10 Pirates | 63 | 68 | .481 | 18.5 | +29 | L2 |
11 Reds | 62 | 68 | .477 | 19 | -92 | W1 |
12 Nationals | 61 | 70 | .466 | 20.5 | +14 | L3 |
13 Mets | 59 | 71 | .454 | 22 | -39 | W1 |
14 Giants | 52 | 77 | .403 | 28.5 | -79 | L3 |
15 Rockies | 50 | 79 | .388 | 30.5 | -131 | L5 |
KC
VS
LAD
Pitchers
Daniel Lynch IV
Catchers

Salvador Perez
Infielders
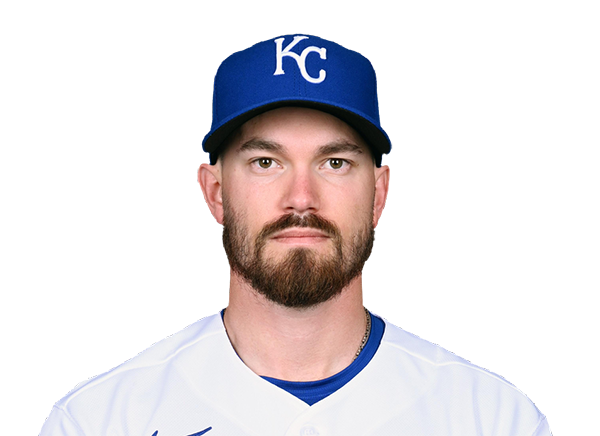
Nick Loftin
Bobby Witt Jr.
Jac Caglianone
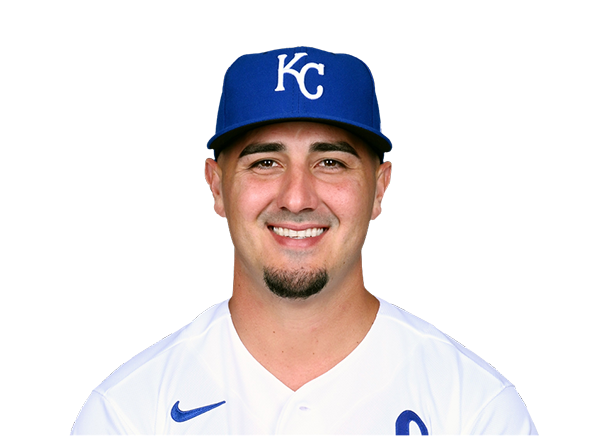
Josh Rojas
Outfielders
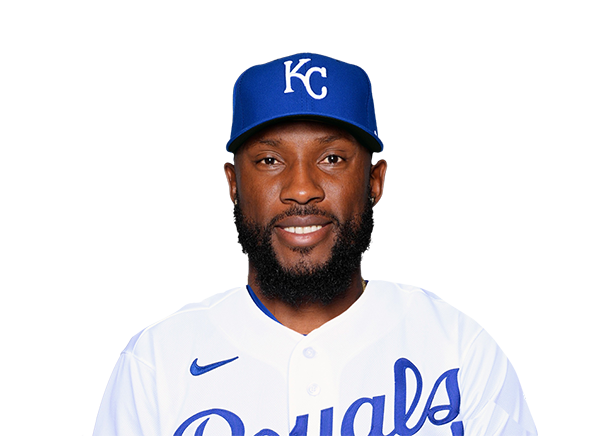
Starling Marte
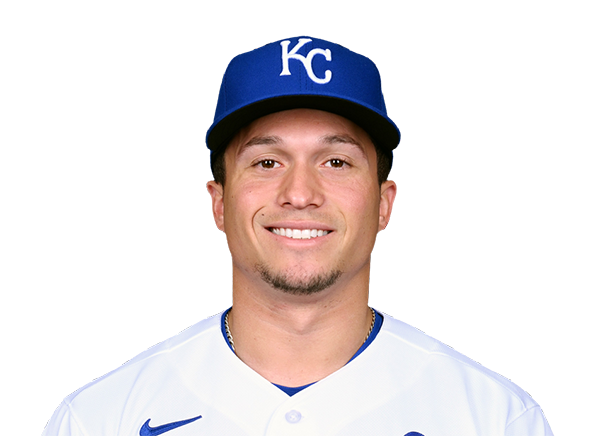
Isaac Collins
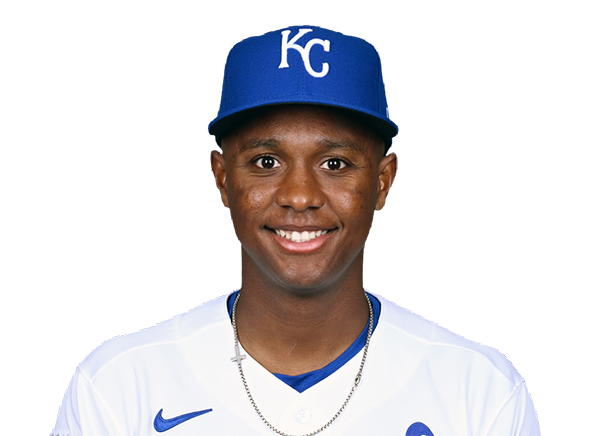
Tyler Tolbert
Designated Hitters
Carter Jensen
Pitchers

Eric Lauer
Catchers
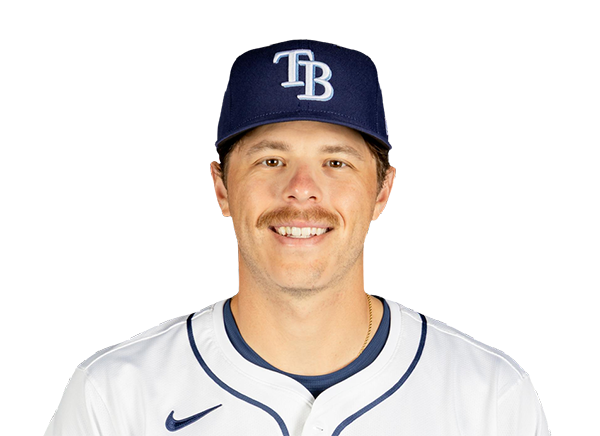
Hunter Feduccia
Infielders
Freddie Freeman

Mookie Betts
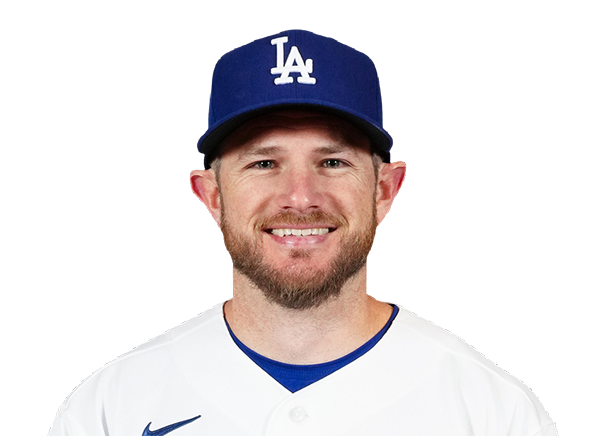
Max Muncy
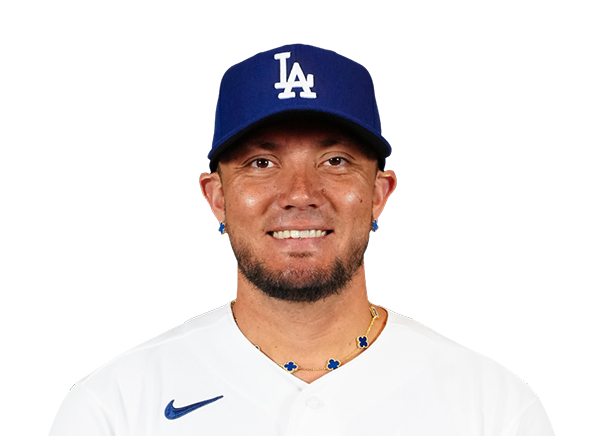
Miguel Rojas
Outfielders
Andy Pages
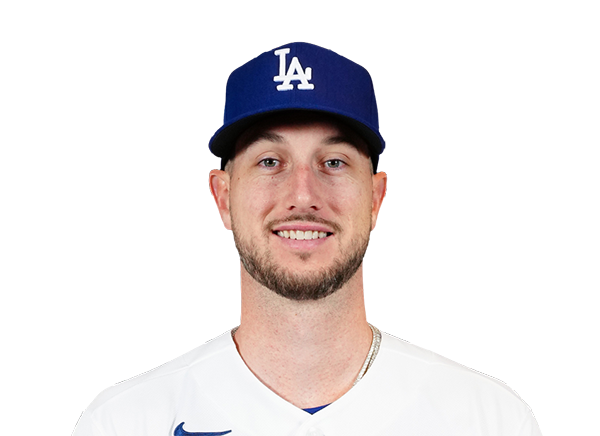
Kyle Tucker
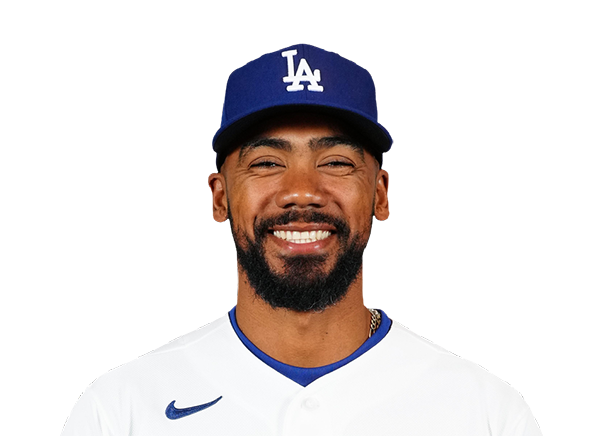
Teoscar Hernandez
Designated Hitters
Shohei Ohtani
Royals
VS
Dodgers
Batting
122
Team Games Played
121
4088
At Bats
4074
995
Hits
1063
479
Runs Batted In
571
122
Home Runs
155
95
Stolen Bases
46
.243
Batting Average
.261
503
Runs
606
219
Doubles
199
16
Triples
12
1612
Total Bases
1751
376
Walks
453
963
Strikeouts
944
.311
On Base Percentage
.338
.394
Slugging Percentage
.430
.705
OBP Pct + SLG Pct
.768
122
Games Played
121
122
Games Started
121
43
Hit By Pitch
42
0.0
Wins Above Replacement
0.0
0.0
Offensive Wins Above Replacement
0.0
25
Caught Stealing
17
1
Is Qualified
1
515.0
Runs Created
592.5
4.3
Runs Created Per 27 Outs
5.0
.082
Walks Per Plate Appearance
.098
0.39
Walk To Strikeout Ratio
0.48
.151
Isolated Power
.169
.260
Secondary Average
.287
3.81
Pitches Per Plate Appearance
3.93
357
Extra Base Hits
366
4567
Plate Appearances
4623
33.5
At Bats Per Home Run
26.3
20
Sacrifice Hit
12
40
Sacrifice Flies
39
Pitching
122
Team Games Played
121
51
Quality Starts
63
49
Wins
73
73
Losses
48
29
Saves
33
54
Holds
74
1072
Hits
864
576
Earned runs
439
156
Home Runs
143
456
Walks
375
901
Strikeouts
1081
7.6
Strikeouts Per 9 Innings
9.1
147.8
Pitches Per Start
142.7
1.43
Walks Plus Hits Per Inning Pitched
1.16
4.84
Earned Run Average
3.70
73
Losses
48
1071.1
Innings pitched
1068.2
.402
Win Percentage
.603
52
Save Opportunities
49
.261
Opponent Batting Average
.218
.340
Opponent's On-base pct.
.292
.440
Opponent's Slugging pct.
.374
.780
Opponent's OPB Pct + SLG Pct
.666
4102
At Bats
3968
226
Doubles
171
20
Triples
10
46
Batters Hit
50
62
Stolen Bases
71
122
Games Played
121
1
Complete Games
1
6
Shutouts
10
43
Wild Pitches
28
587
Runs Batted In
441
2
Balks
4
1071.1
Innings pitched
1068.2
7.6
Strikeouts Per 9 Innings
9.1
31
Caught Stealing
17
122
Games Started
121
0.0
Wins Above Replacement
0.0
1
Is Qualified
1
617
Runs
464
576
Earned Runs
439
1806
Total Bases
1484
Fielding
122
Team Games Played
121
1071
Full Innings
1069
4374
Total Chances
4234
3214
Putouts
3206
1104
Assists
980
56
Errors
48
219
Double Plays
199
0.987
Fielding Percentage
0.989
36.3
Range Factor
35.3
0.0
Zone Rating
0.0
122
Games Played
121
0
Games Started
0
0.0
Defensive Wins Above Replacement
0.0
1
Qualified
1