

Royals vs Pirates Live Score (18 Sep, 2026)
Game Information
Stage
STD
Season
2026
First Pitch
Fri, Sep 18, 6:40 pm
Venue
PNC Park
Location
Pittsburgh, Pennsylvania
Venue Type
Outdoor
Broadcast
MLB.TV
Attendance
25,424
Live Situation
2Balls
3Strikes
0Outs
—Pitcher
—At Bat
Pitch Sequence
1
STRIKE LOOKING
Sinker
94 MPH
2
BALL
Slider
81 MPH
3
STRIKE FOUL
Sinker
96 MPH
4
BALL
Slider
85 MPH
5
STRIKE FOUL
Slider
84 MPH
6
STRIKE SWINGING
Slider
83 MPH
Injury Report




Team Stats
 KC
PIT


5
Runs
8
8
Hits
15
2
Errors
0
2
Home Runs
1
2
Walks
3
11
Strikeouts
7
Player Box Score
Kansas City Royals
| Player | H-AB | AB | R | H | RBI | HR | BB | K | #P | AVG | OBP | SLG |
|---|---|---|---|---|---|---|---|---|---|---|---|---|
 Carter Jensen | 0-4 | 4 | 0 | 0 | 0 | 0 | 0 | 3 | 21 | .233 | .320 | .450 |
 Bobby Witt Jr. | 1-4 | 4 | 1 | 1 | 0 | 0 | 0 | 0 | 15 | .276 | .358 | .440 |
 Vinnie Pasquantino | 2-4 | 4 | 2 | 2 | 2 | 1 | 0 | 0 | 13 | .240 | .327 | .395 |
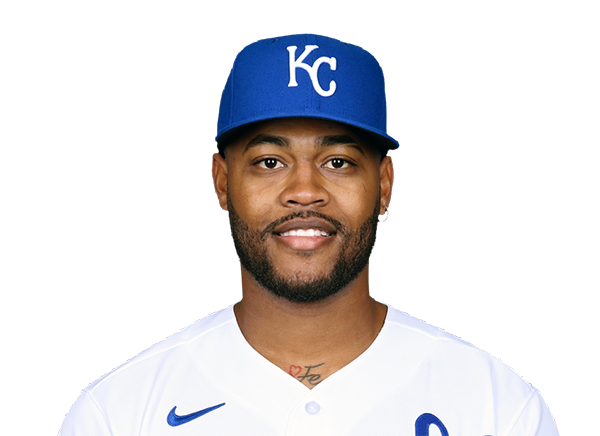 Maikel Garcia | 1-4 | 4 | 0 | 1 | 2 | 0 | 0 | 1 | 13 | .262 | .318 | .378 |
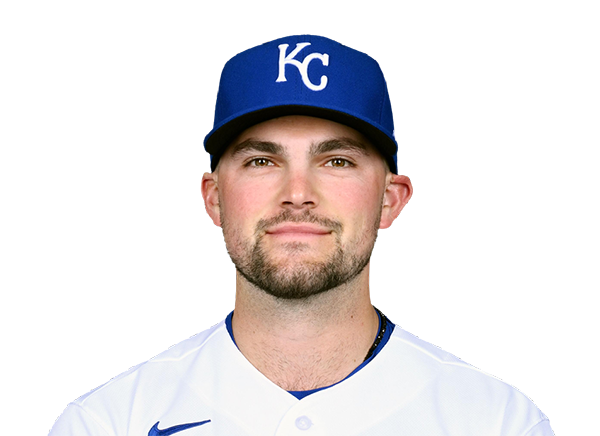 Michael Massey | 1-4 | 4 | 1 | 1 | 1 | 1 | 0 | 0 | 16 | .279 | .312 | .444 |
 Salvador Perez | 0-4 | 4 | 0 | 0 | 0 | 0 | 0 | 2 | 16 | .226 | .270 | .374 |
 John Rave | 1-2 | 2 | 0 | 1 | 0 | 0 | 1 | 1 | 13 | .227 | .319 | .454 |
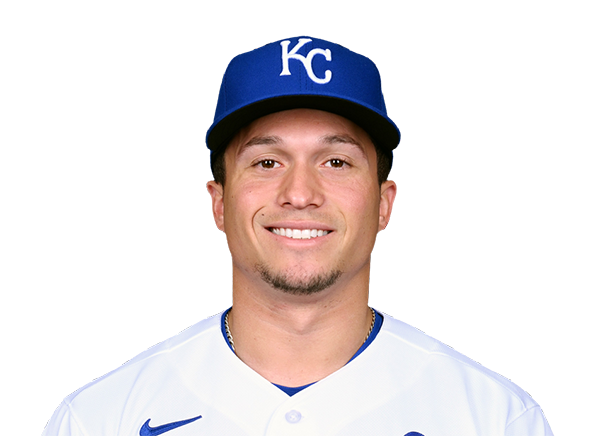 Isaac Collins | 0-1 | 1 | 0 | 0 | 0 | 0 | 0 | 1 | 5 | .219 | .325 | .332 |
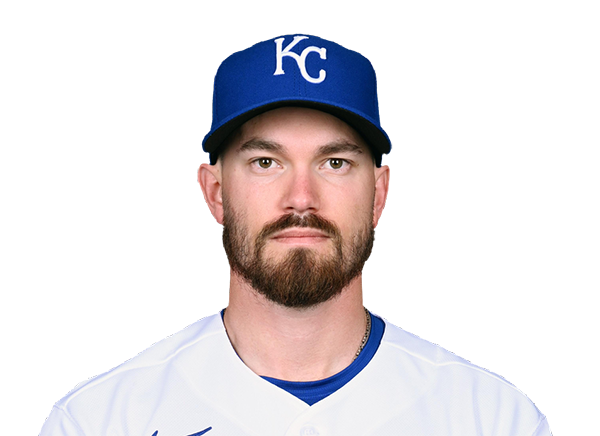 Nick Loftin | 1-3 | 3 | 0 | 1 | 0 | 0 | 1 | 1 | 15 | .232 | .319 | .376 |
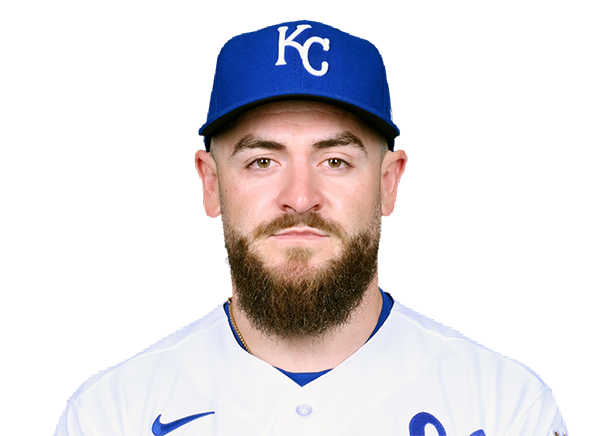 Kyle Isbel | 1-2 | 2 | 1 | 1 | 0 | 0 | 0 | 1 | 8 | .221 | .267 | .326 |
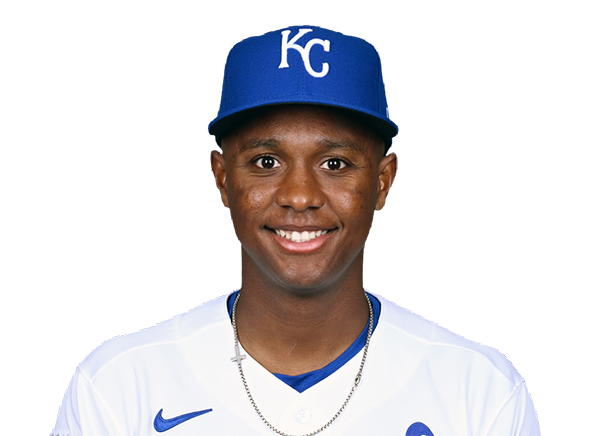 Tyler Tolbert | 0-1 | 1 | 0 | 0 | 0 | 0 | 0 | 1 | 6 | .293 | .358 | .407 |
Pittsburgh Pirates
| Player | H-AB | AB | R | H | RBI | HR | BB | K | #P | AVG | OBP | SLG |
|---|---|---|---|---|---|---|---|---|---|---|---|---|
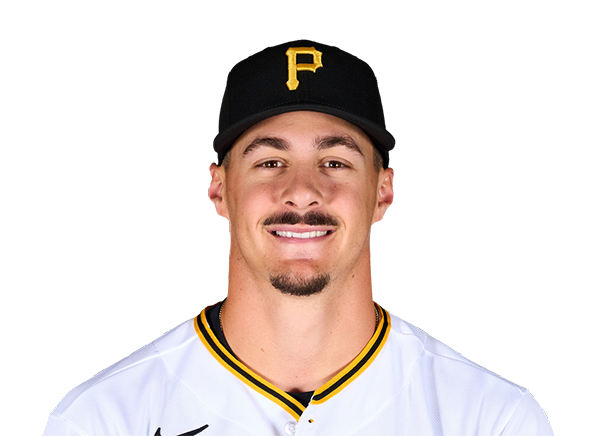 Konnor Griffin | 4-5 | 5 | 1 | 4 | 2 | 0 | 0 | 0 | 18 | .271 | .325 | .393 |
 Brandon Lowe | 1-5 | 5 | 1 | 1 | 2 | 1 | 0 | 2 | 19 | .260 | .331 | .488 |
 Bryan Reynolds | 2-5 | 5 | 0 | 2 | 0 | 0 | 0 | 1 | 17 | .263 | .366 | .427 |
 Oneil Cruz | 3-5 | 5 | 2 | 3 | 0 | 0 | 0 | 1 | 21 | .277 | .364 | .483 |
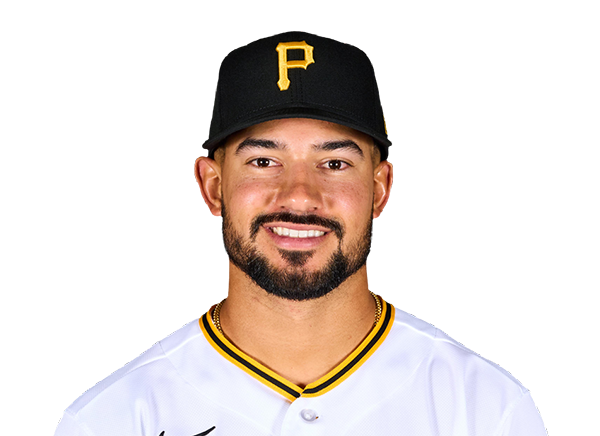 Nick Gonzales | 1-3 | 3 | 1 | 1 | 0 | 0 | 0 | 0 | 8 | .304 | .368 | .391 |
 Jared Triolo | 0-1 | 1 | 0 | 0 | 0 | 0 | 0 | 0 | 3 | .241 | .311 | .307 |
 Ryan O'Hearn | 0-3 | 3 | 0 | 0 | 1 | 0 | 1 | 1 | 19 | .266 | .333 | .449 |
 Ronny Simon | 1-4 | 4 | 1 | 1 | 0 | 0 | 0 | 1 | 17 | .318 | .362 | .386 |
 Billy Cook | 0-0 | 0 | 0 | 0 | 0 | 0 | 0 | 0 | 0 | .176 | .208 | .235 |
 Spencer Horwitz | 2-3 | 3 | 2 | 2 | 2 | 0 | 1 | 0 | 13 | .248 | .347 | .368 |
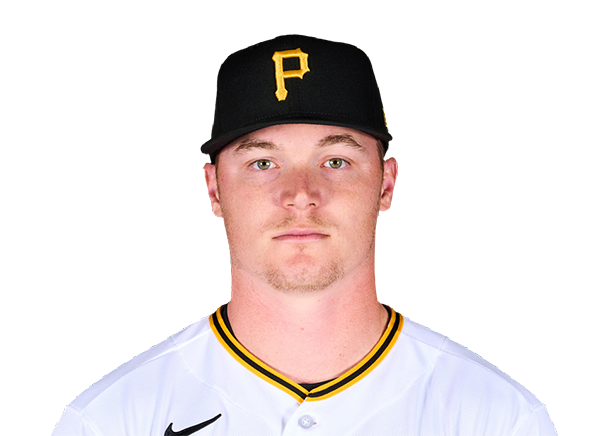 Henry Davis | 1-3 | 3 | 0 | 1 | 1 | 0 | 1 | 1 | 20 | .169 | .272 | .313 |
Kansas City Royals
| Player | IP | H | R | ER | BB | K | HR | PC-ST | ERA | PC |
|---|---|---|---|---|---|---|---|---|---|---|
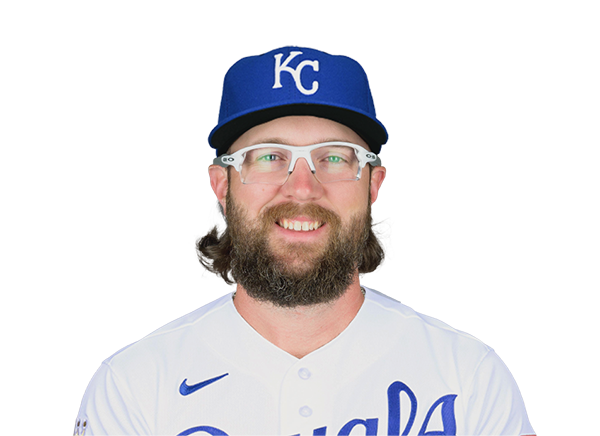 Randy Dobnak | 3.2 | 7 | 4 | 4 | 2 | 1 | 1 | 74-46 | 3.08 | 74 |
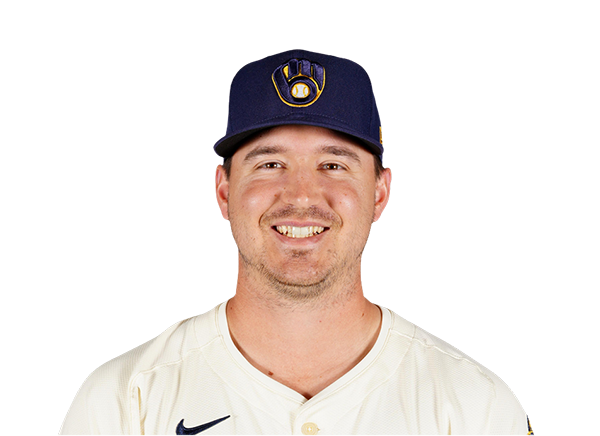 Connor Thomas | 1.1 | 2 | 1 | 1 | 0 | 2 | 0 | 19-16 | 9.15 | 19 |
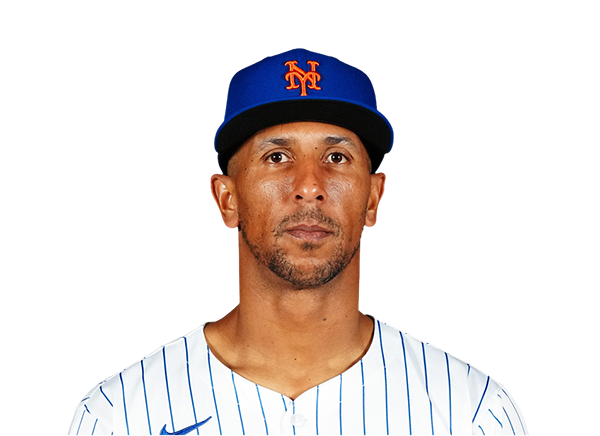 Anthony Gose | 1.0 | 2 | 0 | 0 | 0 | 2 | 0 | 22-15 | 0.00 | 22 |
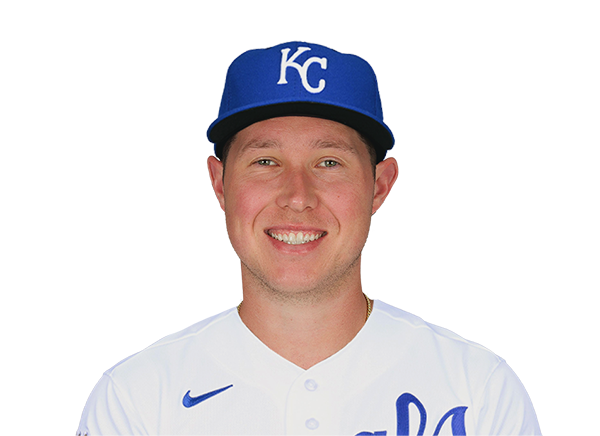 Nate Pearson | 1.0 | 3 | 3 | 3 | 1 | 2 | 0 | 28-14 | 3.07 | 28 |
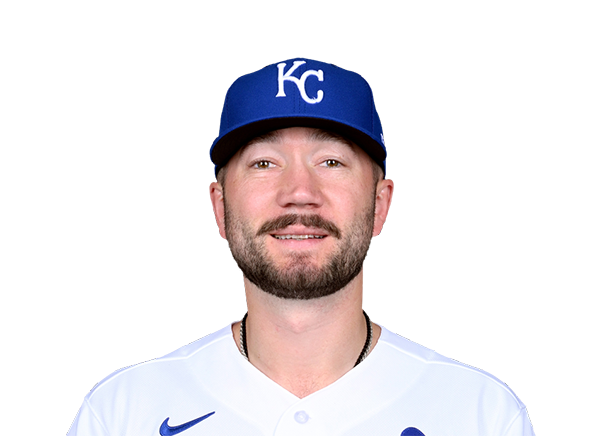 Lucas Erceg | 1.0 | 1 | 0 | 0 | 0 | 0 | 0 | 12-8 | 5.96 | 12 |
Pittsburgh Pirates
| Player | IP | H | R | ER | BB | K | HR | PC-ST | ERA | PC |
|---|---|---|---|---|---|---|---|---|---|---|
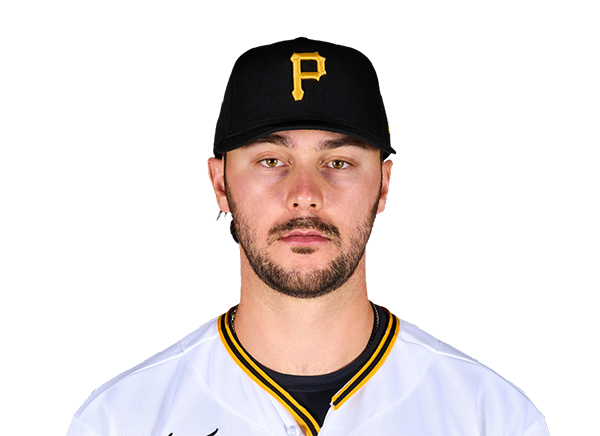 Paul Skenes | 6.0 | 6 | 5 | 5 | 1 | 7 | 2 | 89-63 | 3.91 | 89 |
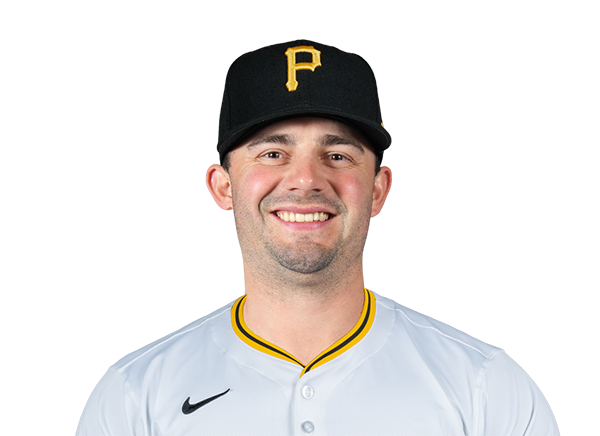 Brandon Eisert | 0.2 | 1 | 0 | 0 | 1 | 1 | 0 | 14-7 | 5.23 | 14 |
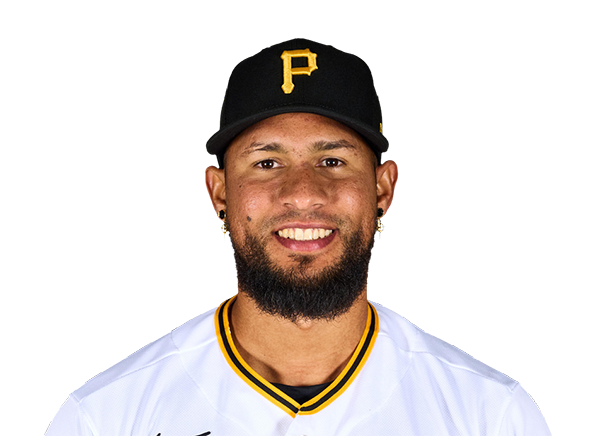 Yohan Ramirez | 1.1 | 0 | 0 | 0 | 0 | 1 | 0 | 20-16 | 3.00 | 20 |
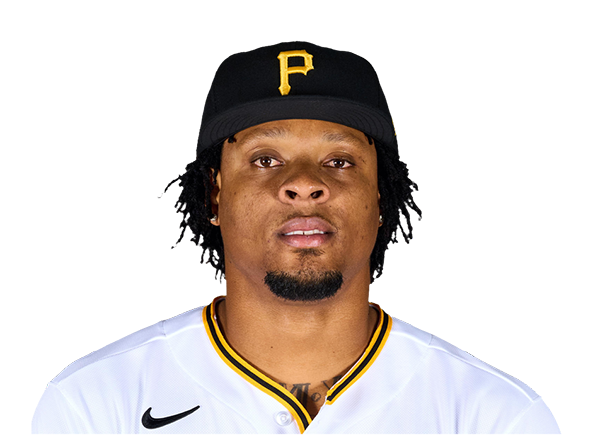 Gregory Soto | 1.0 | 1 | 0 | 0 | 0 | 2 | 0 | 18-13 | 3.78 | 18 |
H2H / Season Series
PIT8–5
KC
Last 5 Games
| Date | Opponent | Result |
|---|---|---|
| Sep 18 | @ PIT | L5–8 |
| Sep 17 |  @ HOU | L2–6 |
| Sep 16 | @ HOU | W5–2 |
| Sep 15 | @ HOU | L2–4 |
| Sep 13 |  @ BOS | L1–4 |
| Date | Opponent | Result |
|---|---|---|
| Sep 18 | vs KC | W8–5 |
| Sep 17 |  vs MIL | W7–4 |
| Sep 16 | vs MIL | L4–5 |
| Sep 15 | vs MIL | L1–5 |
| Sep 13 |  @ CHC | W4–3 |
Standings
American League
| Team | W | L | PCT | GB | DIFF | STRK |
|---|---|---|---|---|---|---|
1 Rays | 93 | 60 | .608 | - | +78 | L1 |
2 Guardians | 79 | 75 | .513 | 14.5 | -5 | W3 |
| 3Astros | 77 | 77 | .500 | 16.5 | -54 | L1 |
4 Yankees | 89 | 64 | .582 | 4 | +143 | W1 |
| 5Red Sox | 84 | 70 | .545 | 9.5 | +85 | W2 |
6 White Sox | 78 | 76 | .506 | 15.5 | +33 | L1 |
7 Rangers | 77 | 77 | .500 | 16.5 | -33 | W1 |
8 Blue Jays | 76 | 78 | .494 | 17.5 | -43 | L1 |
9 Orioles | 75 | 79 | .487 | 18.5 | -27 | L1 |
10 Tigers | 73 | 81 | .474 | 20.5 | +77 | W1 |
11 Mariners | 72 | 82 | .468 | 21.5 | -55 | W2 |
12 Twins | 72 | 82 | .468 | 21.5 | -71 | W1 |
| 13Royals | 67 | 87 | .435 | 26.5 | -100 | L2 |
14 Athletics | 61 | 93 | .396 | 32.5 | -216 | L4 |
15 Angels | 59 | 95 | .383 | 34.5 | -80 | L1 |
National League
| Team | W | L | PCT | GB | DIFF | STRK |
|---|---|---|---|---|---|---|
| 1Brewers | 96 | 58 | .623 | - | +198 | W1 |
2 Dodgers | 94 | 60 | .610 | 2 | +185 | W2 |
3 Braves | 90 | 64 | .584 | 6 | +115 | W1 |
4 Phillies | 85 | 69 | .552 | 11 | +31 | L1 |
| 5Cubs | 85 | 69 | .552 | 11 | +141 | L1 |
6 Padres | 85 | 69 | .552 | 11 | +36 | W3 |
7 Diamondbacks | 80 | 74 | .519 | 16 | -7 | L3 |
| 8Pirates | 77 | 77 | .500 | 19 | +27 | W2 |
9 Marlins | 76 | 78 | .494 | 20 | +2 | L1 |
10 Cardinals | 75 | 79 | .487 | 21 | -22 | L3 |
11 Nationals | 72 | 82 | .468 | 24 | +11 | W1 |
12 Reds | 72 | 82 | .468 | 24 | -152 | W1 |
13 Mets | 70 | 84 | .455 | 26 | -43 | W1 |
14 Giants | 64 | 90 | .416 | 32 | -76 | L1 |
15 Rockies | 56 | 98 | .364 | 40 | -178 | L3 |
KC
VS
PIT
Pitchers
Randy Dobnak
Catchers
Carter Jensen
Infielders
Bobby Witt Jr.
Vinnie Pasquantino
Maikel Garcia
Michael Massey
Outfielders
John Rave
Nick Loftin
Kyle Isbel
Designated Hitters
Salvador Perez
Pitchers
Paul Skenes
Catchers
Henry Davis
Infielders
Konnor Griffin
Brandon Lowe
Nick Gonzales
Spencer Horwitz
Outfielders
Bryan Reynolds
Oneil Cruz
Ronny Simon
Designated Hitters
Ryan O'Hearn
Royals
VS
Pirates
Batting
154
Team Games Played
154
5157
At Bats
5294
1259
Hits
1346
616
Runs Batted In
705
160
Home Runs
176
123
Stolen Bases
127
.244
Batting Average
.254
648
Runs
738
275
Doubles
234
19
Triples
15
2052
Total Bases
2138
494
Walks
544
1209
Strikeouts
1436
.314
On Base Percentage
.331
.398
Slugging Percentage
.404
.712
OBP Pct + SLG Pct
.735
154
Games Played
154
154
Games Started
154
54
Hit By Pitch
83
0.0
Wins Above Replacement
0.0
0.0
Offensive Wins Above Replacement
0.0
32
Caught Stealing
27
1
Is Qualified
1
662.4
Runs Created
722.9
4.4
Runs Created Per 27 Outs
4.7
.086
Walks Per Plate Appearance
.091
0.41
Walk To Strikeout Ratio
0.38
.154
Isolated Power
.150
.267
Secondary Average
.271
3.80
Pitches Per Plate Appearance
3.91
454
Extra Base Hits
425
5777
Plate Appearances
5969
32.2
At Bats Per Home Run
30.1
26
Sacrifice Hit
12
44
Sacrifice Flies
32
Pitching
154
Team Games Played
154
61
Quality Starts
45
67
Wins
77
87
Losses
77
36
Saves
36
79
Holds
73
1341
Hits
1230
700
Earned runs
640
191
Home Runs
148
544
Walks
560
1114
Strikeouts
1409
7.4
Strikeouts Per 9 Innings
9.2
146.6
Pitches Per Start
149.8
1.39
Walks Plus Hits Per Inning Pitched
1.30
4.65
Earned Run Average
4.19
87
Losses
77
1354.1
Innings pitched
1374.1
.435
Win Percentage
.500
60
Save Opportunities
60
.259
Opponent Batting Average
.237
.335
Opponent's On-base pct.
.319
.432
Opponent's Slugging pct.
.382
.768
Opponent's OPB Pct + SLG Pct
.701
5172
At Bats
5188
278
Doubles
278
22
Triples
15
65
Batters Hit
84
71
Stolen Bases
94
154
Games Played
154
2
Complete Games
1
8
Shutouts
11
51
Wild Pitches
51
715
Runs Batted In
668
3
Balks
6
1354.1
Innings pitched
1374.1
7.4
Strikeouts Per 9 Innings
9.2
34
Caught Stealing
31
154
Games Started
154
0.0
Wins Above Replacement
0.0
1
Is Qualified
1
748
Runs
711
700
Earned Runs
640
2236
Total Bases
1982
Fielding
154
Team Games Played
154
1354
Full Innings
1374
5530
Total Chances
5438
4063
Putouts
4123
1398
Assists
1222
69
Errors
93
275
Double Plays
234
0.988
Fielding Percentage
0.983
36.3
Range Factor
35.0
0.0
Zone Rating
0.0
154
Games Played
154
0
Games Started
0
0.0
Defensive Wins Above Replacement
0.0
1
Qualified
1