

Royals vs White Sox Live Score (12 May, 2026)
Game Information
Stage
Standard
Season
2026
First Pitch
Tue, May 12, 7:40 pm
Venue
Rate Field
Location
Chicago, Illinois
Attendance
13,256
Live Situation
1Balls
2Strikes
0Outs
—Pitcher
—At Bat
Pitch Sequence
1
STRIKE LOOKING
Four-seam FB
93 MPH
2
STRIKE FOUL
Four-seam FB
94 MPH
3
BALL
Sweeper
83 MPH
4
BALL IN PLAY
Four-seam FB
94 MPH
Injury Report
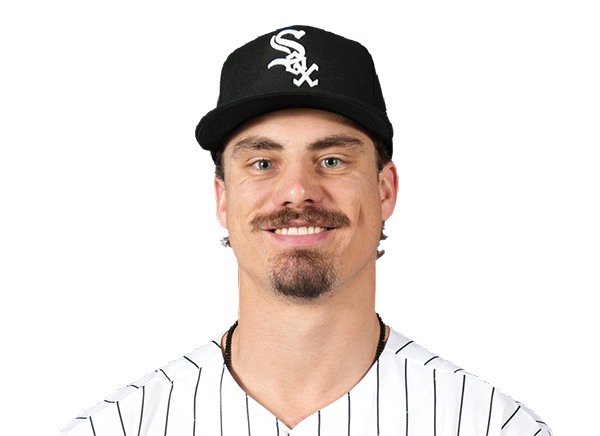

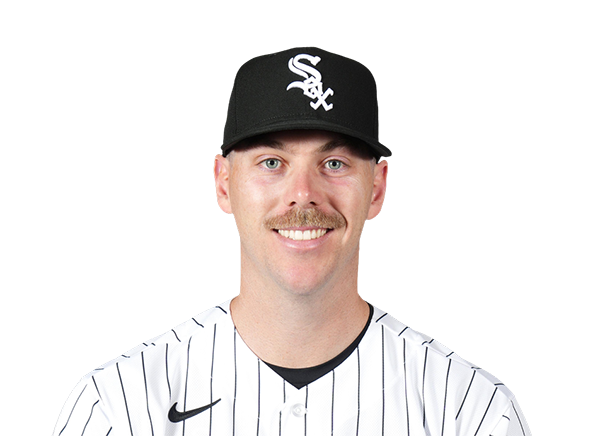
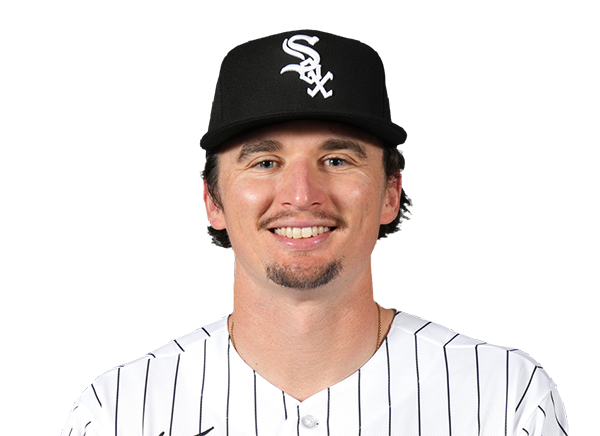
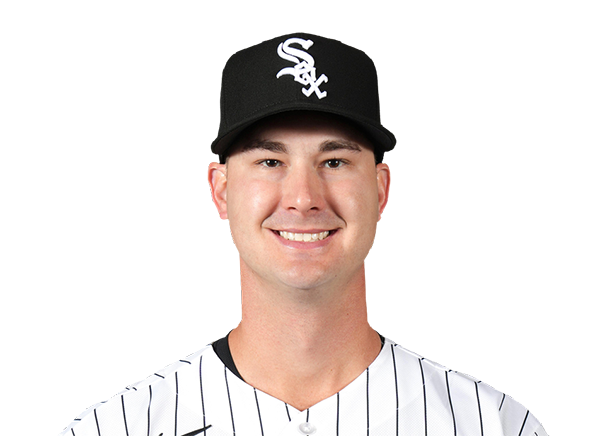
Team Stats
 KC
CHW


5
Runs
6
11
Hits
7
1
Errors
0
2
Home Runs
3
2
Walks
4
5
Strikeouts
11
Player Box Score
Kansas City Royals
| Player | H-AB | AB | R | H | RBI | HR | BB | K | #P | AVG | OBP | SLG |
|---|---|---|---|---|---|---|---|---|---|---|---|---|
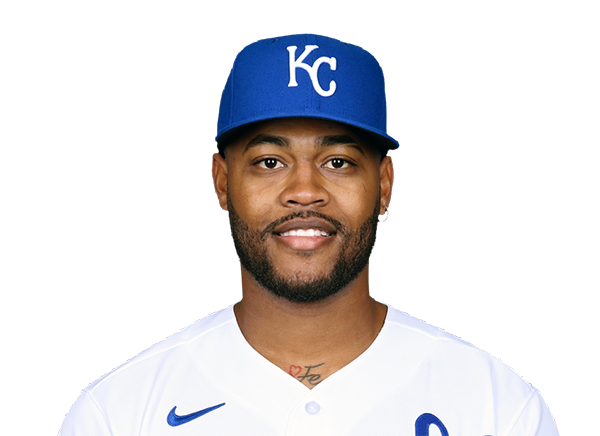 Maikel Garcia | 1-5 | 5 | 0 | 1 | 1 | 0 | 0 | 0 | 14 | .282 | .349 | .429 |
 Bobby Witt Jr. | 2-5 | 5 | 1 | 2 | 1 | 1 | 0 | 1 | 15 | .305 | .372 | .491 |
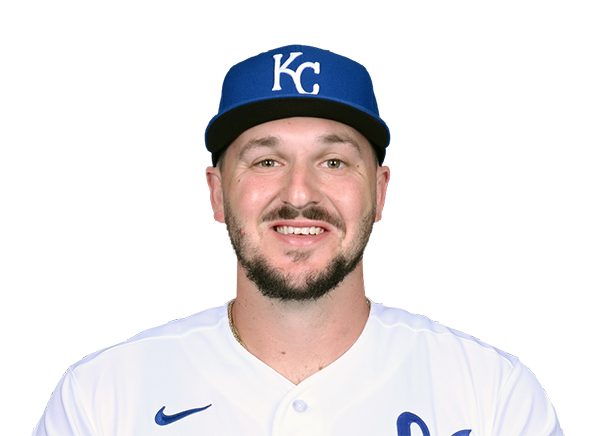 Vinnie Pasquantino | 2-4 | 4 | 0 | 2 | 0 | 0 | 1 | 0 | 20 | .208 | .291 | .362 |
 Salvador Perez | 2-5 | 5 | 1 | 2 | 1 | 1 | 0 | 0 | 17 | .197 | .238 | .344 |
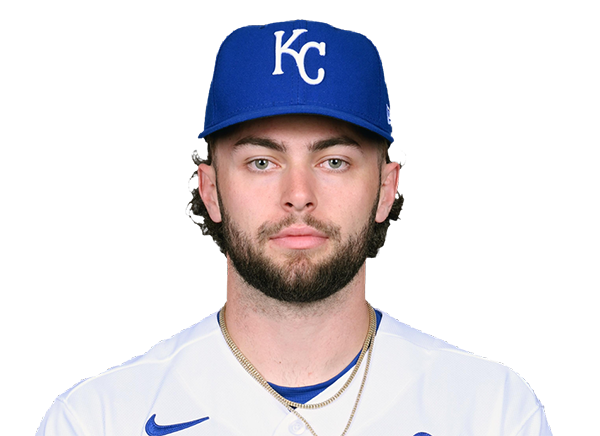 Carter Jensen | 1-3 | 3 | 1 | 1 | 0 | 0 | 1 | 2 | 20 | .221 | .317 | .393 |
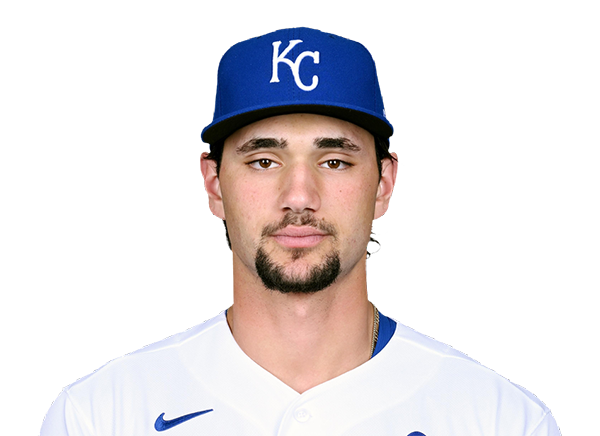 Jac Caglianone | 0-4 | 4 | 0 | 0 | 0 | 0 | 0 | 1 | 17 | .238 | .309 | .405 |
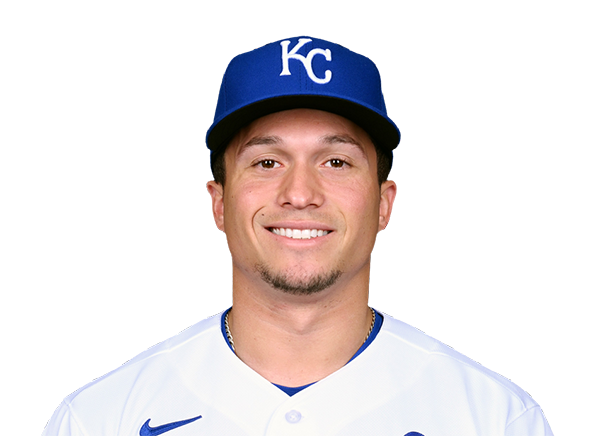 Isaac Collins | 1-4 | 4 | 1 | 1 | 0 | 0 | 0 | 1 | 15 | .241 | .348 | .366 |
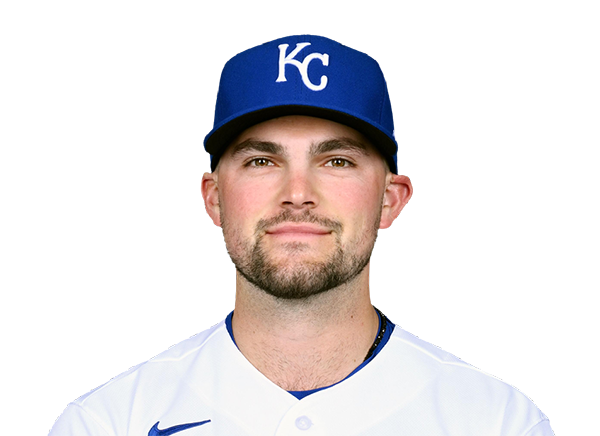 Michael Massey | 0-2 | 2 | 0 | 0 | 0 | 0 | 0 | 0 | 10 | .224 | .247 | .434 |
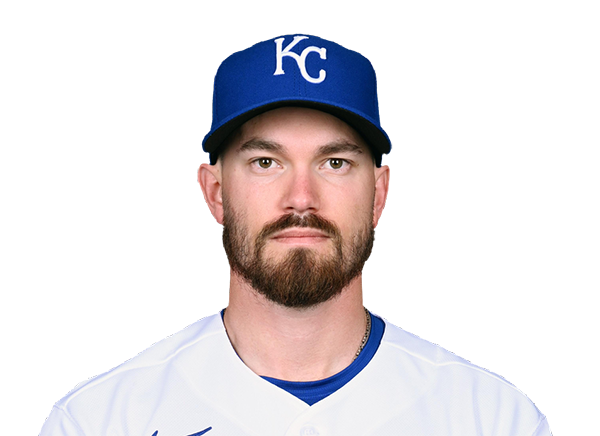 Nick Loftin | 1-2 | 2 | 1 | 1 | 2 | 0 | 0 | 0 | 9 | .279 | .385 | .419 |
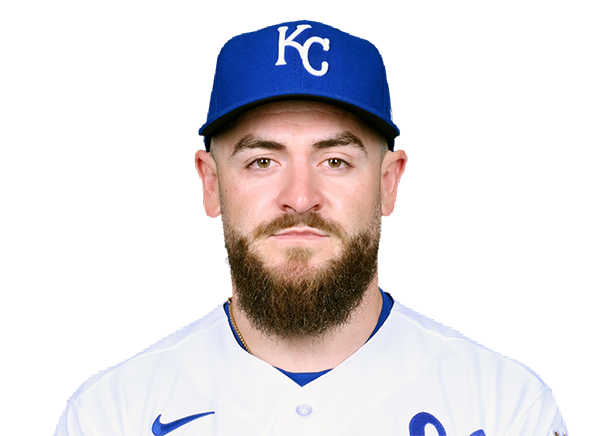 Kyle Isbel | 1-4 | 4 | 0 | 1 | 0 | 0 | 0 | 0 | 9 | .267 | .327 | .396 |
Chicago White Sox
| Player | H-AB | AB | R | H | RBI | HR | BB | K | #P | AVG | OBP | SLG |
|---|---|---|---|---|---|---|---|---|---|---|---|---|
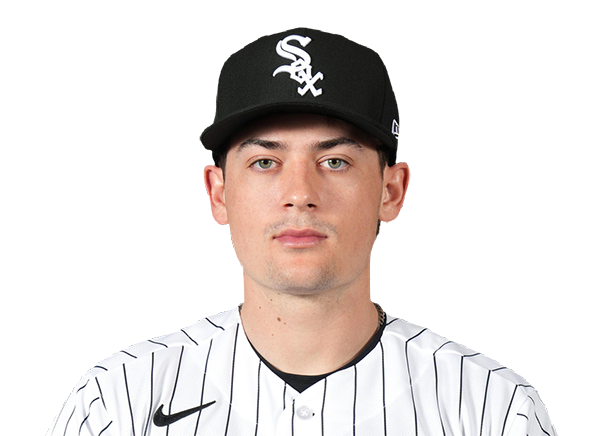 Sam Antonacci | 2-4 | 4 | 1 | 2 | 0 | 0 | 0 | 0 | 18 | .280 | .382 | .413 |
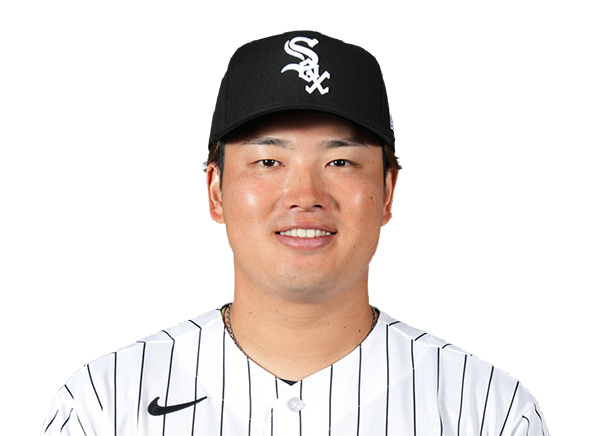 Munetaka Murakami | 0-3 | 3 | 0 | 0 | 0 | 0 | 1 | 3 | 22 | .228 | .362 | .545 |
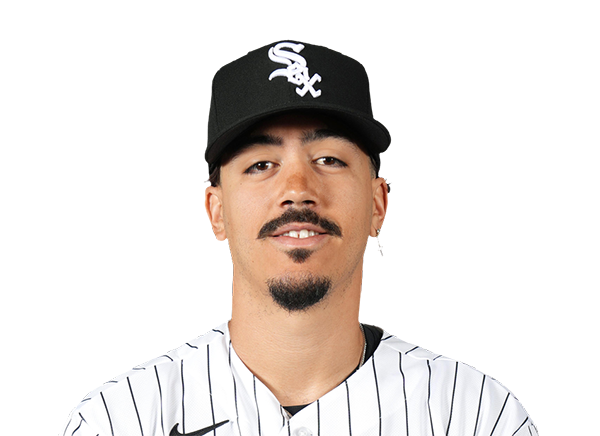 Miguel Vargas | 2-3 | 3 | 1 | 2 | 1 | 0 | 1 | 0 | 11 | .239 | .375 | .479 |
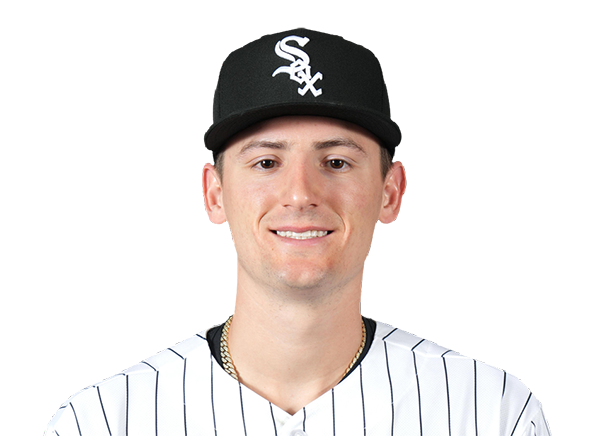 Colson Montgomery | 0-3 | 3 | 1 | 0 | 0 | 0 | 1 | 1 | 16 | .216 | .322 | .473 |
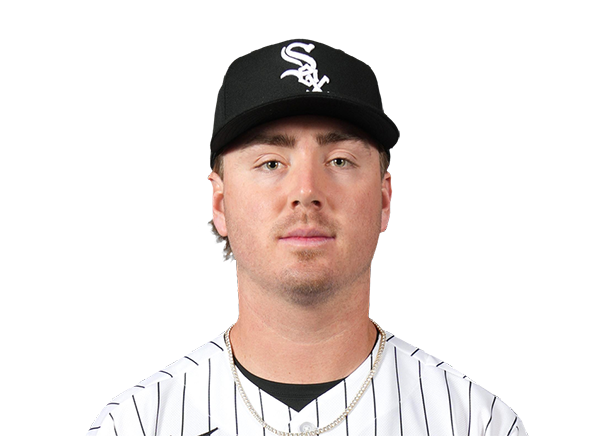 Chase Meidroth | 1-4 | 4 | 1 | 1 | 3 | 1 | 0 | 2 | 18 | .277 | .345 | .399 |
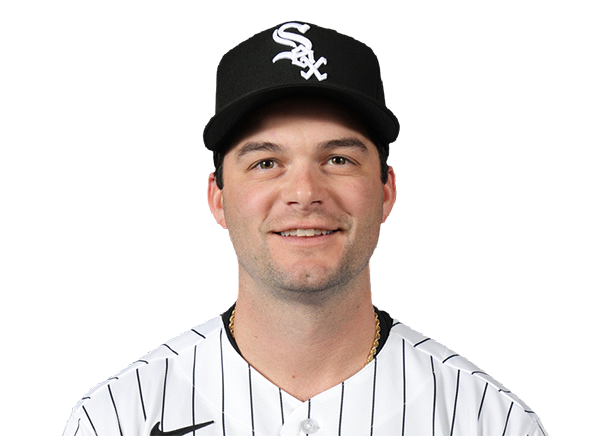 Andrew Benintendi | 0-2 | 2 | 0 | 0 | 0 | 0 | 1 | 0 | 13 | .231 | .273 | .359 |
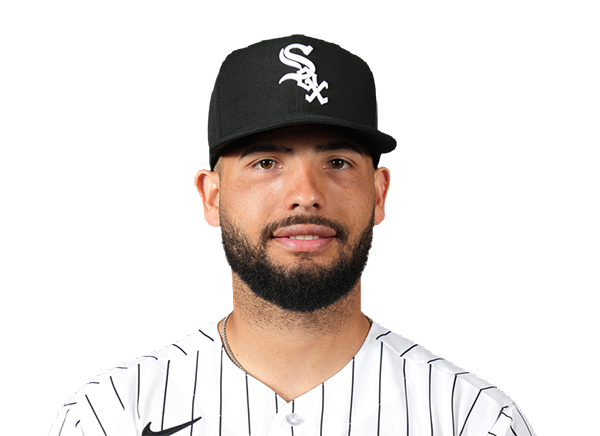 Edgar Quero | 0-1 | 1 | 0 | 0 | 0 | 0 | 0 | 0 | 2 | .159 | .258 | .171 |
 Jarred Kelenic | 0-3 | 3 | 0 | 0 | 0 | 0 | 0 | 2 | 13 | .231 | .333 | .231 |
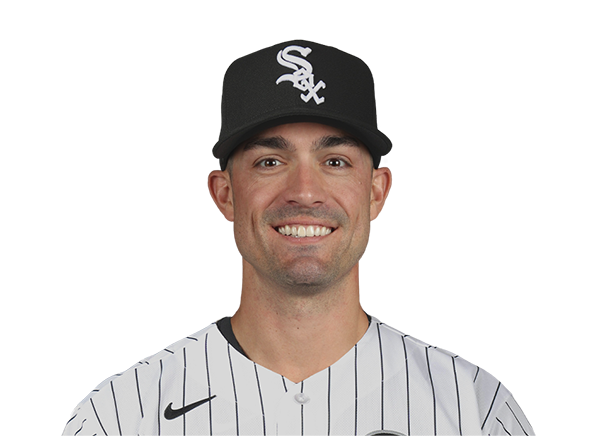 Randal Grichuk | 0-1 | 1 | 0 | 0 | 0 | 0 | 0 | 0 | 6 | .231 | .286 | .692 |
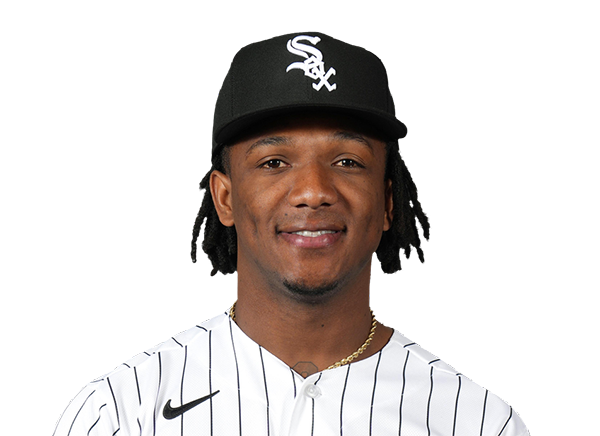 Luisangel Acuna | 0-0 | 0 | 0 | 0 | 0 | 0 | 0 | 0 | 0 | .175 | .239 | .188 |
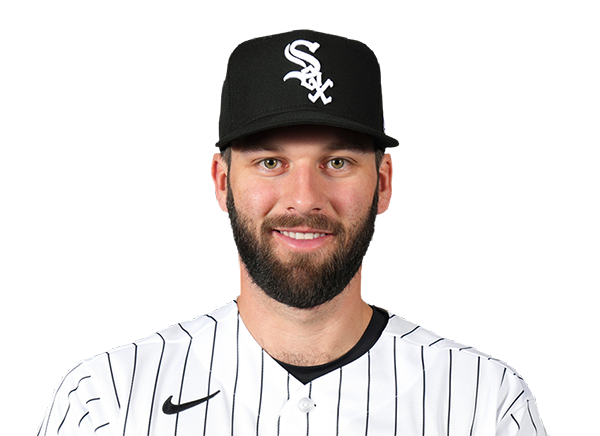 Tristan Peters | 0-3 | 3 | 0 | 0 | 0 | 0 | 0 | 0 | 10 | .261 | .320 | .315 |
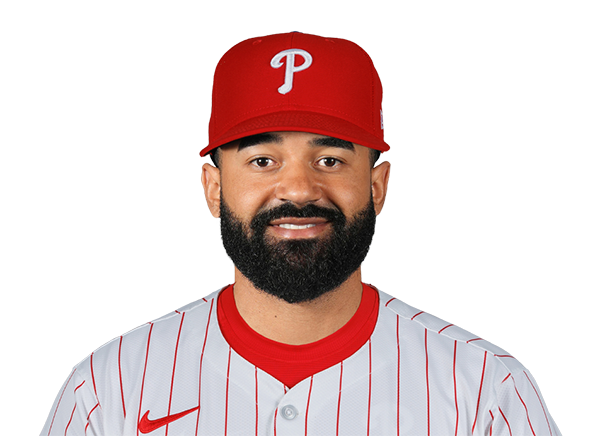 Derek Hill | 1-1 | 1 | 1 | 1 | 1 | 1 | 0 | 0 | 3 | .250 | .327 | .455 |
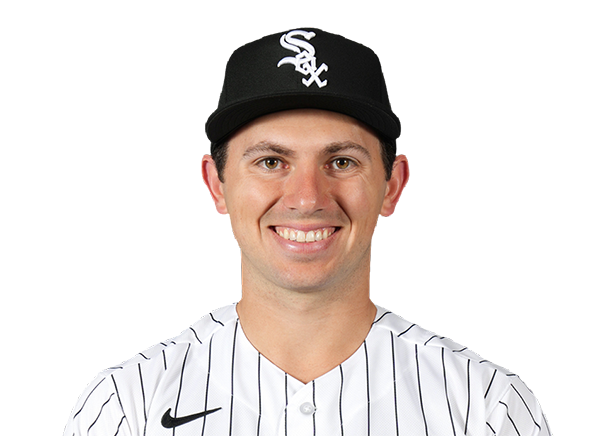 Drew Romo | 1-4 | 4 | 1 | 1 | 1 | 1 | 0 | 3 | 16 | .185 | .389 | .667 |
Kansas City Royals
| Player | IP | H | R | ER | BB | K | HR | PC-ST | ERA | PC |
|---|---|---|---|---|---|---|---|---|---|---|
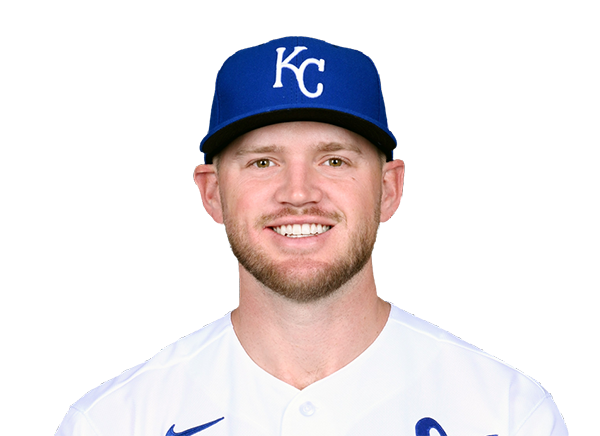 Stephen Kolek | 4.2 | 5 | 5 | 5 | 3 | 6 | 2 | 94-53 | 6.75 | 94 |
 Luinder Avila | 1.1 | 0 | 0 | 0 | 1 | 2 | 0 | 27-14 | 6.08 | 27 |
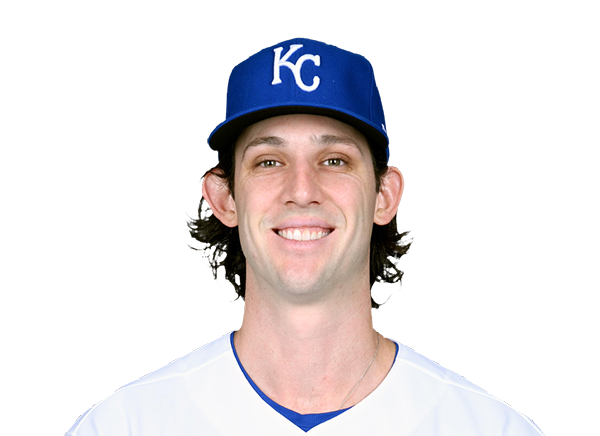 Daniel Lynch IV | 1.0 | 1 | 0 | 0 | 0 | 2 | 0 | 13-11 | 2.08 | 13 |
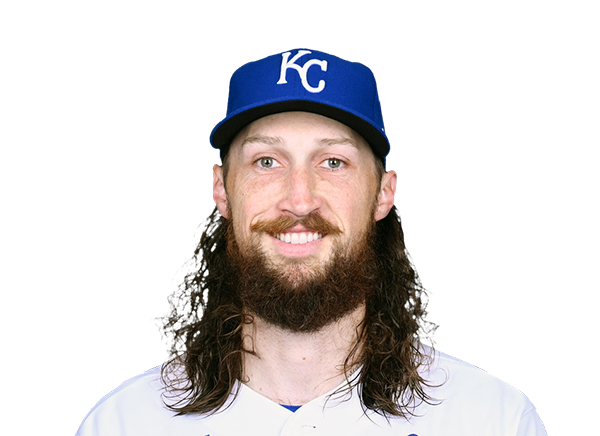 Matt Strahm | 1.0 | 1 | 1 | 1 | 0 | 1 | 1 | 14-9 | 4.02 | 14 |
Chicago White Sox
| Player | IP | H | R | ER | BB | K | HR | PC-ST | ERA | PC |
|---|---|---|---|---|---|---|---|---|---|---|
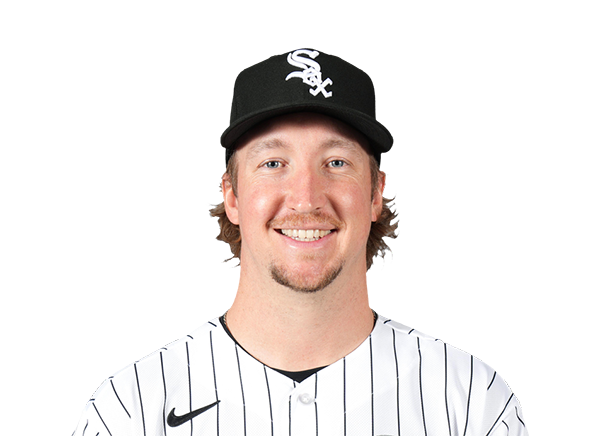 Erick Fedde | 5.0 | 6 | 2 | 2 | 1 | 2 | 2 | 80-49 | 3.77 | 80 |
 Tyler Schweitzer | 0.1 | 2 | 3 | 3 | 1 | 0 | 0 | 21-11 | 13.50 | 21 |
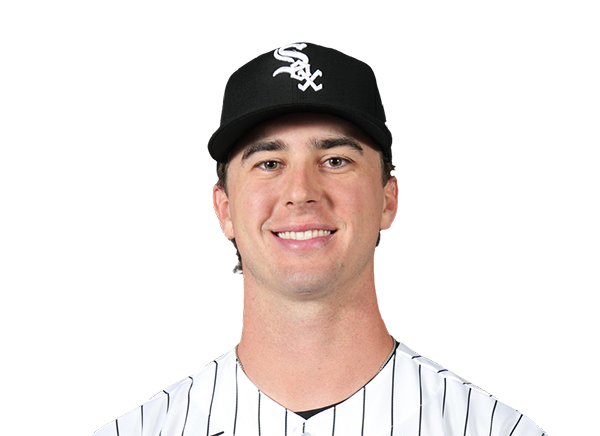 Grant Taylor | 1.2 | 3 | 0 | 0 | 0 | 3 | 0 | 28-19 | 2.11 | 28 |
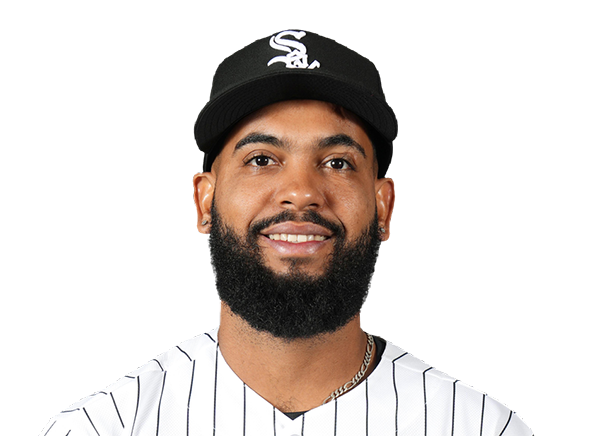 Seranthony Dominguez | 1.0 | 0 | 0 | 0 | 0 | 0 | 0 | 10-7 | 3.24 | 10 |
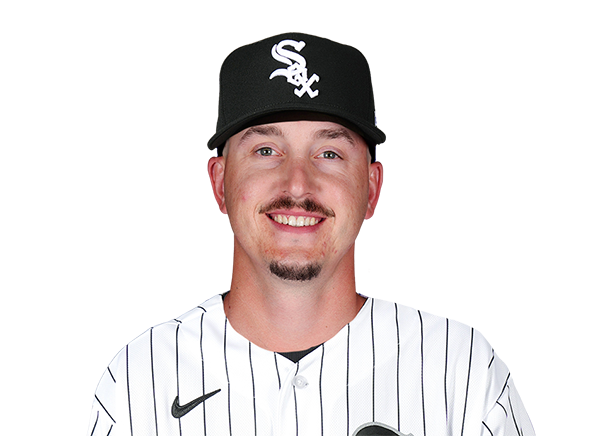 Bryan Hudson | 1.0 | 0 | 0 | 0 | 0 | 0 | 0 | 7-6 | 0.90 | 7 |
H2H / Season Series
CHW4–5
KC
CHW2–1
KC
CHW22–1
KC
CHW6–2
KC
CHW6–5
KC
CHW6–5
KC
KC5–6
CHW
KC2–0
CHW
KC2–0
CHW
KC0–2
CHW
Last 5 Games
| Date | Opponent | Result |
|---|---|---|
| Aug 21 |  vs DET | W5–2 |
| Aug 20 |  vs ATH | W6–2 |
| Aug 19 | vs ATH | W9–7 |
| Aug 18 | vs ATH | W4–3 |
| Aug 17 | vs ATH | W9–5 |
| Date | Opponent | Result |
|---|---|---|
| Aug 21 |  vs NYM | W6–4 |
| Aug 20 |  vs ATL | L0–2 |
| Aug 19 |  @ CHC | W3–0 |
| Aug 18 | @ CHC | L3–4 |
| Aug 17 | @ CHC | L5–7 |
Standings
American League
| Team | W | L | PCT | GB | DIFF | STRK |
|---|---|---|---|---|---|---|
1 Rays | 76 | 52 | .594 | - | +43 | L2 |
| 2White Sox | 67 | 61 | .523 | 9 | +47 | W1 |
3 Astros | 65 | 64 | .504 | 11.5 | -42 | W1 |
4 Yankees | 73 | 56 | .566 | 3.5 | +95 | L1 |
5 Red Sox | 69 | 59 | .539 | 7 | +97 | W1 |
6 Rangers | 64 | 65 | .496 | 12.5 | -45 | W2 |
7 Blue Jays | 64 | 67 | .489 | 13.5 | -50 | W1 |
8 Twins | 63 | 66 | .488 | 13.5 | -45 | L1 |
9 Guardians | 63 | 66 | .488 | 13.5 | -15 | W2 |
10 Orioles | 62 | 67 | .481 | 14.5 | -34 | W1 |
| 11Tigers | 61 | 67 | .477 | 15 | +79 | L3 |
12 Mariners | 61 | 68 | .473 | 15.5 | -45 | W1 |
| 13Royals | 56 | 74 | .431 | 21 | -97 | W6 |
14 Angels | 51 | 78 | .395 | 25.5 | -71 | L1 |
| 15Athletics | 49 | 80 | .380 | 27.5 | -189 | L5 |
National League
| Team | W | L | PCT | GB | DIFF | STRK |
|---|---|---|---|---|---|---|
1 Brewers | 81 | 49 | .623 | - | +163 | W3 |
2 Dodgers | 78 | 51 | .605 | 2.5 | +146 | W4 |
| 3Braves | 75 | 55 | .577 | 6 | +108 | L2 |
| 4Cubs | 74 | 55 | .574 | 6.5 | +99 | L2 |
5 Phillies | 71 | 58 | .550 | 9.5 | +16 | W7 |
6 Padres | 69 | 60 | .535 | 11.5 | +7 | W1 |
7 Diamondbacks | 68 | 61 | .527 | 12.5 | +13 | W2 |
8 Cardinals | 66 | 64 | .508 | 15 | +9 | L1 |
9 Marlins | 65 | 64 | .504 | 15.5 | +15 | W1 |
10 Pirates | 63 | 67 | .485 | 18 | +30 | L1 |
11 Reds | 61 | 68 | .473 | 19.5 | -98 | L2 |
12 Nationals | 61 | 69 | .469 | 20 | +16 | L2 |
| 13Mets | 58 | 71 | .450 | 22.5 | -44 | L1 |
14 Giants | 52 | 76 | .406 | 28 | -78 | L2 |
15 Rockies | 50 | 78 | .391 | 30 | -130 | L4 |
KC
VS
CHW
Pitchers
Stephen Kolek
Luinder Avila
Daniel Lynch IV
Matt Strahm
Catchers
Salvador Perez
Infielders
Maikel Garcia
Bobby Witt Jr.
Vinnie Pasquantino
Michael Massey
Nick Loftin
Outfielders
Jac Caglianone
Isaac Collins
Kyle Isbel
Designated Hitters
Carter Jensen
Pitchers
Erick Fedde
Tyler Schweitzer
Grant Taylor
Seranthony Dominguez
Bryan Hudson
Catchers
Drew Romo
Infielders
Munetaka Murakami
Miguel Vargas
Colson Montgomery
Chase Meidroth
Outfielders
Sam Antonacci
Jarred Kelenic
Luisangel Acuna
Tristan Peters
Derek Hill
Designated Hitters
Andrew Benintendi
Edgar Quero
Other Players
Randal Grichuk
Royals
VS
White Sox
Batting
130
Team Games Played
128
4351
At Bats
4306
1069
Hits
1022
521
Runs Batted In
584
132
Home Runs
171
98
Stolen Bases
70
.246
Batting Average
.237
546
Runs
611
232
Doubles
204
18
Triples
12
1733
Total Bases
1763
405
Walks
443
1018
Strikeouts
1164
.314
On Base Percentage
.317
.398
Slugging Percentage
.409
.712
OBP Pct + SLG Pct
.727
130
Games Played
128
130
Games Started
128
46
Hit By Pitch
74
0.0
Wins Above Replacement
0.0
0.0
Offensive Wins Above Replacement
0.0
28
Caught Stealing
32
1
Is Qualified
1
555.7
Runs Created
575.1
4.3
Runs Created Per 27 Outs
4.5
.083
Walks Per Plate Appearance
.091
0.40
Walk To Strikeout Ratio
0.38
.153
Isolated Power
.172
.262
Secondary Average
.284
3.81
Pitches Per Plate Appearance
3.86
382
Extra Base Hits
387
4867
Plate Appearances
4879
33.0
At Bats Per Home Run
25.2
22
Sacrifice Hit
25
41
Sacrifice Flies
29
Pitching
130
Team Games Played
128
52
Quality Starts
32
56
Wins
67
74
Losses
61
32
Saves
33
62
Holds
54
1127
Hits
1018
602
Earned runs
516
161
Home Runs
141
483
Walks
459
949
Strikeouts
1083
7.5
Strikeouts Per 9 Innings
8.5
147.3
Pitches Per Start
150.2
1.41
Walks Plus Hits Per Inning Pitched
1.29
4.74
Earned Run Average
4.06
74
Losses
61
1142.1
Innings pitched
1143.0
.431
Win Percentage
.523
55
Save Opportunities
58
.259
Opponent Batting Average
.238
.337
Opponent's On-base pct.
.320
.433
Opponent's Slugging pct.
.390
.770
Opponent's OPB Pct + SLG Pct
.710
4359
At Bats
4280
236
Doubles
191
20
Triples
19
48
Batters Hit
75
64
Stolen Bases
100
130
Games Played
128
2
Complete Games
0
7
Shutouts
9
46
Wild Pitches
55
612
Runs Batted In
542
2
Balks
8
1142.1
Innings pitched
1143.0
7.5
Strikeouts Per 9 Innings
8.5
33
Caught Stealing
33
130
Games Started
128
0.0
Wins Above Replacement
0.0
1
Is Qualified
1
643
Runs
564
602
Earned Runs
516
1886
Total Bases
1670
Fielding
130
Team Games Played
128
1142
Full Innings
1143
4666
Total Chances
4552
3427
Putouts
3429
1183
Assists
1054
56
Errors
69
232
Double Plays
204
0.988
Fielding Percentage
0.985
36.3
Range Factor
35.3
0.0
Zone Rating
0.0
130
Games Played
128
0
Games Started
0
0.0
Defensive Wins Above Replacement
0.0
1
Qualified
1