

Tigers vs Blue Jays Live Score (14 Sep, 2026)
Game Information
Stage
STD
Season
2026
First Pitch
Mon, Sep 14, 7:07 pm
Venue
Rogers Centre
Location
Toronto, Ontario
Venue Type
Indoor
Broadcast
MLB.TV
Attendance
42,867
Live Situation
1Balls
2Strikes
0Outs
—Pitcher
—At Bat
Pitch Sequence
1
BALL
Cutter
93 MPH
2
STRIKE FOUL
Cutter
94 MPH
3
STRIKE SWINGING
Slider
85 MPH
4
BALL IN PLAY
Slider
85 MPH
Injury Report







Team Stats
 DET
TOR


6
Runs
5
9
Hits
8
0
Errors
1
0
Home Runs
1
2
Walks
6
7
Strikeouts
7
Player Box Score
Detroit Tigers
| Player | H-AB | AB | R | H | RBI | HR | BB | K | #P | AVG | OBP | SLG |
|---|---|---|---|---|---|---|---|---|---|---|---|---|
 Kevin McGonigle | 2-5 | 5 | 1 | 2 | 0 | 0 | 0 | 0 | 17 | .273 | .373 | .425 |
 Gleyber Torres | 1-5 | 5 | 1 | 1 | 0 | 0 | 0 | 1 | 20 | .267 | .368 | .378 |
 John Peck | 0-0 | 0 | 0 | 0 | 0 | 0 | 0 | 0 | 0 | .235 | .357 | .265 |
 Riley Greene | 2-5 | 5 | 1 | 2 | 0 | 0 | 0 | 1 | 24 | .284 | .371 | .483 |
 Dillon Dingler | 1-4 | 4 | 1 | 1 | 1 | 0 | 0 | 2 | 14 | .244 | .304 | .455 |
 Brett Callahan | 1-4 | 4 | 0 | 1 | 1 | 0 | 0 | 0 | 13 | .231 | .281 | .385 |
 Max Clark | 1-4 | 4 | 1 | 1 | 2 | 0 | 0 | 0 | 11 | .273 | .353 | .446 |
 Spencer Torkelson | 1-3 | 3 | 0 | 1 | 1 | 0 | 1 | 2 | 16 | .223 | .315 | .414 |
 Zach McKinstry | 0-3 | 3 | 1 | 0 | 0 | 0 | 1 | 0 | 15 | .207 | .293 | .305 |
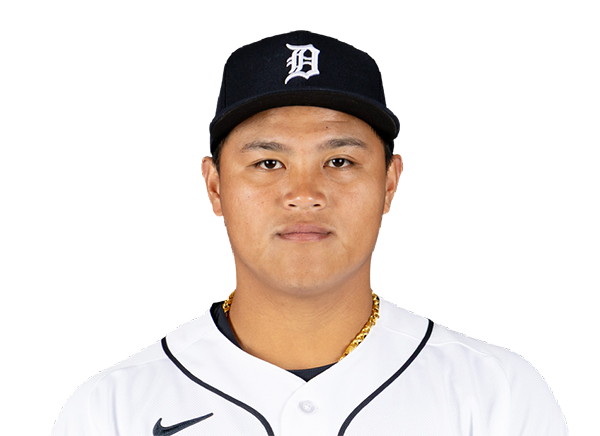 Hao-Yu Lee | 0-4 | 4 | 0 | 0 | 0 | 0 | 0 | 1 | 14 | .255 | .315 | .408 |
Toronto Blue Jays
| Player | H-AB | AB | R | H | RBI | HR | BB | K | #P | AVG | OBP | SLG |
|---|---|---|---|---|---|---|---|---|---|---|---|---|
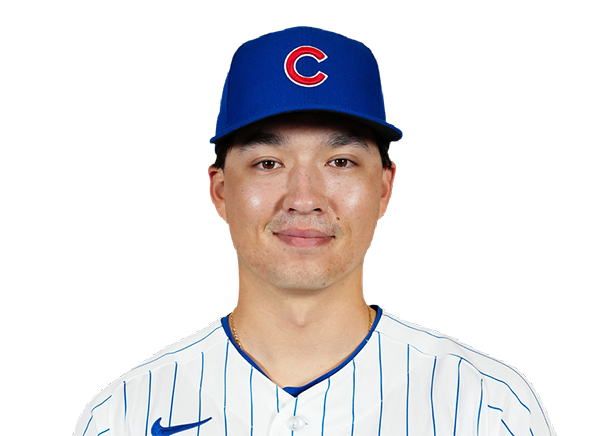 Brett Bateman | 1-5 | 5 | 1 | 1 | 0 | 0 | 0 | 1 | 16 | .323 | .395 | .423 |
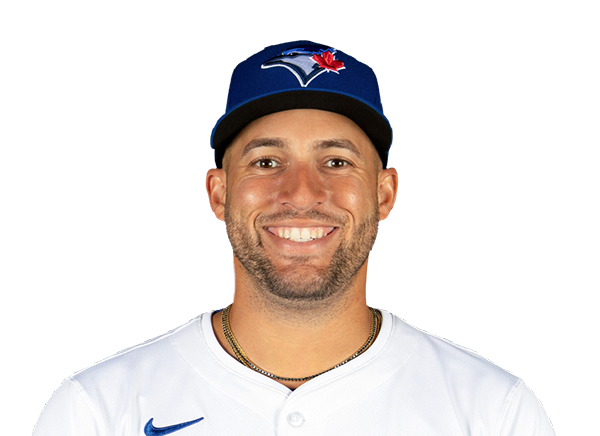 George Springer | 1-2 | 2 | 2 | 1 | 0 | 0 | 3 | 0 | 33 | .253 | .328 | .418 |
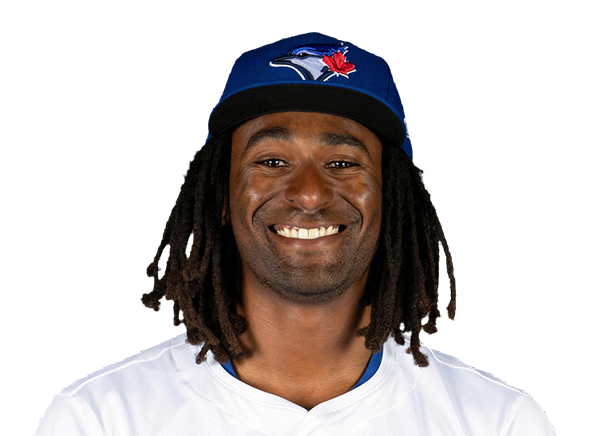 Charles McAdoo | 0-0 | 0 | 0 | 0 | 0 | 0 | 0 | 0 | 0 | .250 | .297 | .345 |
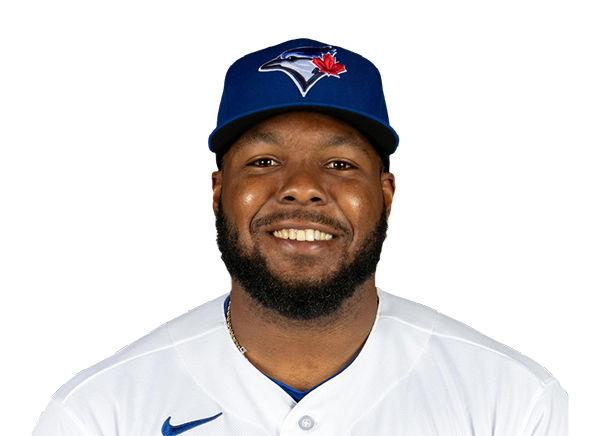 Vladimir Guerrero Jr. | 0-4 | 4 | 0 | 0 | 0 | 0 | 1 | 1 | 20 | .263 | .334 | .362 |
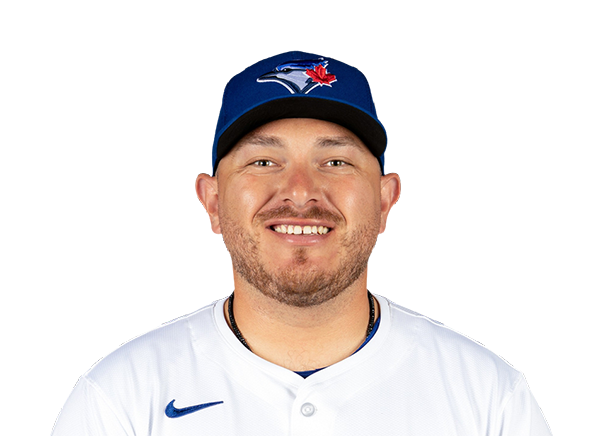 Alejandro Kirk | 2-4 | 4 | 1 | 2 | 1 | 0 | 1 | 0 | 27 | .280 | .353 | .428 |
 Nathan Lukes | 1-4 | 4 | 0 | 1 | 0 | 0 | 0 | 1 | 21 | .273 | .322 | .390 |
 Kazuma Okamoto | 1-4 | 4 | 1 | 1 | 3 | 1 | 0 | 1 | 15 | .236 | .311 | .468 |
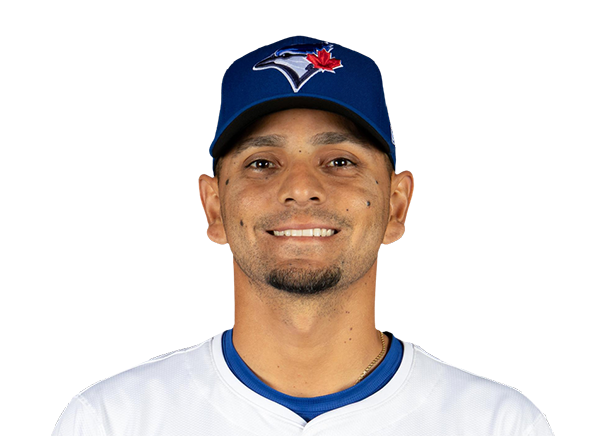 Andres Gimenez | 1-4 | 4 | 0 | 1 | 0 | 0 | 0 | 2 | 16 | .245 | .290 | .362 |
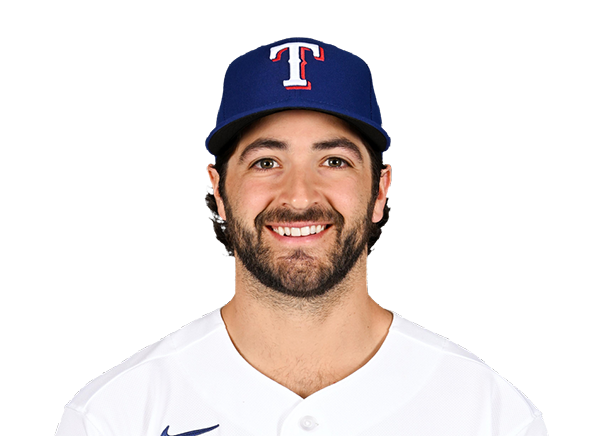 Josh Smith | 0-1 | 1 | 0 | 0 | 0 | 0 | 1 | 1 | 15 | .225 | .319 | .352 |
 Myles Straw | 0-2 | 2 | 0 | 0 | 0 | 0 | 0 | 0 | 12 | .231 | .299 | .340 |
 Ernie Clement | 1-4 | 4 | 0 | 1 | 0 | 0 | 0 | 0 | 8 | .271 | .297 | .379 |
Detroit Tigers
| Player | IP | H | R | ER | BB | K | HR | PC-ST | ERA | PC |
|---|---|---|---|---|---|---|---|---|---|---|
 Troy Melton | 2.2 | 5 | 2 | 2 | 4 | 3 | 0 | 76-45 | 2.52 | 76 |
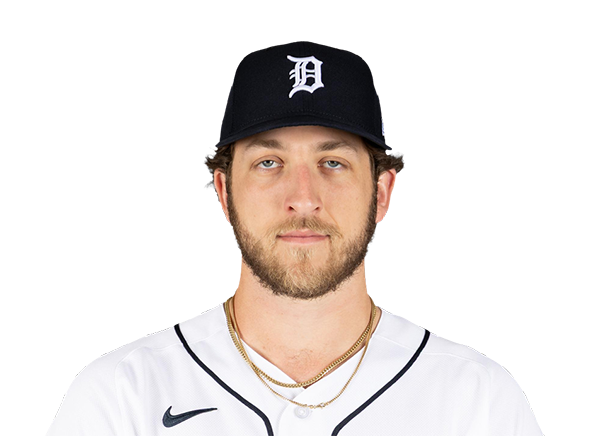 Beau Brieske | 2.0 | 0 | 0 | 0 | 1 | 2 | 0 | 40-26 | 4.91 | 40 |
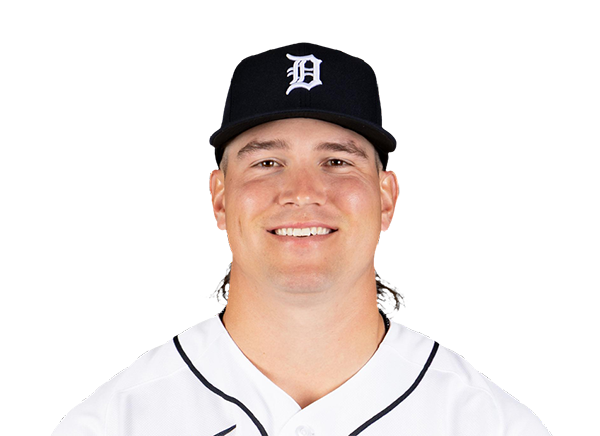 Tyler Holton | 1.1 | 0 | 0 | 0 | 0 | 0 | 0 | 15-10 | 2.69 | 15 |
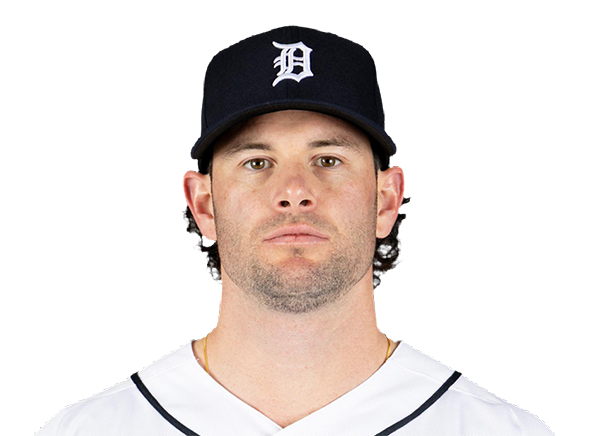 Kyle Finnegan | 1.0 | 3 | 3 | 3 | 0 | 1 | 1 | 28-19 | 4.18 | 28 |
 Tyler Kinley | 1.0 | 0 | 0 | 0 | 0 | 0 | 0 | 11-8 | 3.66 | 11 |
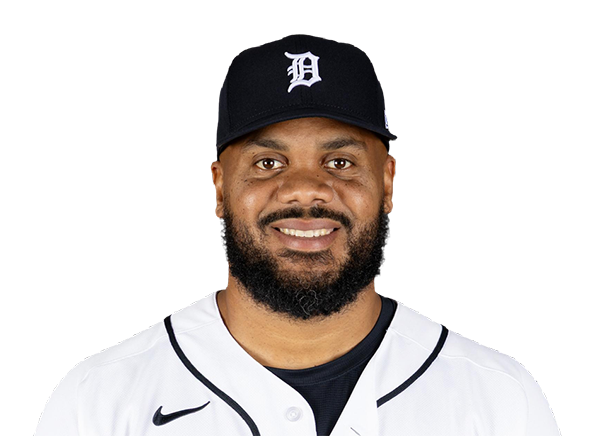 Kenley Jansen | 1.0 | 0 | 0 | 0 | 1 | 1 | 0 | 13-8 | 3.43 | 13 |
Toronto Blue Jays
| Player | IP | H | R | ER | BB | K | HR | PC-ST | ERA | PC |
|---|---|---|---|---|---|---|---|---|---|---|
 Jose Soriano | 6.1 | 5 | 4 | 4 | 1 | 5 | 0 | 90-57 | 3.56 | 90 |
 Paul Sewald | 0.2 | 0 | 0 | 0 | 0 | 0 | 0 | 7-5 | 5.04 | 7 |
 Joe Mantiply | 0.1 | 2 | 1 | 1 | 0 | 0 | 0 | 16-8 | 2.52 | 16 |
 Louis Varland | 1.2 | 2 | 1 | 1 | 1 | 2 | 0 | 31-19 | 1.32 | 31 |
H2H / Season Series
TOR5–6
DET
DET1–4
TOR
DET1–2
TOR
DET3–2
TOR
TOR1–6
DET
TOR5–0
DET
DET4–4
TOR
DET4–4
TOR
Last 5 Games
| Date | Opponent | Result |
|---|---|---|
| Sep 14 | @ TOR | W6–5 |
| Sep 13 |  vs COL | W8–1 |
| Sep 12 | vs COL | W11–7 |
| Sep 11 | vs COL | W6–2 |
| Sep 9 |  vs MIN | W7–2 |
| Date | Opponent | Result |
|---|---|---|
| Sep 14 | vs DET | L5–6 |
| Sep 13 |  vs BAL | W8–1 |
| Sep 12 | vs BAL | W7–3 |
| Sep 11 | vs BAL | L4–7 |
| Sep 9 |  @ ATH | L0–2 |
Standings
American League
| Team | W | L | PCT | GB | DIFF | STRK |
|---|---|---|---|---|---|---|
1 Rays | 90 | 59 | .604 | - | +69 | W3 |
2 White Sox | 77 | 73 | .513 | 13.5 | +38 | W1 |
3 Astros | 75 | 75 | .500 | 15.5 | -53 | L3 |
4 Yankees | 87 | 63 | .580 | 3.5 | +130 | W2 |
5 Red Sox | 82 | 68 | .547 | 8.5 | +88 | W2 |
6 Guardians | 76 | 75 | .503 | 15 | -11 | L1 |
| 7Blue Jays | 75 | 76 | .497 | 16 | -32 | L1 |
8 Rangers | 74 | 76 | .493 | 16.5 | -44 | W2 |
| 9Orioles | 73 | 78 | .483 | 18 | -34 | W1 |
| 10Tigers | 71 | 79 | .473 | 19.5 | +71 | W5 |
| 11Twins | 70 | 80 | .467 | 20.5 | -67 | L2 |
12 Mariners | 70 | 81 | .464 | 21 | -60 | L2 |
13 Royals | 66 | 84 | .440 | 24.5 | -94 | L2 |
| 14Athletics | 61 | 89 | .407 | 29.5 | -203 | W1 |
15 Angels | 57 | 93 | .380 | 33.5 | -74 | W1 |
National League
| Team | W | L | PCT | GB | DIFF | STRK |
|---|---|---|---|---|---|---|
1 Brewers | 93 | 57 | .620 | - | +195 | L1 |
2 Dodgers | 91 | 59 | .607 | 2 | +173 | W1 |
3 Braves | 88 | 63 | .583 | 5.5 | +112 | L2 |
4 Cubs | 84 | 67 | .556 | 9.5 | +142 | W1 |
5 Phillies | 83 | 67 | .553 | 10 | +31 | W1 |
6 Padres | 82 | 68 | .547 | 11 | +23 | W8 |
7 Diamondbacks | 80 | 71 | .530 | 13.5 | +3 | W1 |
8 Pirates | 75 | 75 | .500 | 18 | +26 | W1 |
9 Cardinals | 75 | 76 | .497 | 18.5 | -6 | W2 |
10 Marlins | 74 | 77 | .490 | 19.5 | +5 | L1 |
11 Reds | 70 | 80 | .467 | 23 | -148 | L1 |
12 Nationals | 70 | 81 | .464 | 23.5 | +3 | W3 |
13 Mets | 69 | 81 | .460 | 24 | -35 | L2 |
14 Giants | 62 | 89 | .411 | 31.5 | -78 | L4 |
| 15Rockies | 55 | 95 | .367 | 38 | -170 | L8 |
DET
VS
TOR
Pitchers
Troy Melton
Catchers
Dillon Dingler
Infielders
Kevin McGonigle
Gleyber Torres
Spencer Torkelson
Hao-Yu Lee
Outfielders
Brett Callahan
Max Clark
Zach McKinstry
Designated Hitters
Riley Greene
Pitchers
Jose Soriano
Catchers
Alejandro Kirk
Infielders
Vladimir Guerrero Jr.
Kazuma Okamoto
Andres Gimenez
Ernie Clement
Outfielders
Brett Bateman
Nathan Lukes
Josh Smith
Designated Hitters
George Springer
Tigers
VS
Blue Jays
Batting
150
Team Games Played
151
5056
At Bats
5096
1210
Hits
1268
640
Runs Batted In
583
169
Home Runs
148
54
Stolen Bases
74
.239
Batting Average
.249
672
Runs
613
235
Doubles
241
32
Triples
8
2016
Total Bases
1969
528
Walks
426
1302
Strikeouts
1085
.316
On Base Percentage
.311
.399
Slugging Percentage
.386
.715
OBP Pct + SLG Pct
.697
150
Games Played
151
0
Games Started
0
60
Hit By Pitch
55
0.0
Wins Above Replacement
0.0
0.0
Offensive Wins Above Replacement
0.0
21
Caught Stealing
16
1
Is Qualified
1
651.2
Runs Created
615.9
4.4
Runs Created Per 27 Outs
4.1
.093
Walks Per Plate Appearance
.075
0.41
Walk To Strikeout Ratio
0.39
.159
Isolated Power
.138
.270
Secondary Average
.233
3.93
Pitches Per Plate Appearance
3.81
436
Extra Base Hits
397
5699
Plate Appearances
5649
29.9
At Bats Per Home Run
34.4
8
Sacrifice Hit
23
42
Sacrifice Flies
46
Pitching
150
Team Games Played
151
54
Quality Starts
45
71
Wins
75
79
Losses
76
30
Saves
50
70
Holds
98
1158
Hits
1187
541
Earned runs
583
155
Home Runs
156
469
Walks
549
1203
Strikeouts
1313
8.1
Strikeouts Per 9 Innings
8.8
0.0
Pitches Per Start
0.0
1.22
Walks Plus Hits Per Inning Pitched
1.29
3.66
Earned Run Average
3.91
79
Losses
76
1330.0
Innings pitched
1342.0
.473
Win Percentage
.497
62
Save Opportunities
66
.233
Opponent Batting Average
.236
.307
Opponent's On-base pct.
.314
.380
Opponent's Slugging pct.
.371
.687
Opponent's OPB Pct + SLG Pct
.685
4971
At Bats
5034
230
Doubles
196
19
Triples
9
75
Batters Hit
40
83
Stolen Bases
138
150
Games Played
151
0
Complete Games
1
0
Shutouts
1
35
Wild Pitches
48
0
Runs Batted In
0
3
Balks
10
1330.0
Innings pitched
1342.0
8.1
Strikeouts Per 9 Innings
8.8
30
Caught Stealing
42
150
Games Started
151
0.0
Wins Above Replacement
0.0
1
Is Qualified
1
601
Runs
645
535
Earned Runs
576
1891
Total Bases
1869
Fielding
150
Team Games Played
151
1330
Full Innings
1342
5406
Total Chances
5391
3990
Putouts
4026
1348
Assists
1275
68
Errors
90
235
Double Plays
241
0.987
Fielding Percentage
0.983
36.1
Range Factor
35.6
0.0
Zone Rating
0.0
150
Games Played
151
0
Games Started
0
0.0
Defensive Wins Above Replacement
0.0
1
Qualified
1