

Tigers vs Blue Jays Live Score (16 Sep, 2026)
Game Information
Stage
STD
Season
2026
First Pitch
Wed, Sep 16, 3:07 pm
Venue
Rogers Centre
Location
Toronto, Ontario
Venue Type
Indoor
Broadcast
MLB.TV
Attendance
43,463
Live Situation
3Balls
3Strikes
0Outs
—Pitcher
—At Bat
Pitch Sequence
1
BALL
Four-seam FB
99 MPH
2
BALL
Changeup
94 MPH
3
BALL
Four-seam FB
99 MPH
4
STRIKE LOOKING
Four-seam FB
99 MPH
5
STRIKE LOOKING
Four-seam FB
99 MPH
6
STRIKE LOOKING
Four-seam FB
98 MPH
Injury Report







Team Stats
 DET
TOR


1
Runs
5
7
Hits
9
3
Errors
0
0
Home Runs
0
4
Walks
3
6
Strikeouts
4
Player Box Score
Detroit Tigers
| Player | H-AB | AB | R | H | RBI | HR | BB | K | #P | AVG | OBP | SLG |
|---|---|---|---|---|---|---|---|---|---|---|---|---|
 Kevin McGonigle | 2-5 | 5 | 0 | 2 | 0 | 0 | 0 | 1 | 19 | .274 | .376 | .424 |
 Hao-Yu Lee | 0-4 | 4 | 0 | 0 | 0 | 0 | 0 | 1 | 15 | .254 | .313 | .412 |
 Colt Keith | 1-1 | 1 | 1 | 1 | 0 | 0 | 1 | 0 | 11 | .259 | .321 | .406 |
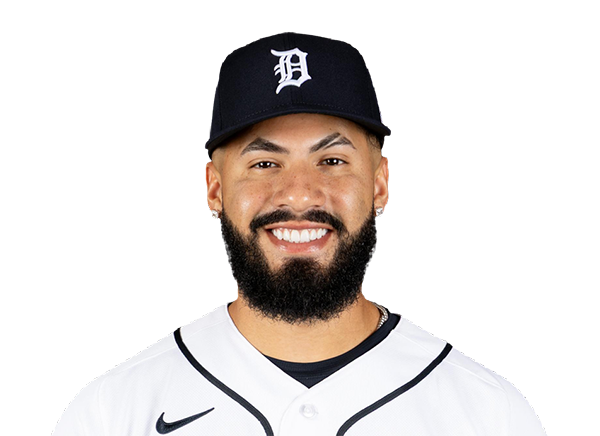 Gleyber Torres | 1-2 | 2 | 0 | 1 | 0 | 0 | 0 | 0 | 9 | .265 | .366 | .375 |
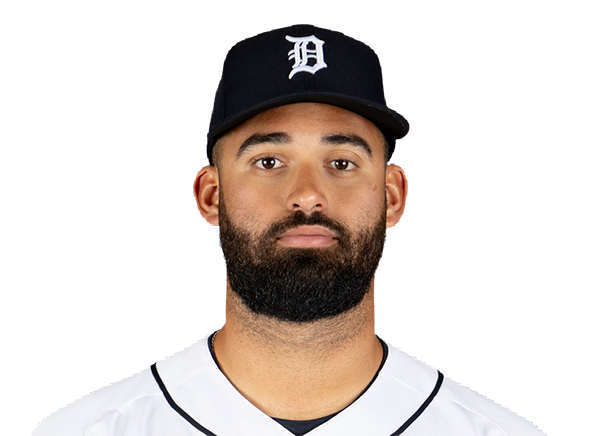 Riley Greene | 1-4 | 4 | 0 | 1 | 1 | 0 | 0 | 0 | 9 | .284 | .371 | .480 |
 Dillon Dingler | 0-4 | 4 | 0 | 0 | 0 | 0 | 0 | 0 | 9 | .242 | .302 | .451 |
 Max Clark | 1-4 | 4 | 0 | 1 | 0 | 0 | 0 | 1 | 9 | .277 | .352 | .446 |
 Spencer Torkelson | 1-2 | 2 | 0 | 1 | 0 | 0 | 2 | 1 | 18 | .226 | .321 | .423 |
 Brett Callahan | 0-3 | 3 | 0 | 0 | 0 | 0 | 1 | 1 | 20 | .214 | .274 | .357 |
 John Peck | 0-4 | 4 | 0 | 0 | 0 | 0 | 0 | 1 | 14 | .220 | .340 | .244 |
Toronto Blue Jays
| Player | H-AB | AB | R | H | RBI | HR | BB | K | #P | AVG | OBP | SLG |
|---|---|---|---|---|---|---|---|---|---|---|---|---|
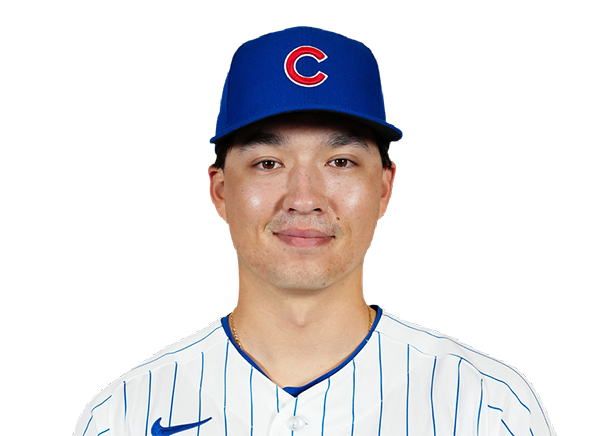 Brett Bateman | 2-4 | 4 | 1 | 2 | 0 | 0 | 0 | 1 | 20 | .333 | .400 | .428 |
 Nathan Lukes | 1-3 | 3 | 0 | 1 | 1 | 0 | 0 | 1 | 14 | .274 | .322 | .389 |
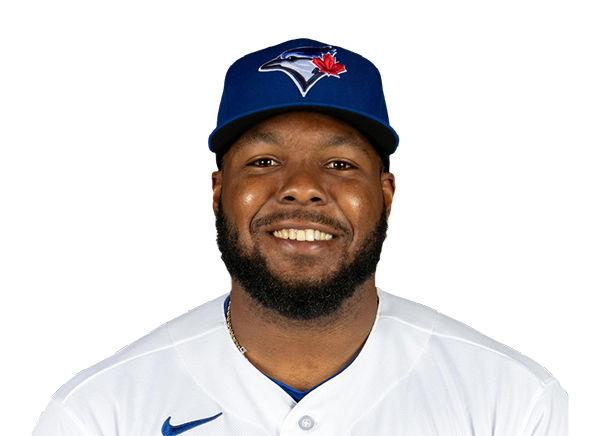 Vladimir Guerrero Jr. | 1-3 | 3 | 0 | 1 | 0 | 0 | 1 | 0 | 14 | .262 | .334 | .360 |
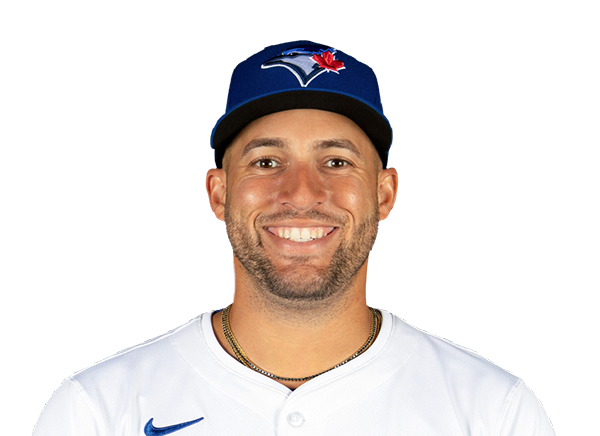 George Springer | 1-4 | 4 | 0 | 1 | 1 | 0 | 0 | 1 | 12 | .253 | .329 | .416 |
 Kazuma Okamoto | 0-3 | 3 | 1 | 0 | 0 | 0 | 1 | 1 | 20 | .235 | .310 | .464 |
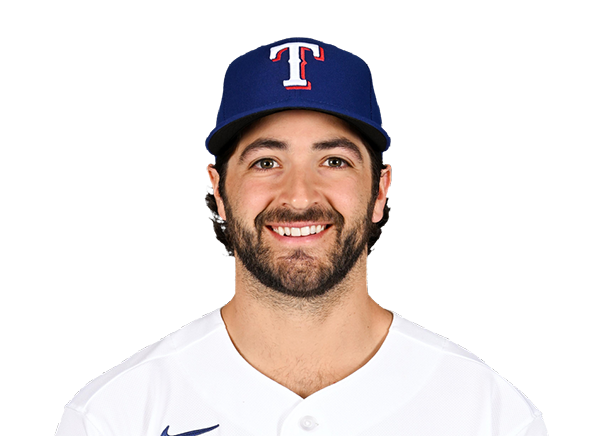 Josh Smith | 1-4 | 4 | 1 | 1 | 0 | 0 | 0 | 0 | 15 | .222 | .313 | .349 |
 Ernie Clement | 0-3 | 3 | 1 | 0 | 1 | 0 | 0 | 0 | 14 | .268 | .294 | .375 |
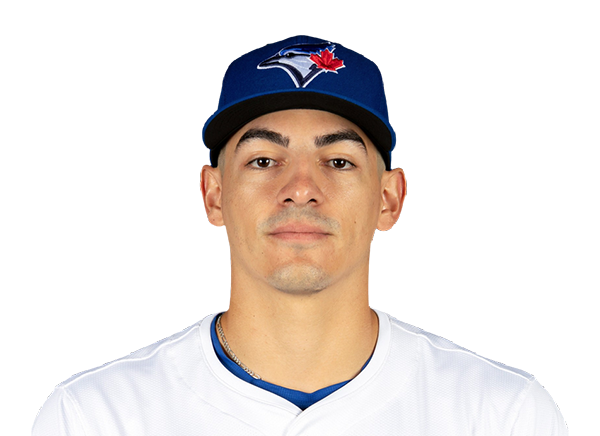 Brandon Valenzuela | 1-3 | 3 | 1 | 1 | 0 | 0 | 1 | 0 | 14 | .217 | .301 | .361 |
 Myles Straw | 2-4 | 4 | 0 | 2 | 1 | 0 | 0 | 0 | 18 | .234 | .300 | .341 |
Detroit Tigers
| Player | IP | H | R | ER | BB | K | HR | PC-ST | ERA | PC |
|---|---|---|---|---|---|---|---|---|---|---|
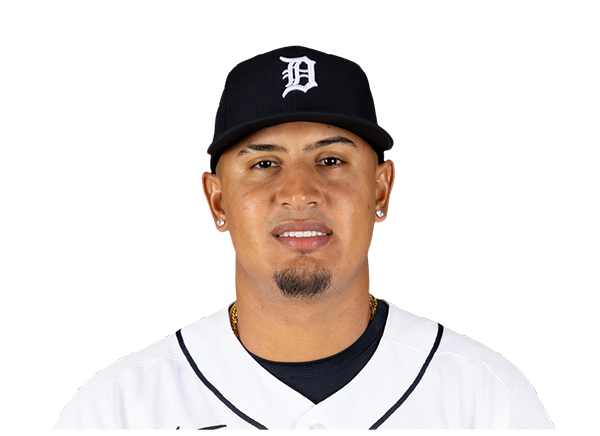 Keider Montero | 4.0 | 6 | 2 | 2 | 2 | 4 | 0 | 89-55 | 3.58 | 89 |
 Tyler Holton | 1.0 | 2 | 1 | 1 | 0 | 0 | 0 | 12-8 | 2.78 | 12 |
 Drew Sommers | 1.0 | 1 | 2 | 0 | 0 | 0 | 0 | 16-12 | 3.50 | 16 |
 Tyler Kinley | 2.0 | 0 | 0 | 0 | 1 | 0 | 0 | 24-15 | 3.52 | 24 |
Toronto Blue Jays
| Player | IP | H | R | ER | BB | K | HR | PC-ST | ERA | PC |
|---|---|---|---|---|---|---|---|---|---|---|
 Max Scherzer | 5.0 | 3 | 1 | 1 | 3 | 3 | 0 | 73-44 | 6.07 | 73 |
 Mason Fluharty | 1.0 | 0 | 0 | 0 | 0 | 0 | 0 | 11-7 | 3.30 | 11 |
 Spencer Miles | 2.0 | 4 | 0 | 0 | 1 | 1 | 0 | 35-20 | 2.65 | 35 |
 Louis Varland | 1.0 | 0 | 0 | 0 | 0 | 2 | 0 | 14-8 | 1.30 | 14 |
H2H / Season Series
TOR5–1
DET
TOR1–10
DET
TOR5–6
DET
DET1–4
TOR
DET1–2
TOR
DET3–2
TOR
TOR1–6
DET
TOR5–0
DET
DET4–4
TOR
DET4–4
TOR
Last 5 Games
| Date | Opponent | Result |
|---|---|---|
| Sep 16 | @ TOR | L1–5 |
| Sep 15 | @ TOR | W10–1 |
| Sep 14 | @ TOR | W6–5 |
| Sep 13 |  vs COL | W8–1 |
| Sep 12 | vs COL | W11–7 |
| Date | Opponent | Result |
|---|---|---|
| Sep 16 | vs DET | W5–1 |
| Sep 15 | vs DET | L1–10 |
| Sep 14 | vs DET | L5–6 |
| Sep 13 |  vs BAL | W8–1 |
| Sep 12 | vs BAL | W7–3 |
Standings
American League
| Team | W | L | PCT | GB | DIFF | STRK |
|---|---|---|---|---|---|---|
1 Rays | 92 | 59 | .609 | - | +71 | W5 |
2 Guardians | 78 | 75 | .510 | 15 | -7 | W2 |
3 Astros | 76 | 76 | .500 | 16.5 | -54 | L1 |
4 Yankees | 88 | 64 | .579 | 4.5 | +136 | L1 |
5 Red Sox | 82 | 70 | .539 | 10.5 | +82 | L2 |
6 White Sox | 77 | 75 | .507 | 15.5 | +34 | L2 |
7 Rangers | 76 | 76 | .500 | 16.5 | -38 | W4 |
| 8Blue Jays | 76 | 77 | .497 | 17 | -37 | W1 |
| 9Orioles | 75 | 78 | .490 | 18 | -26 | W3 |
| 10Tigers | 72 | 80 | .474 | 20.5 | +76 | L1 |
11 Twins | 71 | 81 | .467 | 21.5 | -73 | W1 |
12 Mariners | 70 | 82 | .461 | 22.5 | -61 | L3 |
13 Royals | 67 | 85 | .441 | 25.5 | -93 | W1 |
14 Athletics | 61 | 91 | .401 | 31.5 | -205 | L2 |
15 Angels | 58 | 93 | .384 | 34 | -73 | W2 |
National League
| Team | W | L | PCT | GB | DIFF | STRK |
|---|---|---|---|---|---|---|
1 Brewers | 95 | 57 | .625 | - | +200 | W2 |
2 Dodgers | 92 | 60 | .605 | 3 | +173 | L1 |
3 Braves | 89 | 64 | .582 | 6.5 | +111 | L1 |
4 Cubs | 85 | 68 | .556 | 10.5 | +143 | W1 |
5 Phillies | 84 | 68 | .553 | 11 | +31 | W1 |
6 Padres | 83 | 69 | .546 | 12 | +23 | W1 |
7 Diamondbacks | 80 | 72 | .526 | 15 | +1 | L1 |
8 Marlins | 75 | 77 | .493 | 20 | +7 | W1 |
9 Pirates | 75 | 77 | .493 | 20 | +21 | L2 |
10 Cardinals | 75 | 78 | .490 | 20.5 | -14 | L2 |
11 Reds | 71 | 81 | .467 | 24 | -148 | W1 |
12 Nationals | 71 | 82 | .464 | 24.5 | +3 | L1 |
13 Mets | 69 | 83 | .454 | 26 | -43 | L4 |
14 Giants | 64 | 89 | .418 | 31.5 | -70 | W2 |
| 15Rockies | 56 | 96 | .368 | 39 | -170 | L1 |
DET
VS
TOR
Pitchers
Keider Montero
Catchers
Dillon Dingler
Infielders
Kevin McGonigle
Hao-Yu Lee
Spencer Torkelson
John Peck
Outfielders
Riley Greene
Max Clark
Brett Callahan
Designated Hitters
Colt Keith
Pitchers
Max Scherzer
Catchers
Brandon Valenzuela
Infielders
Vladimir Guerrero Jr.
Kazuma Okamoto
Josh Smith
Ernie Clement
Outfielders
Brett Bateman
Nathan Lukes
Myles Straw
Designated Hitters
George Springer
Tigers
VS
Blue Jays
Batting
152
Team Games Played
153
5124
At Bats
5160
1227
Hits
1283
649
Runs Batted In
588
171
Home Runs
148
55
Stolen Bases
75
.239
Batting Average
.249
683
Runs
619
239
Doubles
242
32
Triples
8
2043
Total Bases
1985
540
Walks
432
1316
Strikeouts
1095
.317
On Base Percentage
.311
.399
Slugging Percentage
.385
.716
OBP Pct + SLG Pct
.696
152
Games Played
153
152
Games Started
153
60
Hit By Pitch
55
0.0
Wins Above Replacement
0.0
0.0
Offensive Wins Above Replacement
0.0
22
Caught Stealing
17
1
Is Qualified
1
661.4
Runs Created
619.5
4.4
Runs Created Per 27 Outs
4.1
.093
Walks Per Plate Appearance
.076
0.41
Walk To Strikeout Ratio
0.39
.159
Isolated Power
.136
.271
Secondary Average
.231
3.93
Pitches Per Plate Appearance
3.81
442
Extra Base Hits
398
5780
Plate Appearances
5721
30.0
At Bats Per Home Run
34.9
8
Sacrifice Hit
24
42
Sacrifice Flies
47
Pitching
152
Team Games Played
153
54
Quality Starts
45
72
Wins
76
80
Losses
77
30
Saves
51
70
Holds
99
1173
Hits
1204
545
Earned runs
592
155
Home Runs
158
475
Walks
561
1213
Strikeouts
1327
8.1
Strikeouts Per 9 Innings
8.8
142.5
Pitches Per Start
148.7
1.22
Walks Plus Hits Per Inning Pitched
1.30
3.64
Earned Run Average
3.92
80
Losses
77
1347.0
Innings pitched
1360.0
.474
Win Percentage
.497
62
Save Opportunities
67
.233
Opponent Batting Average
.236
.307
Opponent's On-base pct.
.314
.379
Opponent's Slugging pct.
.372
.686
Opponent's OPB Pct + SLG Pct
.686
5035
At Bats
5102
231
Doubles
200
19
Triples
9
75
Batters Hit
40
84
Stolen Bases
139
152
Games Played
153
0
Complete Games
1
15
Shutouts
11
35
Wild Pitches
48
577
Runs Batted In
619
3
Balks
8
1347.0
Innings pitched
1360.0
8.1
Strikeouts Per 9 Innings
8.8
31
Caught Stealing
43
152
Games Started
153
0.0
Wins Above Replacement
0.0
1
Is Qualified
1
607
Runs
656
545
Earned Runs
592
1907
Total Bases
1896
Fielding
152
Team Games Played
153
1347
Full Innings
1360
5484
Total Chances
5465
4041
Putouts
4080
1371
Assists
1293
72
Errors
92
239
Double Plays
242
0.987
Fielding Percentage
0.983
36.2
Range Factor
35.6
0.0
Zone Rating
0.0
152
Games Played
153
0
Games Started
0
0.0
Defensive Wins Above Replacement
0.0
1
Qualified
1