

Tigers vs Giants Live Score (9 Aug, 2026)
Game Information
Stage
Standard
Season
2026
First Pitch
Sun, Aug 9, 4:05 pm
Venue
Oracle Park
Location
San Francisco, California
Attendance
32,200
Home Runs
Dillon Dingler
26 HR
.275 AVG
80 RBI
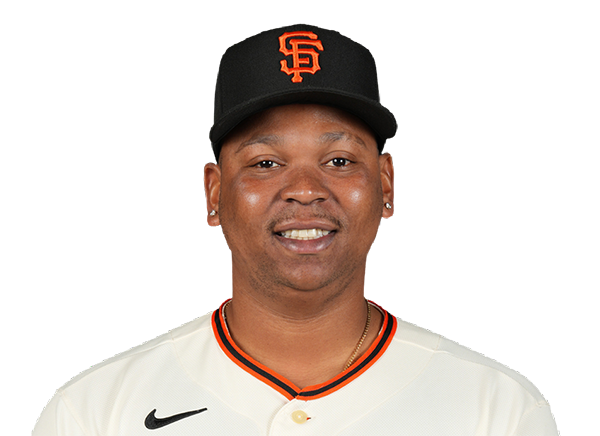
Rafael Devers
24 HR
.247 AVG
64 RBI
Batting Average
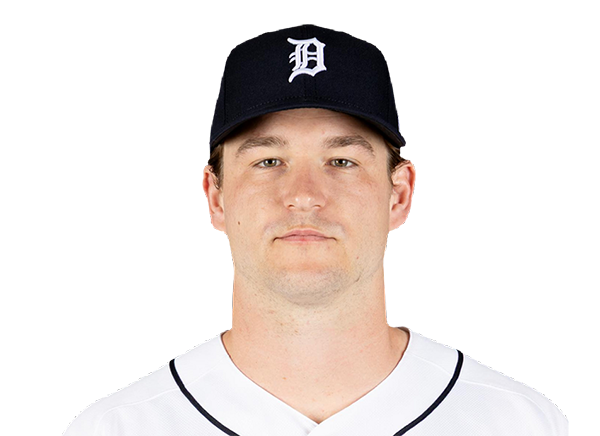
Kevin McGonigle
.287 AVG
.392 OBP
.431 SLG
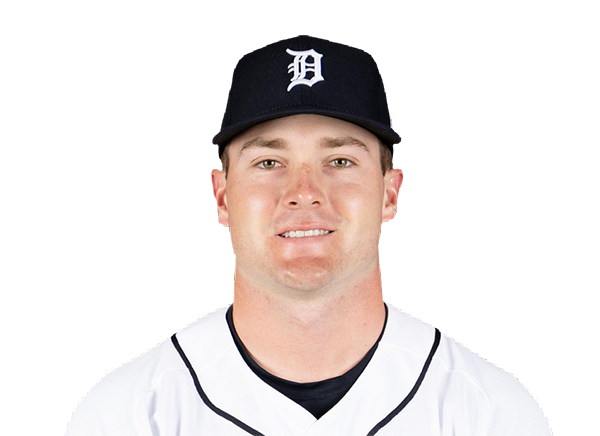
Jung Hoo Lee
.301 AVG
.337 OBP
.444 SLG

Runs Batted In
Dillon Dingler
80 RBI
26 HR
.275 AVG
Rafael Devers
64 RBI
24 HR
.247 AVG
Earned Run Average
Keider Montero
3.38 ERA
8 W
86 K
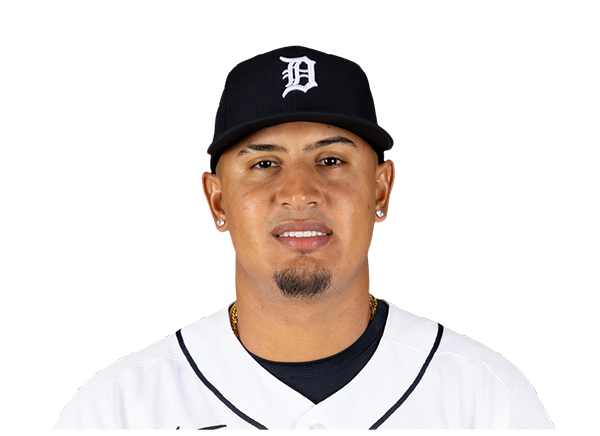
Logan Webb
3.74 ERA
7 W
101 K

Wins
Keider Montero
8 W
3.38 ERA
86 K
Logan Webb
7 W
3.74 ERA
101 K
Strikeouts
Framber Valdez
103 K
7 W
4.17 ERA
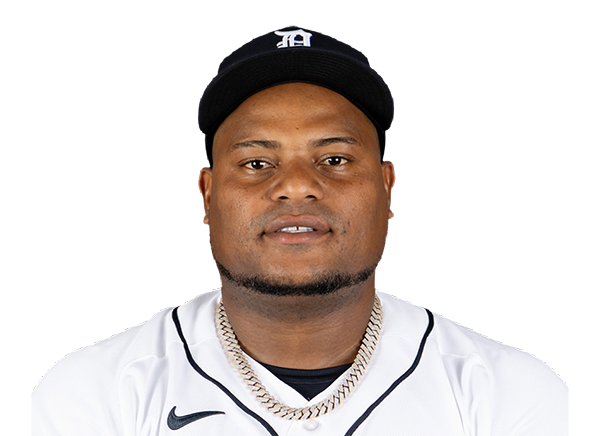
Landen Roupp
123 K
7 W
4.22 ERA

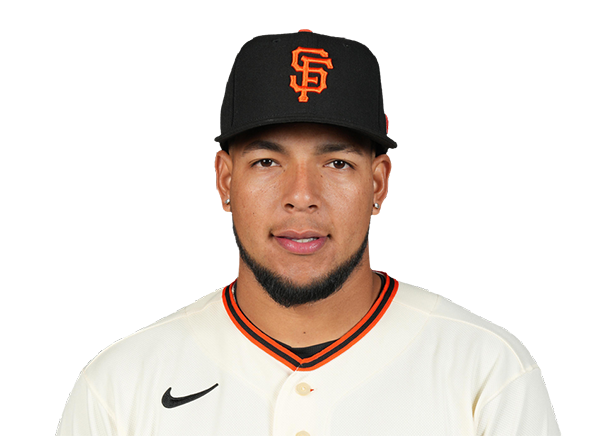
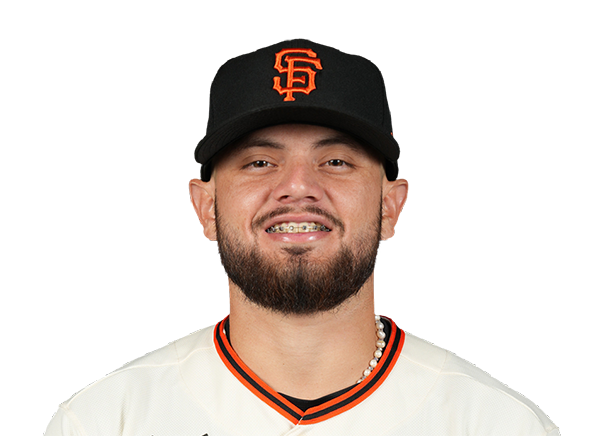
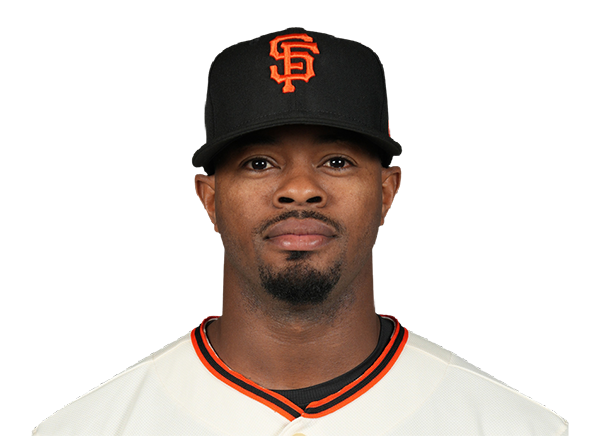
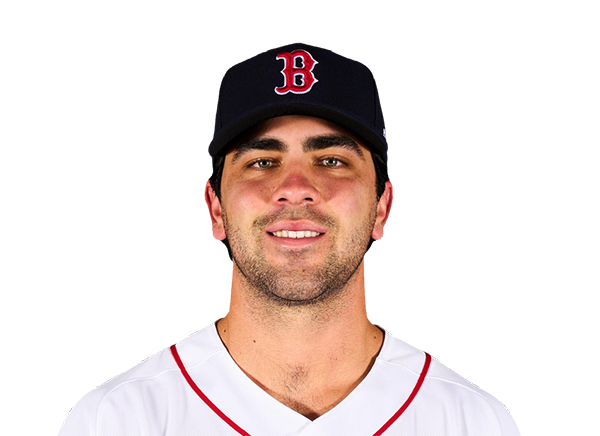
Injury Report

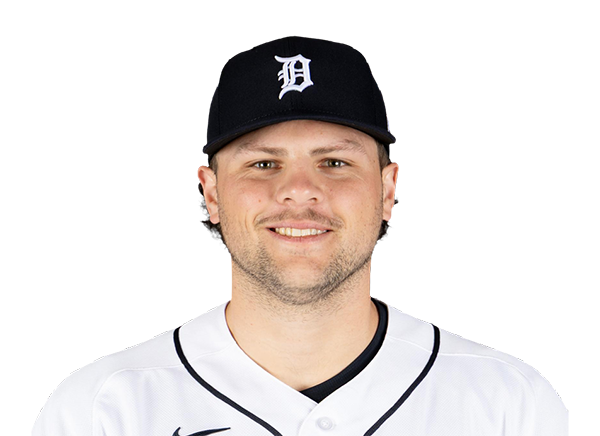
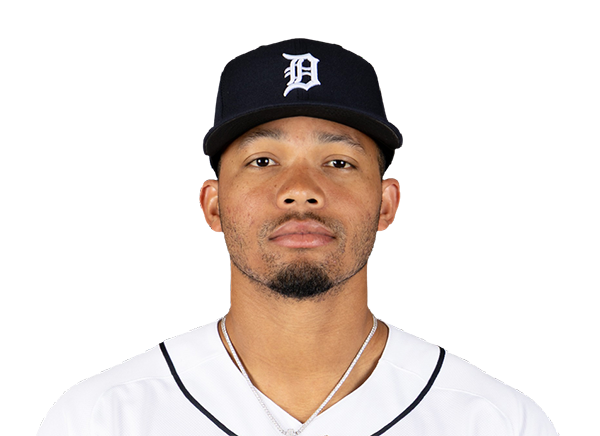

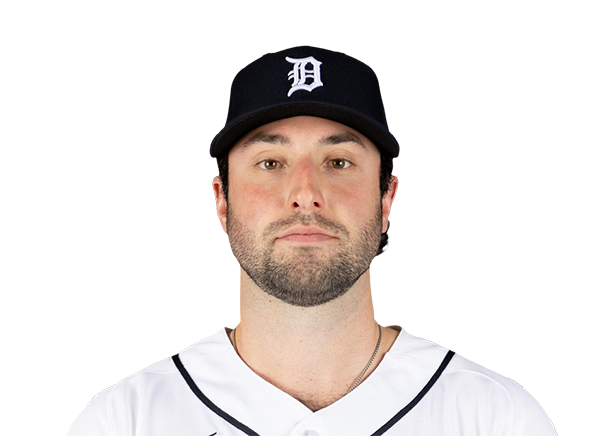

Team Stats
 DET
SF


Array
Runs
Array
6
Hits
7
1
Errors
1
—
Home Runs
—
—
Walks
—
—
Strikeouts
—
Standings
American League
| Team | W | L | PCT | GB | DIFF | STRK |
|---|---|---|---|---|---|---|
1 Rays | 76 | 53 | .589 | - | +42 | L3 |
2 White Sox | 67 | 62 | .519 | 9 | +42 | L1 |
3 Astros | 65 | 65 | .500 | 11.5 | -43 | L1 |
4 Yankees | 73 | 56 | .566 | 3 | +95 | L1 |
5 Red Sox | 70 | 59 | .543 | 6 | +98 | W2 |
6 Rangers | 64 | 66 | .492 | 12.5 | -48 | L1 |
7 Guardians | 64 | 66 | .492 | 12.5 | -14 | W3 |
8 Blue Jays | 64 | 67 | .489 | 13 | -50 | W1 |
9 Twins | 63 | 67 | .485 | 13.5 | -47 | L2 |
10 Orioles | 63 | 67 | .485 | 13.5 | -33 | W2 |
11 Mariners | 62 | 68 | .477 | 14.5 | -44 | W2 |
| 12Tigers | 61 | 68 | .473 | 15 | +77 | L4 |
13 Royals | 57 | 74 | .435 | 20 | -95 | W7 |
14 Angels | 52 | 78 | .400 | 24.5 | -68 | W1 |
15 Athletics | 50 | 80 | .385 | 26.5 | -188 | W1 |
National League
| Team | W | L | PCT | GB | DIFF | STRK |
|---|---|---|---|---|---|---|
1 Brewers | 81 | 49 | .623 | - | +163 | W3 |
2 Dodgers | 79 | 51 | .608 | 2 | +147 | W5 |
3 Braves | 75 | 55 | .577 | 6 | +108 | L2 |
4 Cubs | 74 | 56 | .569 | 7 | +98 | L3 |
5 Phillies | 72 | 58 | .554 | 9 | +25 | W8 |
6 Padres | 70 | 60 | .538 | 11 | +9 | W2 |
7 Diamondbacks | 68 | 62 | .523 | 13 | +7 | L1 |
8 Marlins | 66 | 64 | .508 | 15 | +17 | W2 |
9 Cardinals | 66 | 65 | .504 | 15.5 | 0 | L2 |
10 Pirates | 63 | 68 | .481 | 18.5 | +29 | L2 |
11 Reds | 62 | 68 | .477 | 19 | -92 | W1 |
12 Nationals | 61 | 70 | .466 | 20.5 | +14 | L3 |
13 Mets | 59 | 71 | .454 | 22 | -39 | W1 |
| 14Giants | 52 | 77 | .403 | 28.5 | -79 | L3 |
15 Rockies | 50 | 79 | .388 | 30.5 | -131 | L5 |
DET
VS
SF
Pitchers

Troy Melton
Catchers
Eduardo Valencia
Infielders
Kevin McGonigle
Gleyber Torres

Colt Keith

Spencer Torkelson
Outfielders
Riley Greene

Max Clark

Zach McKinstry
Designated Hitters
Dillon Dingler
Pitchers
Logan Webb
Catchers

Daniel Susac
Infielders
Willy Adames
Rafael Devers
Osleivis Basabe

Christian Koss
Outfielders
Jung Hoo Lee

Drew Gilbert

Grant McCray
Designated Hitters

Bryce Eldridge
Tigers
VS
Giants
Batting
118
Team Games Played
118
3988
At Bats
4014
972
Hits
1001
514
Runs Batted In
466
144
Home Runs
131
35
Stolen Bases
53
.244
Batting Average
.249
539
Runs
485
179
Doubles
200
24
Triples
23
1631
Total Bases
1640
423
Walks
309
1018
Strikeouts
930
.320
On Base Percentage
.307
.409
Slugging Percentage
.409
.729
OBP Pct + SLG Pct
.715
118
Games Played
118
118
Games Started
118
44
Hit By Pitch
39
0.0
Wins Above Replacement
0.0
0.0
Offensive Wins Above Replacement
0.0
17
Caught Stealing
15
1
Is Qualified
1
531.4
Runs Created
507.4
4.6
Runs Created Per 27 Outs
4.3
.094
Walks Per Plate Appearance
.070
0.42
Walk To Strikeout Ratio
0.33
.165
Isolated Power
.159
.276
Secondary Average
.246
3.93
Pitches Per Plate Appearance
3.86
347
Extra Base Hits
354
4502
Plate Appearances
4418
27.7
At Bats Per Home Run
30.6
6
Sacrifice Hit
22
36
Sacrifice Flies
34
Pitching
118
Team Games Played
118
47
Quality Starts
43
58
Wins
49
60
Losses
69
23
Saves
22
51
Holds
57
897
Hits
978
405
Earned runs
505
113
Home Runs
112
355
Walks
441
984
Strikeouts
893
8.5
Strikeouts Per 9 Innings
7.7
141.3
Pitches Per Start
148.0
1.20
Walks Plus Hits Per Inning Pitched
1.36
3.49
Earned Run Average
4.37
60
Losses
69
1045.2
Innings pitched
1040.0
.492
Win Percentage
.415
49
Save Opportunities
37
.230
Opponent Batting Average
.249
.300
Opponent's On-base pct.
.329
.370
Opponent's Slugging pct.
.391
.670
Opponent's OPB Pct + SLG Pct
.720
3905
At Bats
3933
173
Doubles
176
17
Triples
24
50
Batters Hit
49
67
Stolen Bases
100
118
Games Played
118
0
Complete Games
1
13
Shutouts
8
26
Wild Pitches
41
432
Runs Batted In
513
3
Balks
4
1045.2
Innings pitched
1040.0
8.5
Strikeouts Per 9 Innings
7.7
23
Caught Stealing
31
118
Games Started
118
0.0
Wins Above Replacement
0.0
1
Is Qualified
1
452
Runs
548
405
Earned Runs
505
1443
Total Bases
1538
Fielding
118
Team Games Played
118
1046
Full Innings
1040
4218
Total Chances
4299
3137
Putouts
3120
1029
Assists
1104
52
Errors
75
179
Double Plays
200
0.988
Fielding Percentage
0.983
35.9
Range Factor
36.6
0.0
Zone Rating
0.0
118
Games Played
118
0
Games Started
0
0.0
Defensive Wins Above Replacement
0.0
1
Qualified
1