

Tigers vs Mariners Live Score (6 Aug, 2026)
Game Information
Stage
Standard
Season
2026
First Pitch
Wed, Aug 5, 9:40 pm
Venue
T-Mobile Park
Location
Seattle, Washington
Attendance
40,743
Live Situation
1Balls
0Strikes
0Outs
—Pitcher
—At Bat
Pitch Sequence
1
BALL
Four-seam FB
99 MPH
2
BALL IN PLAY
Four-seam FB
100 MPH
Injury Report


Team Stats
 DET
SEA


2
Runs
4
4
Hits
7
0
Errors
0
1
Home Runs
2
1
Walks
2
9
Strikeouts
3
Player Box Score
Detroit Tigers
| Player | H-AB | AB | R | H | RBI | HR | BB | K | #P | AVG | OBP | SLG |
|---|---|---|---|---|---|---|---|---|---|---|---|---|
 Kevin McGonigle | 0-4 | 4 | 0 | 0 | 0 | 0 | 0 | 0 | 10 | .282 | .388 | .422 |
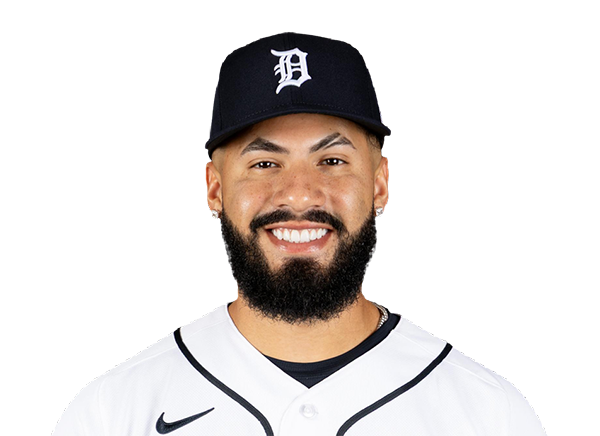 Gleyber Torres | 1-3 | 3 | 1 | 1 | 0 | 0 | 0 | 1 | 10 | .268 | .387 | .407 |
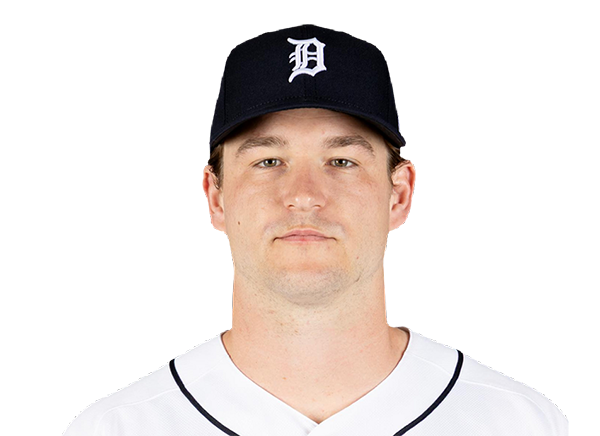 Dillon Dingler | 2-3 | 3 | 1 | 2 | 2 | 1 | 1 | 1 | 20 | .275 | .339 | .529 |
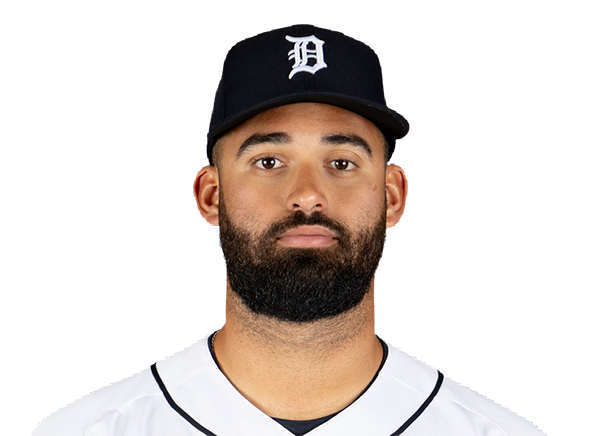 Riley Greene | 0-3 | 3 | 0 | 0 | 0 | 0 | 0 | 1 | 19 | .276 | .368 | .458 |
 Colt Keith | 0-4 | 4 | 0 | 0 | 0 | 0 | 0 | 1 | 9 | .269 | .317 | .419 |
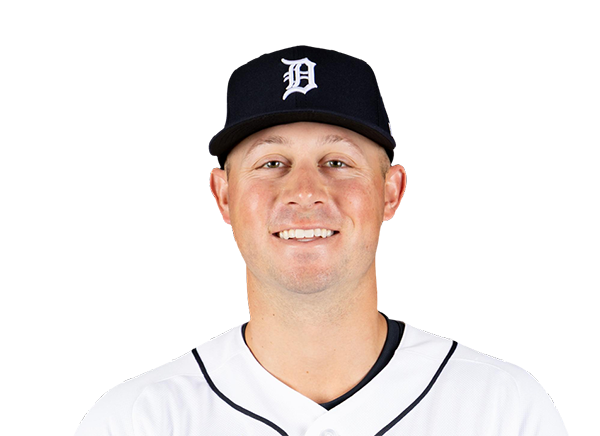 Spencer Torkelson | 0-4 | 4 | 0 | 0 | 0 | 0 | 0 | 2 | 10 | .218 | .306 | .421 |
 Max Clark | 1-3 | 3 | 0 | 1 | 0 | 0 | 0 | 1 | 16 | .368 | .500 | .632 |
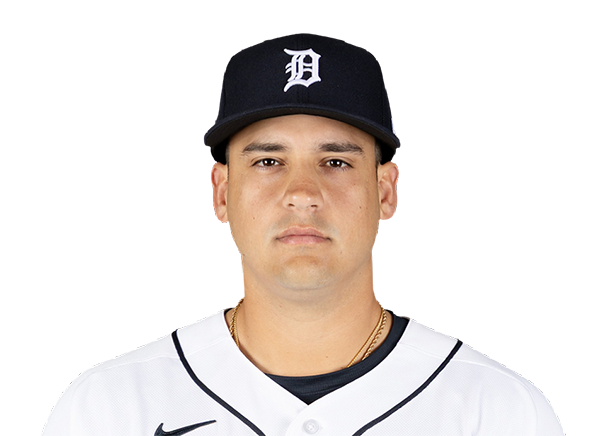 Eduardo Valencia | 0-3 | 3 | 0 | 0 | 0 | 0 | 0 | 1 | 12 | .412 | .429 | .853 |
 Zach McKinstry | 0-1 | 1 | 0 | 0 | 0 | 0 | 0 | 0 | 9 | .219 | .295 | .330 |
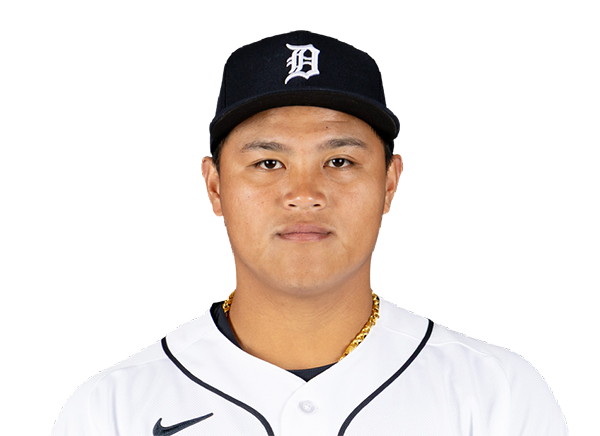 Hao-Yu Lee | 0-1 | 1 | 0 | 0 | 0 | 0 | 0 | 1 | 5 | .266 | .296 | .422 |
 James Outman | 0-0 | 0 | 0 | 0 | 0 | 0 | 0 | 0 | 0 | .176 | .227 | .363 |
Seattle Mariners
| Player | H-AB | AB | R | H | RBI | HR | BB | K | #P | AVG | OBP | SLG |
|---|---|---|---|---|---|---|---|---|---|---|---|---|
 Cole Young | 0-4 | 4 | 0 | 0 | 0 | 0 | 0 | 0 | 11 | .265 | .324 | .415 |
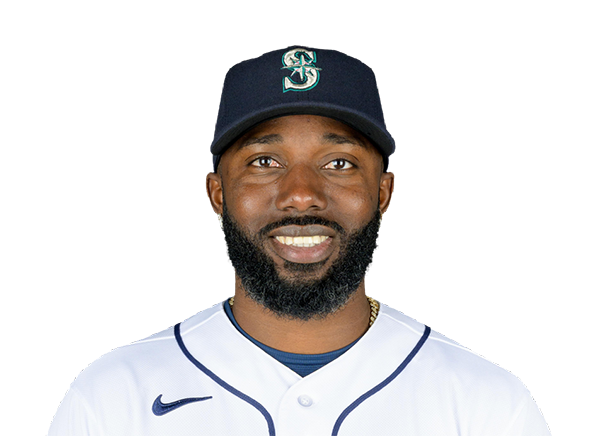 Randy Arozarena | 2-4 | 4 | 1 | 2 | 0 | 0 | 0 | 0 | 17 | .284 | .378 | .457 |
 Dominic Canzone | 0-3 | 3 | 1 | 0 | 0 | 0 | 1 | 0 | 11 | .254 | .332 | .505 |
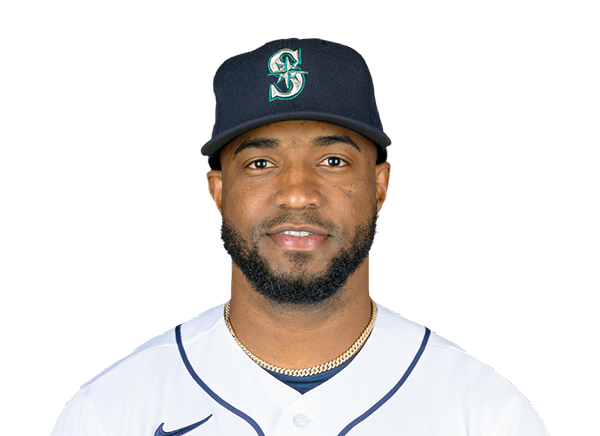 Victor Robles | 0-0 | 0 | 0 | 0 | 0 | 0 | 0 | 0 | 0 | .241 | .288 | .267 |
 Julio Rodriguez | 2-3 | 3 | 1 | 2 | 3 | 1 | 1 | 0 | 11 | .258 | .322 | .423 |
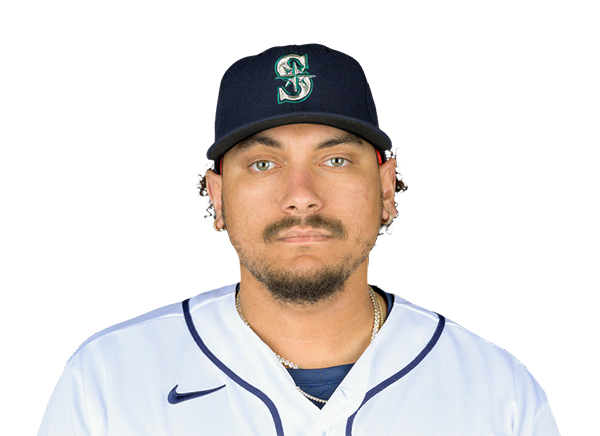 Josh Naylor | 0-3 | 3 | 0 | 0 | 0 | 0 | 0 | 1 | 10 | .260 | .323 | .355 |
 Cal Raleigh | 0-2 | 2 | 0 | 0 | 0 | 0 | 0 | 1 | 14 | .162 | .266 | .308 |
 Brendan Donovan | 1-3 | 3 | 0 | 1 | 0 | 0 | 0 | 0 | 12 | .264 | .370 | .429 |
 Taylor Ward | 1-3 | 3 | 0 | 1 | 0 | 0 | 0 | 1 | 10 | .167 | .167 | .167 |
 Colt Emerson | 1-3 | 3 | 1 | 1 | 1 | 1 | 0 | 0 | 8 | .199 | .259 | .358 |
Detroit Tigers
| Player | IP | H | R | ER | BB | K | HR | PC-ST | ERA | PC |
|---|---|---|---|---|---|---|---|---|---|---|
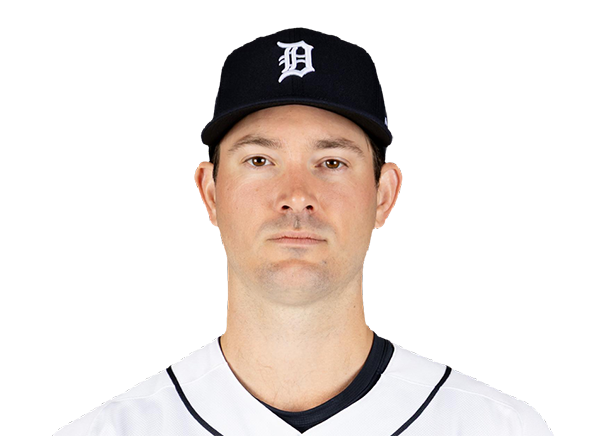 Drew Anderson | 3.2 | 3 | 0 | 0 | 1 | 0 | 0 | 42-28 | 4.01 | 42 |
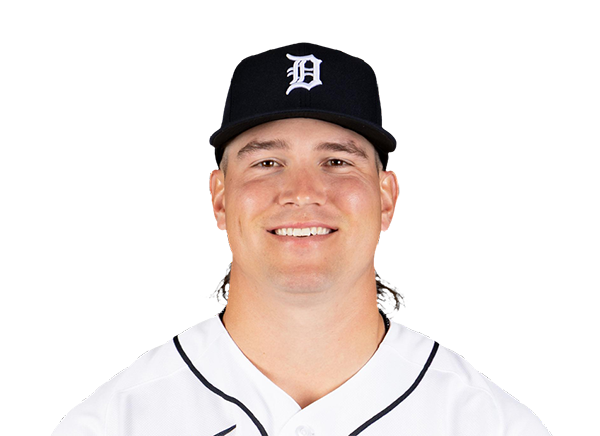 Tyler Holton | 2.0 | 0 | 0 | 0 | 0 | 1 | 0 | 23-13 | 2.94 | 23 |
 Brenan Hanifee | 0.0 | 2 | 3 | 3 | 1 | 0 | 1 | 6-5 | 5.31 | 6 |
 Drew Sommers | 0.1 | 0 | 0 | 0 | 0 | 1 | 0 | 4-3 | 4.24 | 4 |
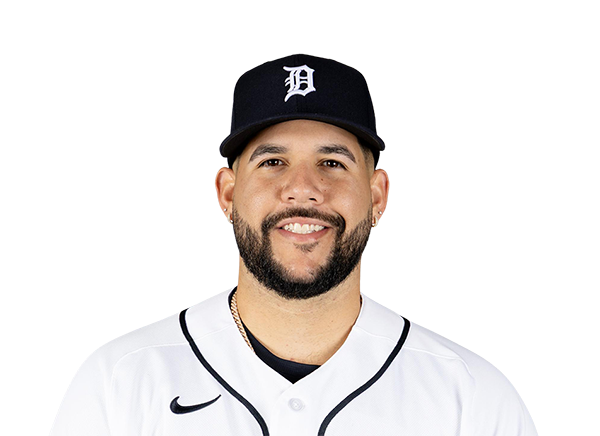 Enmanuel De Jesus | 2.0 | 2 | 1 | 1 | 0 | 1 | 1 | 29-19 | 3.68 | 29 |
Seattle Mariners
| Player | IP | H | R | ER | BB | K | HR | PC-ST | ERA | PC |
|---|---|---|---|---|---|---|---|---|---|---|
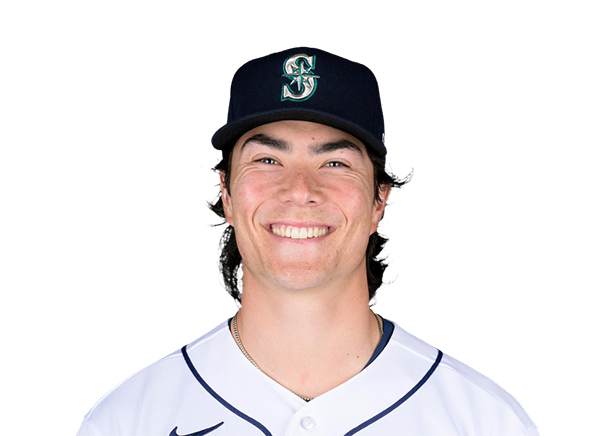 Bryan Woo | 7.0 | 3 | 0 | 0 | 1 | 5 | 0 | 91-61 | 4.31 | 91 |
 Gabe Speier | 0.2 | 0 | 1 | 1 | 0 | 1 | 0 | 9-4 | 2.10 | 9 |
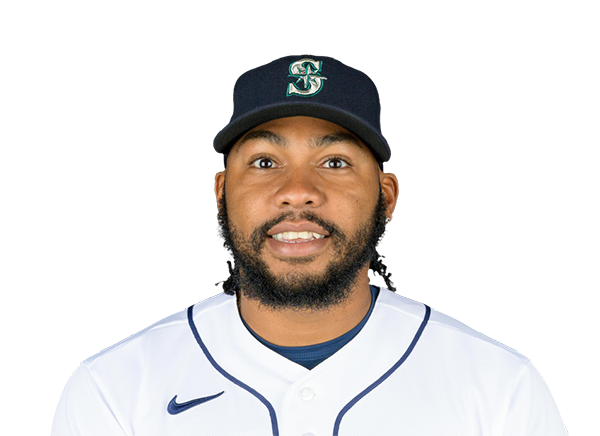 Eduard Bazardo | 0.1 | 1 | 1 | 1 | 0 | 1 | 1 | 9-5 | 3.47 | 9 |
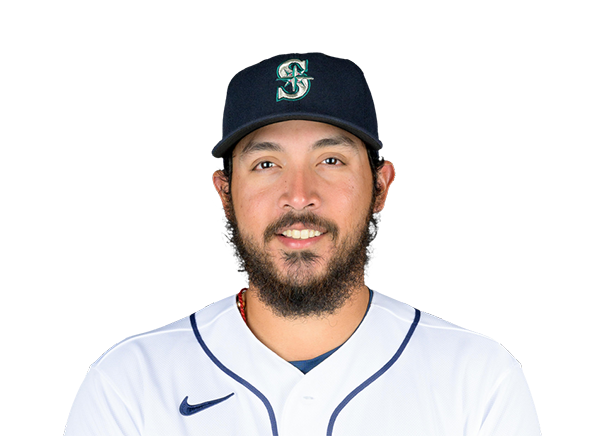 Andres Munoz | 1.0 | 0 | 0 | 0 | 0 | 2 | 0 | 11-7 | 3.89 | 11 |
H2H / Season Series
SEA0–11
DET
SEA4–2
DET
SEA0–8
DET
DET5–4
SEA
DET0–4
SEA
DET7–3
SEA
Last 5 Games
| Date | Opponent | Result |
|---|---|---|
| Aug 22 |  @ KC | L1–3 |
| Aug 21 | @ KC | L2–5 |
| Aug 19 |  @ PIT | L3–4 |
| Aug 18 | @ PIT | L1–4 |
| Aug 17 | @ PIT | W8–5 |
| Date | Opponent | Result |
|---|---|---|
| Aug 22 |  vs CHC | W5–4 |
| Aug 21 | vs CHC | W6–5 |
| Aug 20 |  @ MIL | L4–7 |
| Aug 19 | @ MIL | W7–5 |
| Aug 18 | @ MIL | L0–22 |
Standings
American League
| Team | W | L | PCT | GB | DIFF | STRK |
|---|---|---|---|---|---|---|
1 Rays | 76 | 53 | .589 | - | +42 | L3 |
2 White Sox | 67 | 62 | .519 | 9 | +42 | L1 |
3 Astros | 65 | 65 | .500 | 11.5 | -43 | L1 |
4 Yankees | 73 | 56 | .566 | 3 | +95 | L1 |
5 Red Sox | 70 | 59 | .543 | 6 | +98 | W2 |
6 Rangers | 64 | 66 | .492 | 12.5 | -48 | L1 |
7 Guardians | 64 | 66 | .492 | 12.5 | -14 | W3 |
8 Blue Jays | 64 | 67 | .489 | 13 | -50 | W1 |
9 Twins | 63 | 67 | .485 | 13.5 | -47 | L2 |
10 Orioles | 63 | 67 | .485 | 13.5 | -33 | W2 |
| 11Mariners | 62 | 68 | .477 | 14.5 | -44 | W2 |
| 12Tigers | 61 | 68 | .473 | 15 | +77 | L4 |
| 13Royals | 57 | 74 | .435 | 20 | -95 | W7 |
14 Angels | 52 | 78 | .400 | 24.5 | -68 | W1 |
15 Athletics | 50 | 80 | .385 | 26.5 | -188 | W1 |
National League
| Team | W | L | PCT | GB | DIFF | STRK |
|---|---|---|---|---|---|---|
| 1Brewers | 81 | 49 | .623 | - | +163 | W3 |
2 Dodgers | 79 | 51 | .608 | 2 | +147 | W5 |
3 Braves | 75 | 55 | .577 | 6 | +108 | L2 |
| 4Cubs | 74 | 56 | .569 | 7 | +98 | L3 |
5 Phillies | 72 | 58 | .554 | 9 | +25 | W8 |
6 Padres | 70 | 60 | .538 | 11 | +9 | W2 |
7 Diamondbacks | 68 | 62 | .523 | 13 | +7 | L1 |
8 Marlins | 66 | 64 | .508 | 15 | +17 | W2 |
9 Cardinals | 66 | 65 | .504 | 15.5 | 0 | L2 |
| 10Pirates | 63 | 68 | .481 | 18.5 | +29 | L2 |
11 Reds | 62 | 68 | .477 | 19 | -92 | W1 |
12 Nationals | 61 | 70 | .466 | 20.5 | +14 | L3 |
13 Mets | 59 | 71 | .454 | 22 | -39 | W1 |
14 Giants | 52 | 77 | .403 | 28.5 | -79 | L3 |
15 Rockies | 50 | 79 | .388 | 30.5 | -131 | L5 |
DET
VS
SEA
Pitchers
Drew Anderson
Catchers
Eduardo Valencia
Infielders
Kevin McGonigle
Gleyber Torres
Colt Keith
Spencer Torkelson
Outfielders
Riley Greene
Max Clark
Zach McKinstry
Designated Hitters
Dillon Dingler
Pitchers
Bryan Woo
Catchers
Cal Raleigh
Infielders
Cole Young
Josh Naylor
Brendan Donovan
Colt Emerson
Outfielders
Randy Arozarena
Dominic Canzone
Julio Rodriguez
Designated Hitters
Taylor Ward
Tigers
VS
Mariners
Batting
114
Team Games Played
115
3836
At Bats
3799
929
Hits
874
492
Runs Batted In
442
142
Home Runs
134
35
Stolen Bases
82
.242
Batting Average
.230
515
Runs
458
173
Doubles
141
23
Triples
9
1574
Total Bases
1435
404
Walks
380
988
Strikeouts
981
.319
On Base Percentage
.310
.410
Slugging Percentage
.378
.729
OBP Pct + SLG Pct
.687
114
Games Played
115
114
Games Started
115
43
Hit By Pitch
71
0.0
Wins Above Replacement
0.0
0.0
Offensive Wins Above Replacement
0.0
17
Caught Stealing
29
1
Is Qualified
1
509.9
Runs Created
456.3
4.5
Runs Created Per 27 Outs
4.0
.093
Walks Per Plate Appearance
.089
0.41
Walk To Strikeout Ratio
0.39
.168
Isolated Power
.148
.278
Secondary Average
.262
3.93
Pitches Per Plate Appearance
3.91
338
Extra Base Hits
284
4330
Plate Appearances
4288
27.0
At Bats Per Home Run
28.4
6
Sacrifice Hit
9
36
Sacrifice Flies
28
Pitching
114
Team Games Played
115
45
Quality Starts
53
55
Wins
56
59
Losses
59
22
Saves
26
50
Holds
60
876
Hits
924
400
Earned runs
425
111
Home Runs
124
347
Walks
283
948
Strikeouts
980
8.5
Strikeouts Per 9 Innings
8.7
141.9
Pitches Per Start
140.4
1.21
Walks Plus Hits Per Inning Pitched
1.19
3.57
Earned Run Average
3.77
59
Losses
59
1009.2
Innings pitched
1015.1
.482
Win Percentage
.487
47
Save Opportunities
44
.232
Opponent Batting Average
.242
.303
Opponent's On-base pct.
.300
.374
Opponent's Slugging pct.
.392
.677
Opponent's OPB Pct + SLG Pct
.692
3783
At Bats
3822
173
Doubles
181
16
Triples
10
50
Batters Hit
49
66
Stolen Bases
75
114
Games Played
115
0
Complete Games
1
11
Shutouts
8
26
Wild Pitches
25
426
Runs Batted In
434
3
Balks
3
1009.2
Innings pitched
1015.1
8.5
Strikeouts Per 9 Innings
8.7
23
Caught Stealing
23
114
Games Started
115
0.0
Wins Above Replacement
0.0
1
Is Qualified
1
446
Runs
461
400
Earned Runs
425
1414
Total Bases
1497
Fielding
114
Team Games Played
115
1010
Full Innings
1015
4071
Total Chances
4037
3029
Putouts
3046
992
Assists
934
50
Errors
57
173
Double Plays
141
0.988
Fielding Percentage
0.986
35.8
Range Factor
35.3
0.0
Zone Rating
0.0
114
Games Played
115
0
Games Started
0
0.0
Defensive Wins Above Replacement
0.0
1
Qualified
1