

Tigers vs Pirates Live Score (17 Aug, 2026)
Game Information
Stage
Standard
Season
2026
First Pitch
Mon, Aug 17, 7:00 pm
Venue
PNC Park
Location
Pittsburgh, Pennsylvania
Attendance
21,956
Home Runs
Dillon Dingler
26 HR
.259 AVG
82 RBI

Brandon Lowe
26 HR
.252 AVG
79 RBI

Batting Average
Kevin McGonigle
.281 AVG
.386 OBP
.418 SLG

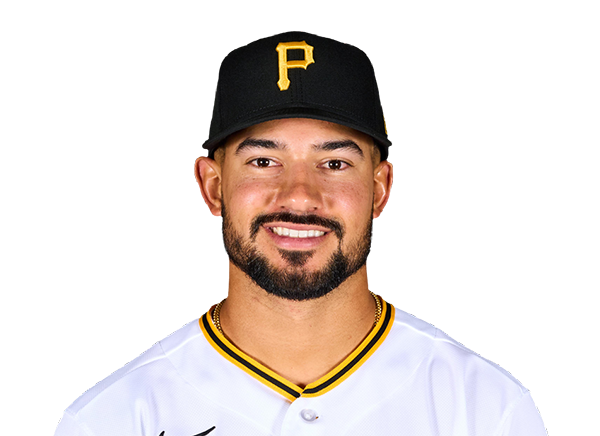
Nick Gonzales
.307 AVG
.362 OBP
.399 SLG
Runs Batted In
Dillon Dingler
82 RBI
26 HR
.259 AVG
Brandon Lowe
79 RBI
26 HR
.252 AVG
Earned Run Average
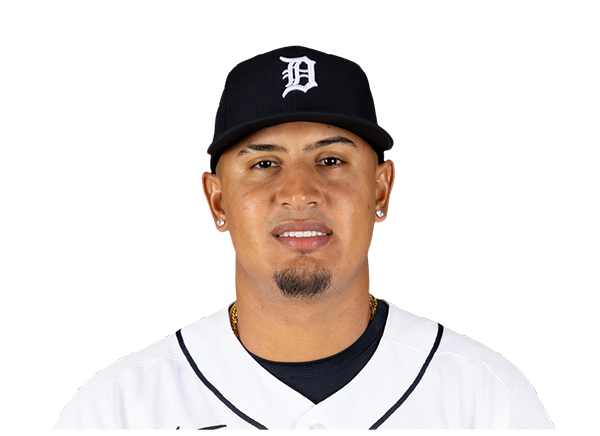
Keider Montero
3.22 ERA
9 W
86 K
Paul Skenes
3.88 ERA
9 W
166 K

Wins
Keider Montero
9 W
3.22 ERA
86 K
Braxton Ashcraft
12 W
3.88 ERA
155 K

Strikeouts
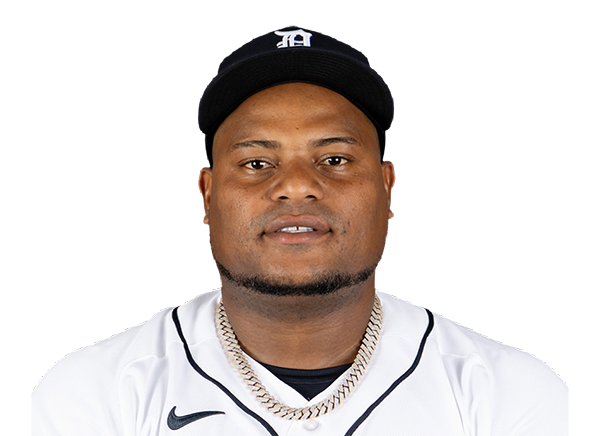
Framber Valdez
106 K
7 W
4.26 ERA
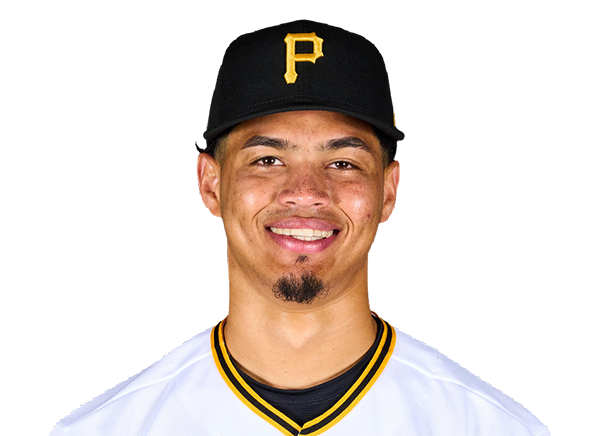
Paul Skenes
166 K
9 W
3.88 ERA
Injury Report








Team Stats
 DET
PIT


Array
Runs
Array
14
Hits
6
2
Errors
1
—
Home Runs
—
—
Walks
—
—
Strikeouts
—
Standings
American League
| Team | W | L | PCT | GB | DIFF | STRK |
|---|---|---|---|---|---|---|
1 Rays | 76 | 52 | .594 | - | +43 | L2 |
2 White Sox | 67 | 61 | .523 | 9 | +47 | W1 |
3 Astros | 65 | 64 | .504 | 11.5 | -42 | W1 |
4 Yankees | 73 | 56 | .566 | 3.5 | +95 | L1 |
5 Red Sox | 69 | 59 | .539 | 7 | +97 | W1 |
6 Rangers | 64 | 65 | .496 | 12.5 | -45 | W2 |
7 Blue Jays | 64 | 67 | .489 | 13.5 | -50 | W1 |
8 Twins | 63 | 66 | .488 | 13.5 | -45 | L1 |
9 Guardians | 63 | 66 | .488 | 13.5 | -15 | W2 |
10 Orioles | 62 | 67 | .481 | 14.5 | -34 | W1 |
| 11Tigers | 61 | 67 | .477 | 15 | +79 | L3 |
12 Mariners | 61 | 68 | .473 | 15.5 | -45 | W1 |
13 Royals | 56 | 74 | .431 | 21 | -97 | W6 |
14 Angels | 51 | 78 | .395 | 25.5 | -71 | L1 |
15 Athletics | 49 | 80 | .380 | 27.5 | -189 | L5 |
National League
| Team | W | L | PCT | GB | DIFF | STRK |
|---|---|---|---|---|---|---|
1 Brewers | 81 | 49 | .623 | - | +163 | W3 |
2 Dodgers | 78 | 51 | .605 | 2.5 | +146 | W4 |
3 Braves | 75 | 55 | .577 | 6 | +108 | L2 |
4 Cubs | 74 | 55 | .574 | 6.5 | +99 | L2 |
5 Phillies | 71 | 58 | .550 | 9.5 | +16 | W7 |
6 Padres | 69 | 60 | .535 | 11.5 | +7 | W1 |
7 Diamondbacks | 68 | 61 | .527 | 12.5 | +13 | W2 |
8 Marlins | 66 | 64 | .508 | 15 | +17 | W2 |
9 Cardinals | 66 | 64 | .508 | 15 | +9 | L1 |
| 10Pirates | 63 | 67 | .485 | 18 | +30 | L1 |
11 Reds | 61 | 68 | .473 | 19.5 | -98 | L2 |
12 Nationals | 61 | 70 | .466 | 20.5 | +14 | L3 |
13 Mets | 58 | 71 | .450 | 22.5 | -44 | L1 |
14 Giants | 52 | 76 | .406 | 28 | -78 | L2 |
15 Rockies | 50 | 78 | .391 | 30 | -130 | L4 |
DET
VS
PIT
Pitchers
Framber Valdez
Catchers
Dillon Dingler
Infielders
Kevin McGonigle

Colt Keith
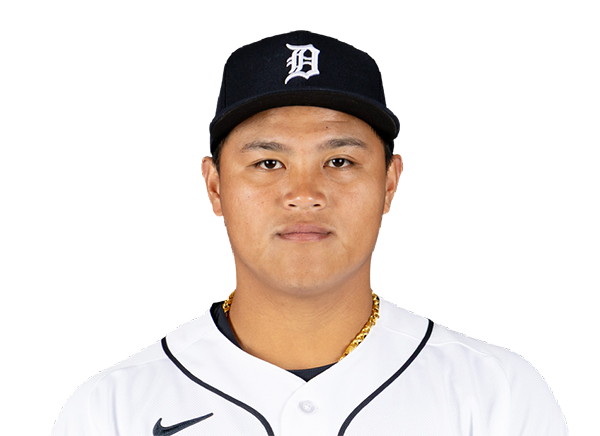
Hao-Yu Lee
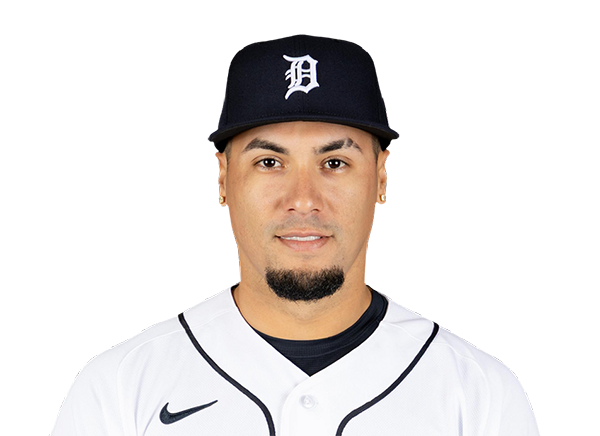
Javier Baez
Outfielders

Zach McKinstry

Brett Callahan

Max Clark
Designated Hitters
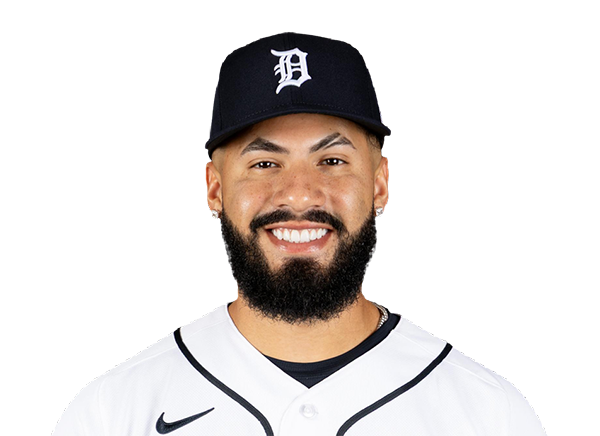
Gleyber Torres
Pitchers

Carmen Mlodzinski
Catchers

Henry Davis
Infielders

Jared Triolo
Nick Gonzales

Rafael Flores Jr.
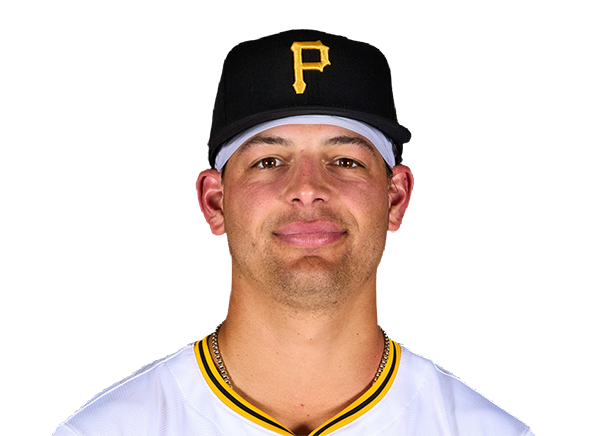
Nick Yorke
Outfielders
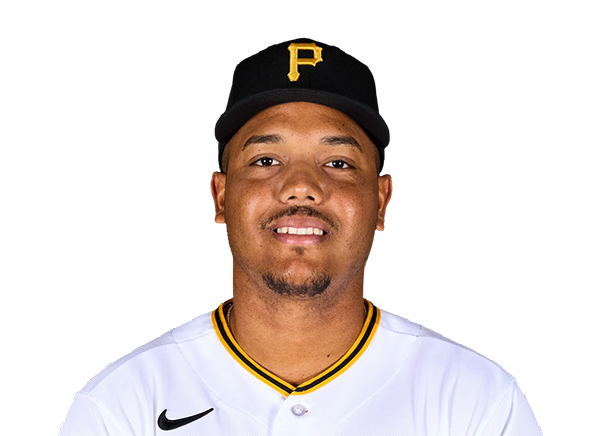
Esmerlyn Valdez

Bryan Reynolds

Jake Mangum
Designated Hitters
Brandon Lowe
Tigers
VS
Pirates
Batting
125
Team Games Played
127
4226
At Bats
4383
1029
Hits
1122
546
Runs Batted In
608
151
Home Runs
151
36
Stolen Bases
107
.243
Batting Average
.256
573
Runs
638
191
Doubles
197
26
Triples
13
1725
Total Bases
1798
446
Walks
455
1072
Strikeouts
1195
.320
On Base Percentage
.333
.408
Slugging Percentage
.410
.728
OBP Pct + SLG Pct
.743
125
Games Played
127
125
Games Started
127
48
Hit By Pitch
65
0.0
Wins Above Replacement
0.0
0.0
Offensive Wins Above Replacement
0.0
18
Caught Stealing
20
1
Is Qualified
1
562.0
Runs Created
611.9
4.6
Runs Created Per 27 Outs
4.8
.094
Walks Per Plate Appearance
.092
0.42
Walk To Strikeout Ratio
0.38
.165
Isolated Power
.154
.274
Secondary Average
.278
3.93
Pitches Per Plate Appearance
3.90
368
Extra Base Hits
361
4767
Plate Appearances
4943
28.0
At Bats Per Home Run
29.0
6
Sacrifice Hit
7
36
Sacrifice Flies
30
Pitching
125
Team Games Played
127
48
Quality Starts
38
61
Wins
61
64
Losses
66
26
Saves
24
56
Holds
51
959
Hits
1039
438
Earned runs
545
123
Home Runs
132
386
Walks
466
1030
Strikeouts
1179
8.4
Strikeouts Per 9 Innings
9.4
141.9
Pitches Per Start
151.0
1.21
Walks Plus Hits Per Inning Pitched
1.33
3.56
Earned Run Average
4.33
64
Losses
66
1108.2
Innings pitched
1132.2
.488
Win Percentage
.480
53
Save Opportunities
44
.231
Opponent Batting Average
.241
.303
Opponent's On-base pct.
.323
.374
Opponent's Slugging pct.
.393
.677
Opponent's OPB Pct + SLG Pct
.716
4153
At Bats
4308
188
Doubles
233
18
Triples
13
53
Batters Hit
69
69
Stolen Bases
78
125
Games Played
127
0
Complete Games
1
14
Shutouts
7
28
Wild Pitches
44
465
Runs Batted In
573
3
Balks
4
1108.2
Innings pitched
1132.2
8.4
Strikeouts Per 9 Innings
9.4
25
Caught Stealing
26
125
Games Started
127
0.0
Wins Above Replacement
0.0
1
Is Qualified
1
487
Runs
611
438
Earned Runs
545
1552
Total Bases
1694
Fielding
125
Team Games Played
127
1109
Full Innings
1133
4483
Total Chances
4467
3326
Putouts
3398
1100
Assists
991
57
Errors
78
191
Double Plays
197
0.987
Fielding Percentage
0.983
35.9
Range Factor
34.9
0.0
Zone Rating
0.0
125
Games Played
127
0
Games Started
0
0.0
Defensive Wins Above Replacement
0.0
1
Qualified
1