

Tigers vs White Sox Live Score (18 Sep, 2026)
Game Information
Stage
STD
Season
2026
First Pitch
Fri, Sep 18, 7:40 pm
Venue
Rate Field
Location
Chicago, Illinois
Venue Type
Outdoor
Broadcast
MLB.TV
Attendance
0
Live Situation
0Balls
3Strikes
0Outs
—Pitcher
—At Bat
Pitch Sequence
1
STRIKE LOOKING
Cutter
94 MPH
2
STRIKE LOOKING
Slider
83 MPH
3
STRIKE SWINGING
Sinker
95 MPH
Injury Report





Team Stats
 DET
CHW


11
Runs
8
16
Hits
7
2
Errors
0
2
Home Runs
1
5
Walks
4
10
Strikeouts
10
Player Box Score
Detroit Tigers
| Player | H-AB | AB | R | H | RBI | HR | BB | K | #P | AVG | OBP | SLG |
|---|---|---|---|---|---|---|---|---|---|---|---|---|
 Kevin McGonigle | 2-5 | 5 | 1 | 2 | 4 | 0 | 1 | 0 | 15 | .277 | .378 | .428 |
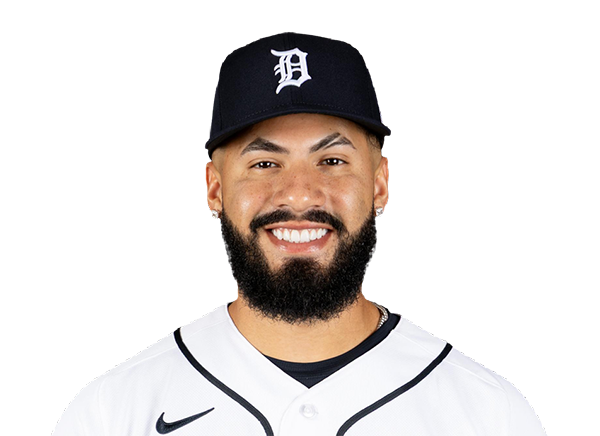 Gleyber Torres | 1-4 | 4 | 0 | 1 | 0 | 0 | 1 | 0 | 24 | .265 | .367 | .372 |
 John Peck | 0-0 | 0 | 0 | 0 | 0 | 0 | 0 | 0 | 0 | .222 | .333 | .244 |
 Colt Keith | 1-2 | 2 | 1 | 1 | 0 | 0 | 0 | 1 | 6 | .260 | .324 | .409 |
 Dillon Dingler | 1-3 | 3 | 1 | 1 | 1 | 0 | 0 | 2 | 12 | .242 | .301 | .451 |
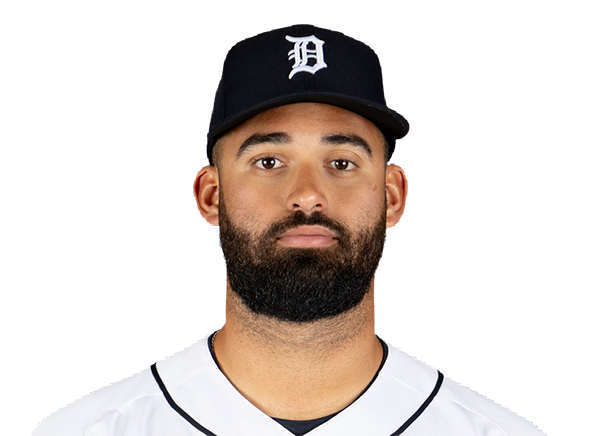 Riley Greene | 1-4 | 4 | 1 | 1 | 2 | 1 | 1 | 2 | 23 | .283 | .370 | .483 |
 Spencer Torkelson | 2-4 | 4 | 0 | 2 | 0 | 0 | 1 | 1 | 26 | .229 | .324 | .423 |
 Zach McKinstry | 0-2 | 2 | 0 | 0 | 0 | 0 | 0 | 2 | 7 | .202 | .286 | .298 |
 Ben Malgeri | 0-1 | 1 | 0 | 0 | 0 | 0 | 0 | 0 | 3 | .235 | .342 | .353 |
 Brett Callahan | 0-0 | 0 | 0 | 0 | 0 | 0 | 0 | 0 | 0 | .214 | .286 | .357 |
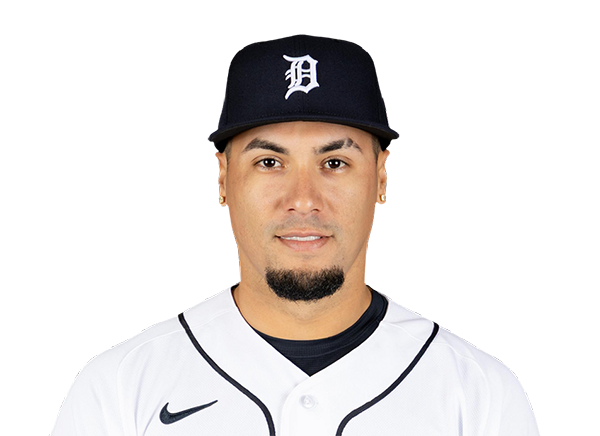 Javier Baez | 1-2 | 2 | 0 | 1 | 0 | 0 | 0 | 1 | 10 | .237 | .265 | .345 |
 Max Clark | 1-4 | 4 | 2 | 1 | 0 | 0 | 1 | 0 | 23 | .277 | .356 | .439 |
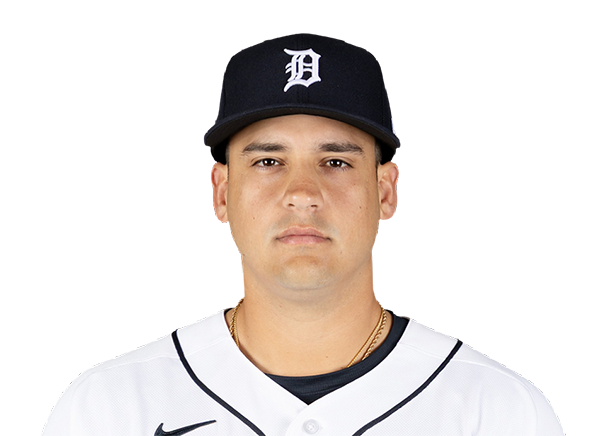 Eduardo Valencia | 2-4 | 4 | 3 | 2 | 0 | 0 | 0 | 1 | 26 | .327 | .358 | .606 |
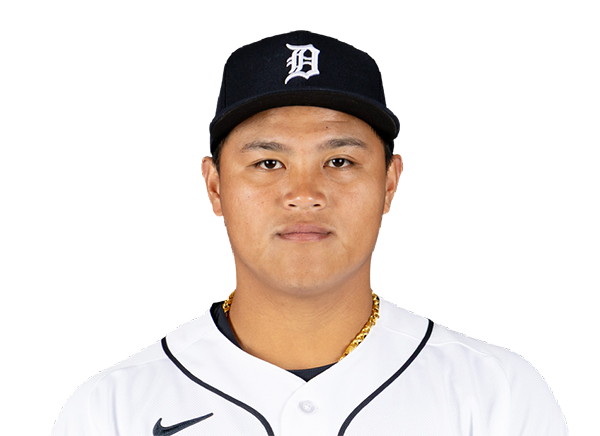 Hao-Yu Lee | 4-5 | 5 | 2 | 4 | 3 | 1 | 0 | 0 | 18 | .264 | .320 | .432 |
Chicago White Sox
| Player | H-AB | AB | R | H | RBI | HR | BB | K | #P | AVG | OBP | SLG |
|---|---|---|---|---|---|---|---|---|---|---|---|---|
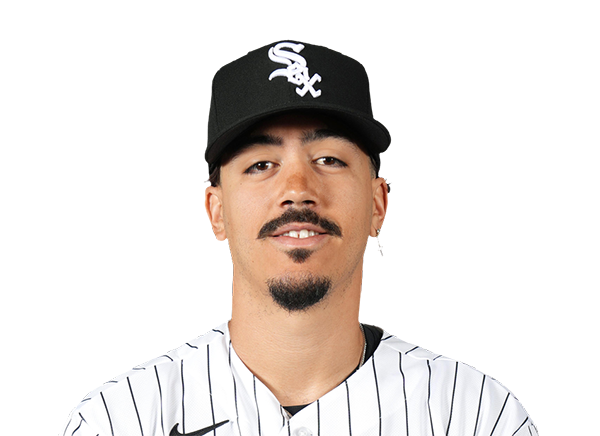 Miguel Vargas | 2-5 | 5 | 1 | 2 | 3 | 1 | 0 | 1 | 25 | .249 | .357 | .477 |
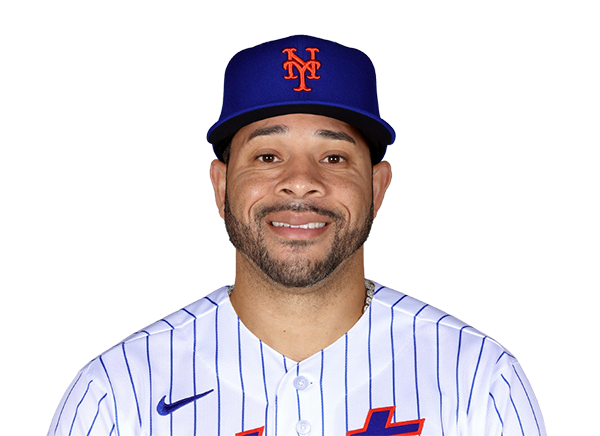 Tommy Pham | 1-2 | 2 | 1 | 1 | 0 | 0 | 1 | 0 | 13 | .091 | .200 | .227 |
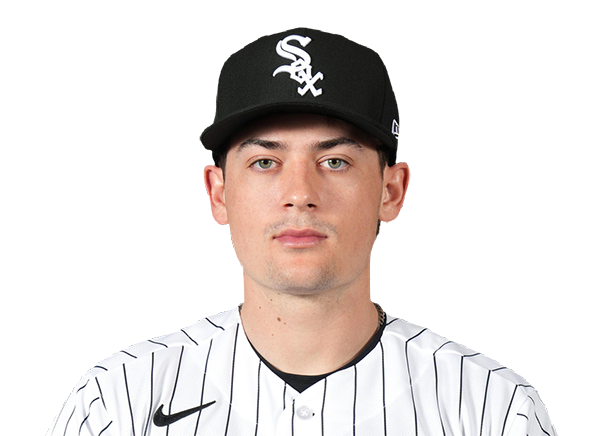 Sam Antonacci | 0-2 | 2 | 0 | 0 | 0 | 0 | 0 | 0 | 10 | .269 | .365 | .391 |
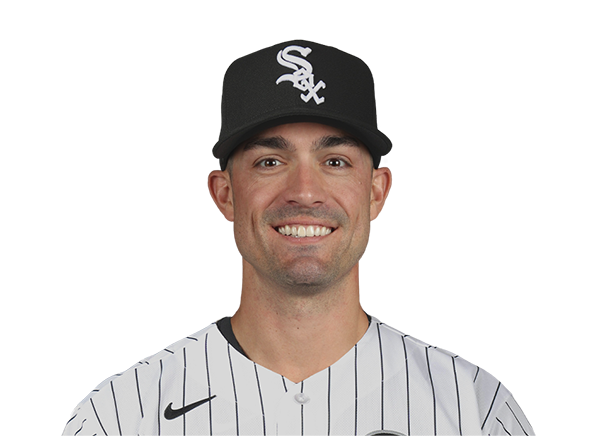 Randal Grichuk | 1-5 | 5 | 0 | 1 | 0 | 0 | 0 | 0 | 11 | .285 | .313 | .553 |
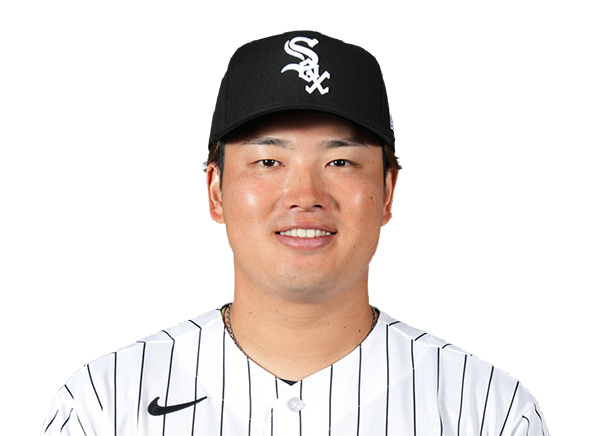 Munetaka Murakami | 0-4 | 4 | 1 | 0 | 0 | 0 | 1 | 2 | 20 | .203 | .344 | .467 |
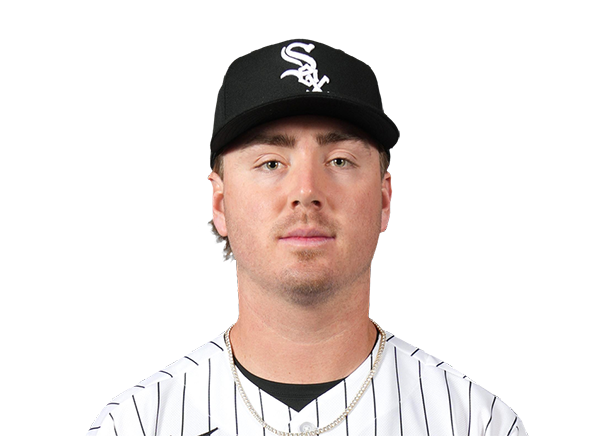 Chase Meidroth | 0-3 | 3 | 1 | 0 | 0 | 0 | 1 | 1 | 14 | .269 | .345 | .399 |
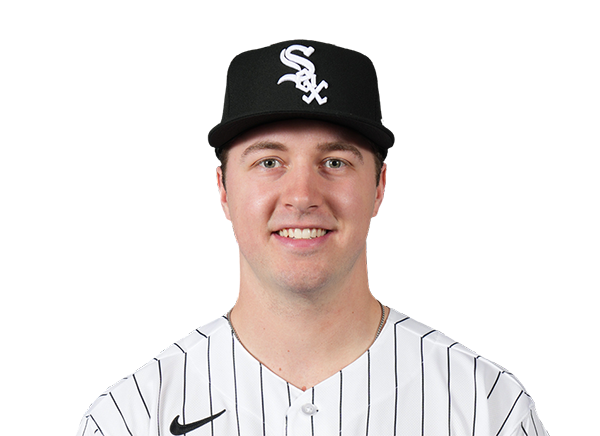 Kyle Teel | 0-3 | 3 | 1 | 0 | 0 | 0 | 0 | 1 | 13 | .189 | .313 | .347 |
 Brenton Doyle | 1-4 | 4 | 2 | 1 | 0 | 0 | 0 | 1 | 14 | .226 | .272 | .321 |
 Colson Montgomery | 2-4 | 4 | 1 | 2 | 3 | 0 | 0 | 2 | 16 | .206 | .291 | .422 |
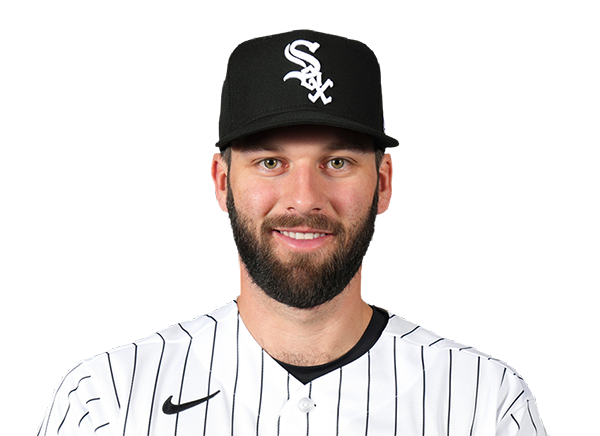 Tristan Peters | 0-1 | 1 | 0 | 0 | 0 | 0 | 1 | 1 | 11 | .272 | .344 | .451 |
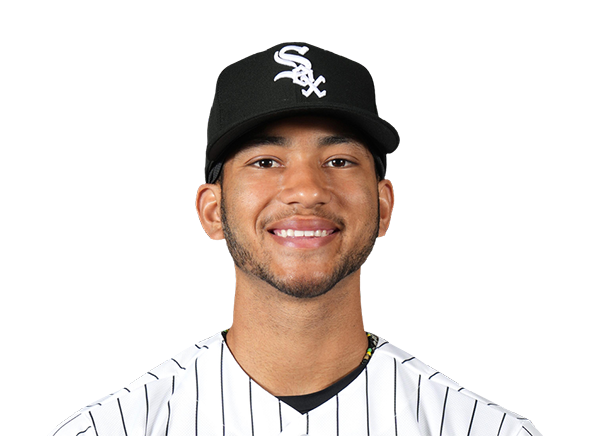 Braden Montgomery | 0-2 | 2 | 0 | 0 | 0 | 0 | 0 | 1 | 9 | .207 | .303 | .332 |
Detroit Tigers
| Player | IP | H | R | ER | BB | K | HR | PC-ST | ERA | PC |
|---|---|---|---|---|---|---|---|---|---|---|
|
Andrew Sears | 0.2 | 1 | 6 | 0 | 3 | 0 | 0 | 37-19 | 5.19 | 37 |
 Beau Brieske | 2.1 | 5 | 2 | 2 | 0 | 4 | 1 | 49-31 | 5.23 | 49 |
 Brant Hurter | 1.2 | 1 | 0 | 0 | 1 | 0 | 0 | 21-12 | 2.56 | 21 |
 Tyler Kinley | 1.1 | 0 | 0 | 0 | 0 | 0 | 0 | 17-13 | 3.44 | 17 |
 Drew Sommers | 2.0 | 0 | 0 | 0 | 0 | 5 | 0 | 22-19 | 3.32 | 22 |
 Kenley Jansen | 1.0 | 0 | 0 | 0 | 0 | 1 | 0 | 10-7 | 3.35 | 10 |
Chicago White Sox
| Player | IP | H | R | ER | BB | K | HR | PC-ST | ERA | PC |
|---|---|---|---|---|---|---|---|---|---|---|
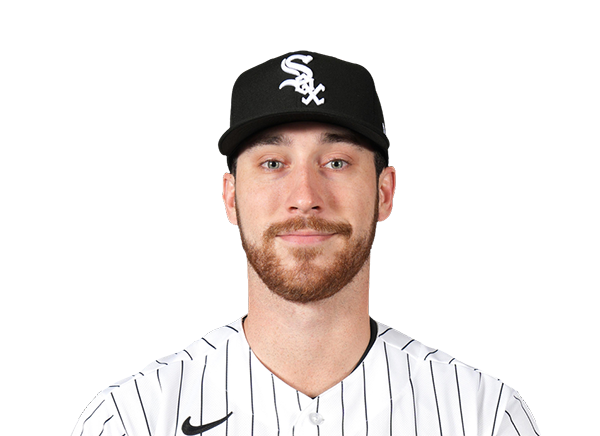 David Sandlin | 4.0 | 7 | 5 | 5 | 1 | 4 | 0 | 74-48 | 6.29 | 74 |
 Hagen Smith | 1.0 | 0 | 0 | 0 | 1 | 3 | 0 | 20-10 | 1.09 | 20 |
 Chris Murphy | 1.0 | 2 | 1 | 1 | 0 | 1 | 0 | 19-15 | 4.81 | 19 |
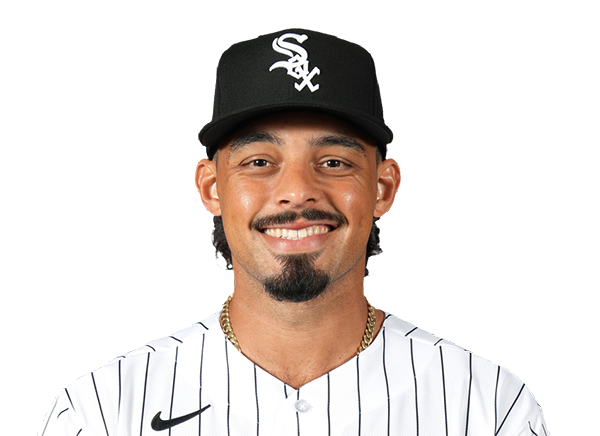 Jordan Hicks | 0.2 | 0 | 0 | 0 | 2 | 1 | 0 | 23-11 | 4.11 | 23 |
 Sean Newcomb | 0.2 | 2 | 3 | 3 | 1 | 0 | 1 | 24-15 | 3.24 | 24 |
 Bryan Hudson | 0.1 | 4 | 2 | 2 | 0 | 0 | 1 | 14-9 | 3.03 | 14 |
 Trevor Richards | 1.1 | 1 | 0 | 0 | 0 | 1 | 0 | 19-14 | 3.45 | 19 |
H2H / Season Series
CHW8–11
DET
CHW3–1
DET
DET5–7
CHW
DET3–4
CHW
DET5–9
CHW
DET5–4
CHW
DET4–1
CHW
DET4–3
CHW
CHW2–1
DET
CHW7–1
DET
Last 5 Games
| Date | Opponent | Result |
|---|---|---|
| Sep 18 | @ CHW | W11–8 |
| Sep 17 | @ CHW | L1–3 |
| Sep 16 |  @ TOR | L1–5 |
| Sep 15 | @ TOR | W10–1 |
| Sep 14 | @ TOR | W6–5 |
| Date | Opponent | Result |
|---|---|---|
| Sep 18 | vs DET | L8–11 |
| Sep 17 | vs DET | W3–1 |
| Sep 16 |  @ CLE | L3–6 |
| Sep 15 | @ CLE | L6–7 |
| Sep 14 | @ CLE | W7–3 |
Standings
American League
| Team | W | L | PCT | GB | DIFF | STRK |
|---|---|---|---|---|---|---|
1 Rays | 93 | 60 | .608 | - | +78 | L1 |
| 2Guardians | 79 | 75 | .513 | 14.5 | -5 | W3 |
3 Astros | 77 | 77 | .500 | 16.5 | -54 | L1 |
4 Yankees | 89 | 64 | .582 | 4 | +143 | W1 |
5 Red Sox | 84 | 70 | .545 | 9.5 | +85 | W2 |
| 6White Sox | 78 | 76 | .506 | 15.5 | +33 | L1 |
7 Rangers | 77 | 77 | .500 | 16.5 | -33 | W1 |
| 8Blue Jays | 76 | 78 | .494 | 17.5 | -43 | L1 |
9 Orioles | 75 | 79 | .487 | 18.5 | -27 | L1 |
| 10Tigers | 73 | 81 | .474 | 20.5 | +77 | W1 |
11 Mariners | 72 | 82 | .468 | 21.5 | -55 | W2 |
12 Twins | 72 | 82 | .468 | 21.5 | -71 | W1 |
13 Royals | 67 | 87 | .435 | 26.5 | -100 | L2 |
14 Athletics | 61 | 93 | .396 | 32.5 | -216 | L4 |
15 Angels | 59 | 95 | .383 | 34.5 | -80 | L1 |
National League
| Team | W | L | PCT | GB | DIFF | STRK |
|---|---|---|---|---|---|---|
1 Brewers | 96 | 58 | .623 | - | +198 | W1 |
2 Dodgers | 94 | 60 | .610 | 2 | +185 | W2 |
3 Braves | 90 | 64 | .584 | 6 | +115 | W1 |
4 Phillies | 85 | 69 | .552 | 11 | +31 | L1 |
5 Cubs | 85 | 69 | .552 | 11 | +141 | L1 |
6 Padres | 85 | 69 | .552 | 11 | +36 | W3 |
7 Diamondbacks | 80 | 74 | .519 | 16 | -7 | L3 |
8 Pirates | 77 | 77 | .500 | 19 | +27 | W2 |
9 Marlins | 76 | 78 | .494 | 20 | +2 | L1 |
10 Cardinals | 75 | 79 | .487 | 21 | -22 | L3 |
11 Nationals | 72 | 82 | .468 | 24 | +11 | W1 |
12 Reds | 72 | 82 | .468 | 24 | -152 | W1 |
13 Mets | 70 | 84 | .455 | 26 | -43 | W1 |
14 Giants | 64 | 90 | .416 | 32 | -76 | L1 |
15 Rockies | 56 | 98 | .364 | 40 | -178 | L3 |
DET
VS
CHW
Pitchers
Andrew Sears
Catchers
Eduardo Valencia
Infielders
Kevin McGonigle
Gleyber Torres
Spencer Torkelson
Hao-Yu Lee
Outfielders
Riley Greene
Zach McKinstry
Max Clark
Designated Hitters
Colt Keith
Pitchers
David Sandlin
Catchers
Kyle Teel
Infielders
Miguel Vargas
Munetaka Murakami
Chase Meidroth
Colson Montgomery
Outfielders
Randal Grichuk
Brenton Doyle
Tristan Peters
Designated Hitters
Tommy Pham
Tigers
VS
White Sox
Batting
154
Team Games Played
154
5196
At Bats
5159
1251
Hits
1208
660
Runs Batted In
687
173
Home Runs
197
55
Stolen Bases
86
.241
Batting Average
.234
695
Runs
722
243
Doubles
240
33
Triples
18
2079
Total Bases
2075
550
Walks
561
1336
Strikeouts
1423
.318
On Base Percentage
.319
.400
Slugging Percentage
.402
.719
OBP Pct + SLG Pct
.721
154
Games Played
154
154
Games Started
154
62
Hit By Pitch
93
0.0
Wins Above Replacement
0.0
0.0
Offensive Wins Above Replacement
0.0
22
Caught Stealing
34
1
Is Qualified
1
676.3
Runs Created
685.6
4.4
Runs Created Per 27 Outs
4.5
.094
Walks Per Plate Appearance
.096
0.41
Walk To Strikeout Ratio
0.39
.159
Isolated Power
.168
.272
Secondary Average
.287
3.93
Pitches Per Plate Appearance
3.88
449
Extra Base Hits
455
5864
Plate Appearances
5874
30.0
At Bats Per Home Run
26.2
8
Sacrifice Hit
26
42
Sacrifice Flies
33
Pitching
154
Team Games Played
154
54
Quality Starts
32
73
Wins
78
81
Losses
76
31
Saves
39
70
Holds
60
1185
Hits
1250
550
Earned runs
631
157
Home Runs
172
483
Walks
550
1234
Strikeouts
1268
8.1
Strikeouts Per 9 Innings
8.3
142.5
Pitches Per Start
150.6
1.22
Walks Plus Hits Per Inning Pitched
1.31
3.63
Earned Run Average
4.15
81
Losses
76
1364.0
Innings pitched
1369.2
.474
Win Percentage
.506
63
Save Opportunities
69
.232
Opponent Batting Average
.242
.307
Opponent's On-base pct.
.323
.378
Opponent's Slugging pct.
.398
.685
Opponent's OPB Pct + SLG Pct
.721
5100
At Bats
5161
234
Doubles
245
20
Triples
22
76
Batters Hit
86
85
Stolen Bases
119
154
Games Played
154
0
Complete Games
0
15
Shutouts
9
36
Wild Pitches
66
586
Runs Batted In
663
3
Balks
9
1364.0
Innings pitched
1369.2
8.1
Strikeouts Per 9 Innings
8.3
31
Caught Stealing
40
154
Games Started
154
0.0
Wins Above Replacement
0.0
1
Is Qualified
1
618
Runs
689
550
Earned Runs
631
1930
Total Bases
2055
Fielding
154
Team Games Played
154
1364
Full Innings
1370
5556
Total Chances
5445
4092
Putouts
4109
1389
Assists
1256
75
Errors
80
243
Double Plays
240
0.987
Fielding Percentage
0.985
36.2
Range Factor
35.3
0.0
Zone Rating
0.0
154
Games Played
154
0
Games Started
0
0.0
Defensive Wins Above Replacement
0.0
1
Qualified
1