

Tigers vs White Sox Live Score (19 Sep, 2026)
Game Information
Stage
STD
Season
2026
First Pitch
Sat, Sep 19, 2:10 pm
Venue
Rate Field
Location
Chicago, Illinois
Venue Type
Outdoor
Broadcast
MLB.TV
Attendance
30,631
Live Situation
2Balls
2Strikes
0Outs
—Pitcher
—At Bat
Pitch Sequence
1
BALL
Sinker
99 MPH
2
BALL
Curve
83 MPH
3
STRIKE LOOKING
Slider
89 MPH
4
STRIKE SWINGING
Slider
90 MPH
5
BALL IN PLAY
Slider
88 MPH
Injury Report







Team Stats
 DET
CHW


1
Runs
3
8
Hits
4
1
Errors
0
0
Home Runs
1
3
Walks
2
9
Strikeouts
12
Player Box Score
Detroit Tigers
| Player | H-AB | AB | R | H | RBI | HR | BB | K | #P | AVG | OBP | SLG |
|---|---|---|---|---|---|---|---|---|---|---|---|---|
 Kevin McGonigle | 1-4 | 4 | 0 | 1 | 1 | 0 | 0 | 0 | 23 | .276 | .377 | .427 |
 Hao-Yu Lee | 2-5 | 5 | 0 | 2 | 0 | 0 | 0 | 3 | 23 | .266 | .321 | .432 |
 Colt Keith | 0-3 | 3 | 0 | 0 | 0 | 0 | 0 | 1 | 10 | .258 | .322 | .406 |
 Spencer Torkelson | 0-2 | 2 | 0 | 0 | 0 | 0 | 0 | 1 | 10 | .228 | .323 | .421 |
 Riley Greene | 2-3 | 3 | 0 | 2 | 0 | 0 | 0 | 0 | 11 | .286 | .373 | .484 |
 Dillon Dingler | 1-4 | 4 | 0 | 1 | 0 | 0 | 0 | 1 | 14 | .243 | .301 | .450 |
 Max Clark | 1-3 | 3 | 0 | 1 | 0 | 0 | 1 | 0 | 14 | .278 | .360 | .437 |
 Ben Malgeri | 0-2 | 2 | 1 | 0 | 0 | 0 | 1 | 1 | 18 | .231 | .347 | .346 |
 Brett Callahan | 1-3 | 3 | 0 | 1 | 0 | 0 | 0 | 1 | 10 | .220 | .288 | .356 |
 Eduardo Valencia | 0-1 | 1 | 0 | 0 | 0 | 0 | 0 | 0 | 4 | .324 | .355 | .600 |
 Zach McKinstry | 0-0 | 0 | 0 | 0 | 0 | 0 | 0 | 0 | 0 | .202 | .286 | .298 |
 John Peck | 0-3 | 3 | 0 | 0 | 0 | 0 | 1 | 1 | 15 | .208 | .328 | .229 |
Chicago White Sox
| Player | H-AB | AB | R | H | RBI | HR | BB | K | #P | AVG | OBP | SLG |
|---|---|---|---|---|---|---|---|---|---|---|---|---|
 Sam Antonacci | 0-3 | 3 | 0 | 0 | 1 | 0 | 0 | 0 | 11 | .268 | .362 | .388 |
 Randal Grichuk | 0-0 | 0 | 0 | 0 | 0 | 0 | 0 | 0 | 0 | .285 | .313 | .553 |
 Kyle Teel | 0-4 | 4 | 0 | 0 | 0 | 0 | 0 | 2 | 22 | .182 | .302 | .333 |
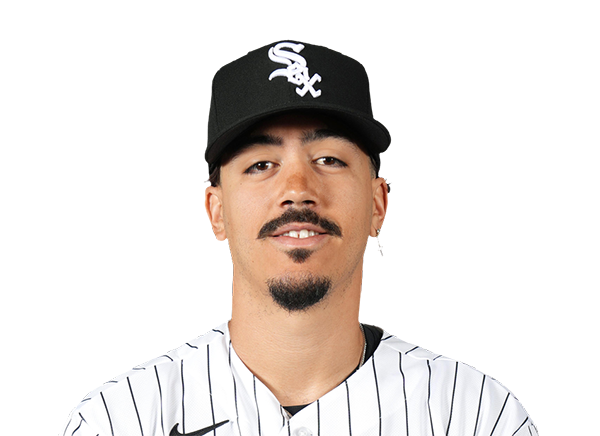 Miguel Vargas | 1-2 | 2 | 2 | 1 | 1 | 1 | 2 | 0 | 11 | .250 | .359 | .482 |
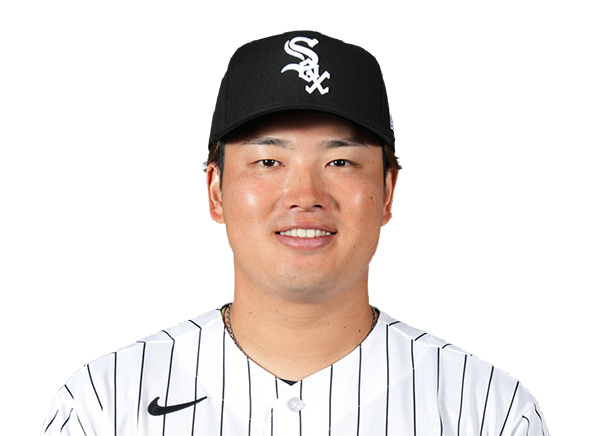 Munetaka Murakami | 1-4 | 4 | 0 | 1 | 1 | 0 | 0 | 2 | 19 | .203 | .344 | .465 |
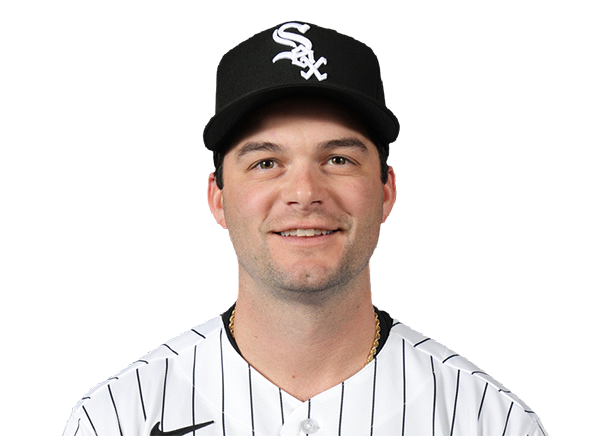 Andrew Benintendi | 0-3 | 3 | 0 | 0 | 0 | 0 | 0 | 3 | 12 | .243 | .303 | .415 |
 Colson Montgomery | 0-3 | 3 | 0 | 0 | 0 | 0 | 0 | 3 | 18 | .204 | .290 | .420 |
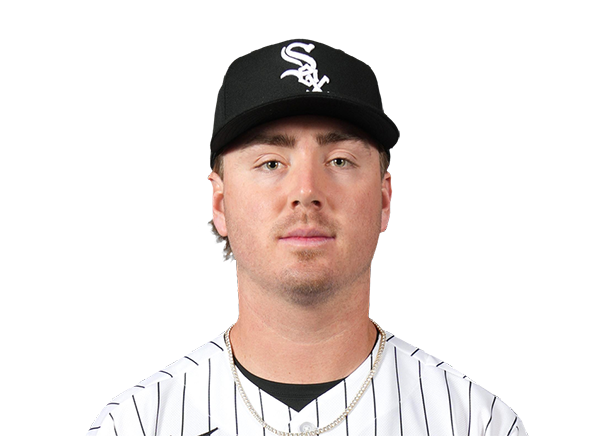 Chase Meidroth | 0-2 | 2 | 0 | 0 | 0 | 0 | 0 | 1 | 11 | .268 | .345 | .398 |
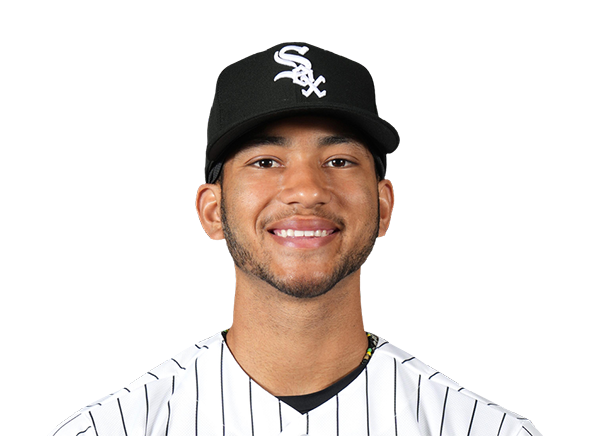 Braden Montgomery | 1-3 | 3 | 1 | 1 | 0 | 0 | 0 | 0 | 13 | .208 | .303 | .336 |
 Brenton Doyle | 1-3 | 3 | 0 | 1 | 0 | 0 | 0 | 1 | 10 | .228 | .273 | .321 |
Detroit Tigers
| Player | IP | H | R | ER | BB | K | HR | PC-ST | ERA | PC |
|---|---|---|---|---|---|---|---|---|---|---|
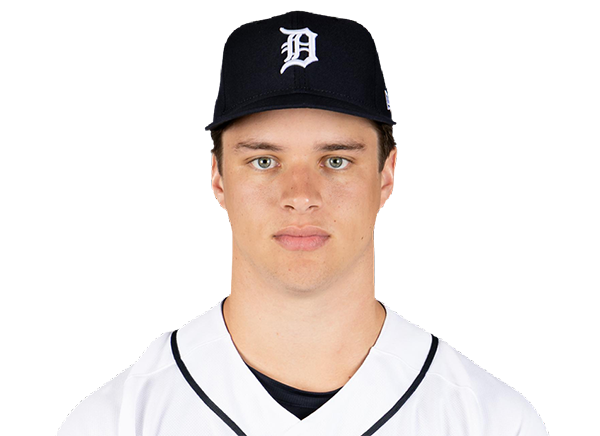 Jackson Jobe | 6.0 | 4 | 3 | 3 | 1 | 9 | 1 | 96-67 | 3.98 | 96 |
 Jacob Waguespack | 2.0 | 0 | 0 | 0 | 1 | 3 | 0 | 31-17 | 2.47 | 31 |
Chicago White Sox
| Player | IP | H | R | ER | BB | K | HR | PC-ST | ERA | PC |
|---|---|---|---|---|---|---|---|---|---|---|
 Sean Burke | 6.0 | 5 | 1 | 1 | 3 | 5 | 0 | 97-63 | 3.40 | 97 |
 Noah Schultz | 1.2 | 2 | 0 | 0 | 0 | 4 | 0 | 32-22 | 5.74 | 32 |
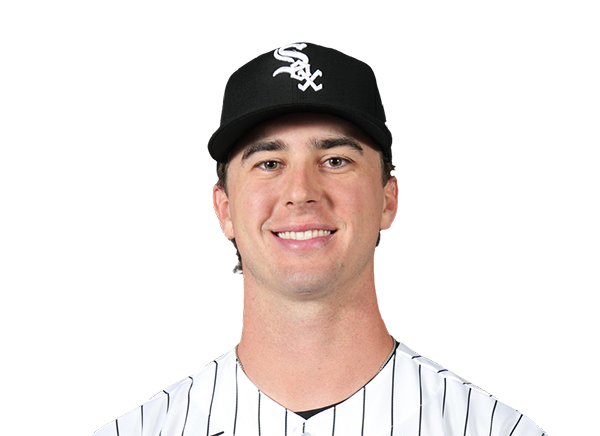 Grant Taylor | 1.1 | 1 | 0 | 0 | 0 | 0 | 0 | 23-16 | 2.30 | 23 |
H2H / Season Series
CHW3–1
DET
CHW8–11
DET
CHW3–1
DET
DET5–7
CHW
DET3–4
CHW
DET5–9
CHW
DET5–4
CHW
DET4–1
CHW
DET4–3
CHW
CHW2–1
DET
Last 5 Games
| Date | Opponent | Result |
|---|---|---|
| Sep 19 | @ CHW | L1–3 |
| Sep 18 | @ CHW | W11–8 |
| Sep 17 | @ CHW | L1–3 |
| Sep 16 |  @ TOR | L1–5 |
| Sep 15 | @ TOR | W10–1 |
| Date | Opponent | Result |
|---|---|---|
| Sep 19 | vs DET | W3–1 |
| Sep 18 | vs DET | L8–11 |
| Sep 17 | vs DET | W3–1 |
| Sep 16 |  @ CLE | L3–6 |
| Sep 15 | @ CLE | L6–7 |
Standings
American League
| Team | W | L | PCT | GB | DIFF | STRK |
|---|---|---|---|---|---|---|
1 Rays | 94 | 60 | .610 | - | +79 | W1 |
| 2Guardians | 80 | 75 | .516 | 14.5 | +1 | W4 |
3 Rangers | 78 | 77 | .503 | 16.5 | -29 | W2 |
4 Yankees | 89 | 65 | .578 | 5 | +141 | L1 |
5 Red Sox | 84 | 71 | .542 | 10.5 | +84 | L1 |
| 6White Sox | 79 | 76 | .510 | 15.5 | +35 | W1 |
7 Astros | 77 | 78 | .497 | 17.5 | -57 | L2 |
| 8Blue Jays | 76 | 79 | .490 | 18.5 | -47 | L2 |
9 Orioles | 75 | 80 | .484 | 19.5 | -28 | L2 |
| 10Tigers | 73 | 82 | .471 | 21.5 | +75 | L1 |
11 Mariners | 72 | 83 | .465 | 22.5 | -57 | L1 |
12 Twins | 72 | 83 | .465 | 22.5 | -72 | L1 |
13 Royals | 67 | 88 | .432 | 27.5 | -101 | L3 |
14 Athletics | 61 | 94 | .394 | 33.5 | -222 | L5 |
15 Angels | 60 | 95 | .387 | 34.5 | -79 | W1 |
National League
| Team | W | L | PCT | GB | DIFF | STRK |
|---|---|---|---|---|---|---|
1 Brewers | 97 | 58 | .626 | - | +199 | W2 |
2 Dodgers | 95 | 60 | .613 | 2 | +191 | W3 |
3 Braves | 91 | 64 | .587 | 6 | +118 | W2 |
4 Cubs | 86 | 69 | .555 | 11 | +144 | W1 |
5 Padres | 86 | 69 | .555 | 11 | +37 | W4 |
6 Phillies | 85 | 70 | .548 | 12 | +24 | L2 |
7 Diamondbacks | 81 | 74 | .523 | 16 | -5 | W1 |
8 Pirates | 78 | 77 | .503 | 19 | +28 | W3 |
9 Marlins | 76 | 79 | .490 | 21 | +1 | L2 |
10 Cardinals | 75 | 80 | .484 | 22 | -25 | L4 |
11 Nationals | 73 | 82 | .471 | 24 | +14 | W2 |
12 Reds | 72 | 83 | .465 | 25 | -155 | L1 |
13 Mets | 71 | 84 | .458 | 26 | -36 | W2 |
14 Giants | 64 | 91 | .413 | 33 | -82 | L2 |
15 Rockies | 57 | 98 | .368 | 40 | -176 | W1 |
DET
VS
CHW
Pitchers
Jackson Jobe
Catchers
Dillon Dingler
Infielders
Kevin McGonigle
Hao-Yu Lee
Colt Keith
John Peck
Outfielders
Max Clark
Ben Malgeri
Brett Callahan
Designated Hitters
Riley Greene
Pitchers
Sean Burke
Catchers
Kyle Teel
Infielders
Miguel Vargas
Munetaka Murakami
Colson Montgomery
Chase Meidroth
Outfielders
Sam Antonacci
Braden Montgomery
Brenton Doyle
Designated Hitters
Andrew Benintendi
Tigers
VS
White Sox
Batting
155
Team Games Played
155
5229
At Bats
5186
1259
Hits
1212
661
Runs Batted In
690
173
Home Runs
198
55
Stolen Bases
87
.241
Batting Average
.234
696
Runs
725
243
Doubles
241
33
Triples
18
2087
Total Bases
2083
553
Walks
563
1345
Strikeouts
1435
.319
On Base Percentage
.318
.399
Slugging Percentage
.402
.718
OBP Pct + SLG Pct
.720
155
Games Played
155
155
Games Started
155
64
Hit By Pitch
94
0.0
Wins Above Replacement
0.0
0.0
Offensive Wins Above Replacement
0.0
22
Caught Stealing
34
1
Is Qualified
1
679.2
Runs Created
687.3
4.4
Runs Created Per 27 Outs
4.5
.094
Walks Per Plate Appearance
.095
0.41
Walk To Strikeout Ratio
0.39
.158
Isolated Power
.168
.270
Secondary Average
.287
3.93
Pitches Per Plate Appearance
3.88
449
Extra Base Hits
457
5903
Plate Appearances
5905
30.2
At Bats Per Home Run
26.2
8
Sacrifice Hit
26
43
Sacrifice Flies
34
Pitching
155
Team Games Played
155
55
Quality Starts
33
73
Wins
79
82
Losses
76
31
Saves
40
70
Holds
61
1189
Hits
1258
553
Earned runs
632
158
Home Runs
172
485
Walks
553
1246
Strikeouts
1277
8.2
Strikeouts Per 9 Innings
8.3
142.4
Pitches Per Start
150.6
1.22
Walks Plus Hits Per Inning Pitched
1.31
3.63
Earned Run Average
4.13
82
Losses
76
1372.0
Innings pitched
1378.2
.471
Win Percentage
.510
63
Save Opportunities
70
.232
Opponent Batting Average
.242
.306
Opponent's On-base pct.
.323
.378
Opponent's Slugging pct.
.397
.684
Opponent's OPB Pct + SLG Pct
.720
5127
At Bats
5194
235
Doubles
245
20
Triples
22
77
Batters Hit
88
86
Stolen Bases
119
155
Games Played
155
0
Complete Games
0
15
Shutouts
9
36
Wild Pitches
66
589
Runs Batted In
664
3
Balks
9
1372.0
Innings pitched
1378.2
8.2
Strikeouts Per 9 Innings
8.3
31
Caught Stealing
40
155
Games Started
155
0.0
Wins Above Replacement
0.0
1
Is Qualified
1
621
Runs
690
553
Earned Runs
632
1938
Total Bases
2063
Fielding
155
Team Games Played
155
1372
Full Innings
1379
5586
Total Chances
5482
4116
Putouts
4136
1394
Assists
1266
76
Errors
80
243
Double Plays
241
0.986
Fielding Percentage
0.985
36.1
Range Factor
35.3
0.0
Zone Rating
0.0
155
Games Played
155
0
Games Started
0
0.0
Defensive Wins Above Replacement
0.0
1
Qualified
1