

Tigers vs Yankees Live Score (21 Feb, 2026)
Game Information
Stage
EXH
Season
2026
First Pitch
Sat, Feb 21, 1:05 pm
Venue
George M. Steinbrenner Field
Location
Tampa, Florida
Venue Type
Outdoor
Broadcast
MLB.TV
Attendance
9,778
Live Situation
2Balls
3Strikes
0Outs
—Pitcher
—At Bat
Pitch Sequence
1
STRIKE FOUL
Four-seam FB
95 MPH
2
STRIKE LOOKING
Four-seam FB
95 MPH
3
BALL
Four-seam FB
95 MPH
4
BALL
Slider
86 MPH
5
STRIKE FOUL
Cutter
92 MPH
6
STRIKE SWINGING
Four-seam FB
96 MPH
Injury Report

Team Stats
 DET
NYY


3
Runs
20
5
Hits
18
2
Errors
1
1
Home Runs
6
6
Walks
11
6
Strikeouts
9
Player Box Score
Detroit Tigers
| Player | H-AB | AB | R | H | RBI | HR | BB | K | #P | AVG | OBP | SLG |
|---|---|---|---|---|---|---|---|---|---|---|---|---|
 Jahmai Jones | 0-2 | 2 | 0 | 0 | 0 | 0 | 1 | 0 | 0 | .000 | .333 | .000 |
 John Peck | 0-1 | 1 | 0 | 0 | 0 | 0 | 1 | 1 | 0 | .000 | .500 | .000 |
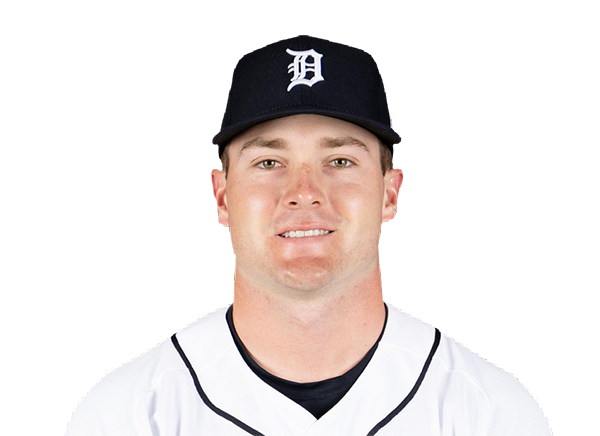 Kevin McGonigle | 1-2 | 2 | 1 | 1 | 0 | 0 | 0 | 0 | 0 | .500 | .500 | .500 |
 Max Clark | 1-3 | 3 | 0 | 1 | 0 | 0 | 0 | 1 | 0 | .333 | .333 | .333 |
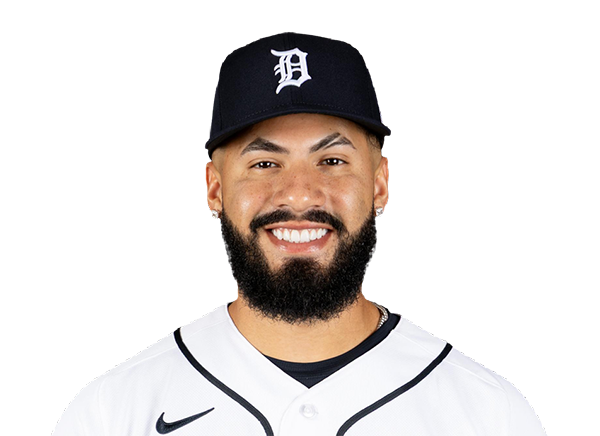 Gleyber Torres | 1-3 | 3 | 0 | 1 | 0 | 0 | 0 | 0 | 0 | .333 | .333 | .333 |
 Max Anderson | 0-1 | 1 | 0 | 0 | 0 | 0 | 0 | 0 | 0 | .000 | .000 | .000 |
 Colt Keith | 0-1 | 1 | 0 | 0 | 0 | 0 | 1 | 1 | 0 | .000 | .500 | .000 |
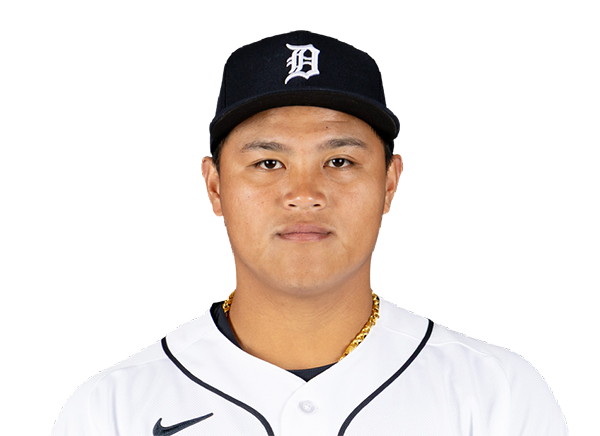 Hao-Yu Lee | 1-2 | 2 | 0 | 1 | 0 | 0 | 0 | 0 | 0 | .500 | .500 | .500 |
 Jake Rogers | 0-3 | 3 | 0 | 0 | 0 | 0 | 0 | 1 | 0 | .000 | .000 | .000 |
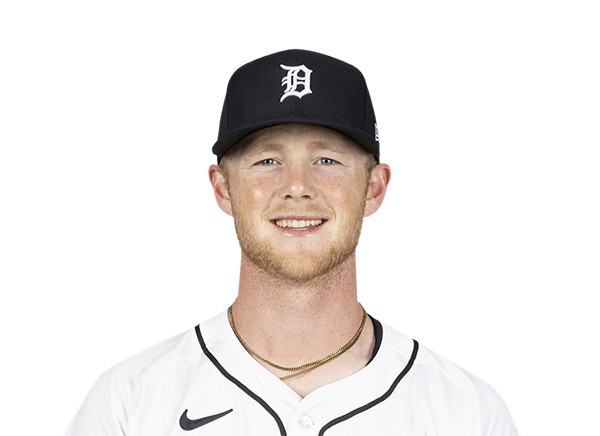 Justice Bigbie | 0-1 | 1 | 0 | 0 | 0 | 0 | 0 | 1 | 0 | .000 | .000 | .000 |
 Jace Jung | 0-2 | 2 | 0 | 0 | 0 | 0 | 0 | 0 | 0 | .000 | .000 | .000 |
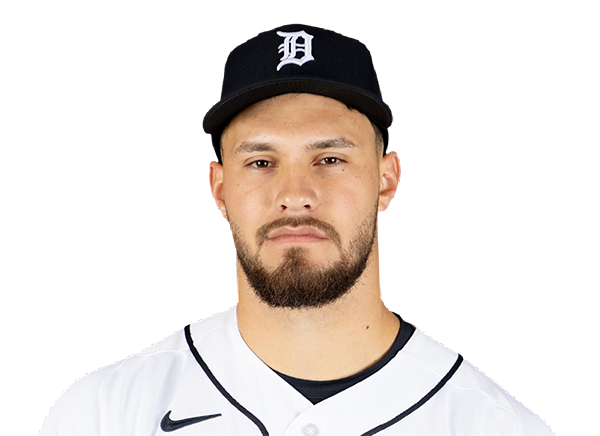 Josue Briceno | 0-2 | 2 | 0 | 0 | 0 | 0 | 0 | 1 | 0 | .000 | .000 | .000 |
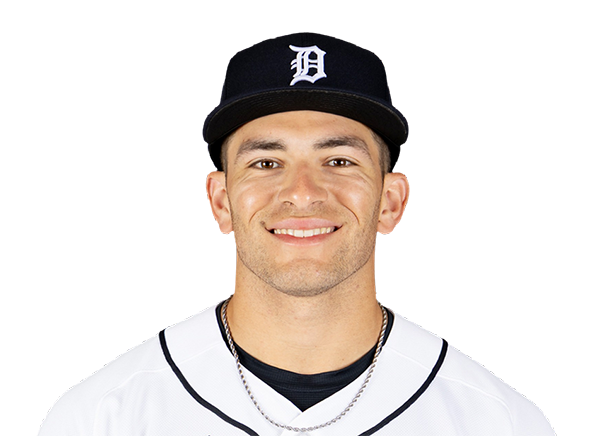 Trei Cruz | 0-2 | 2 | 0 | 0 | 0 | 0 | 1 | 0 | 0 | .000 | .333 | .000 |
 Cal Stevenson | 0-0 | 0 | 0 | 0 | 0 | 0 | 1 | 0 | 0 | .000 | 1.000 | .000 |
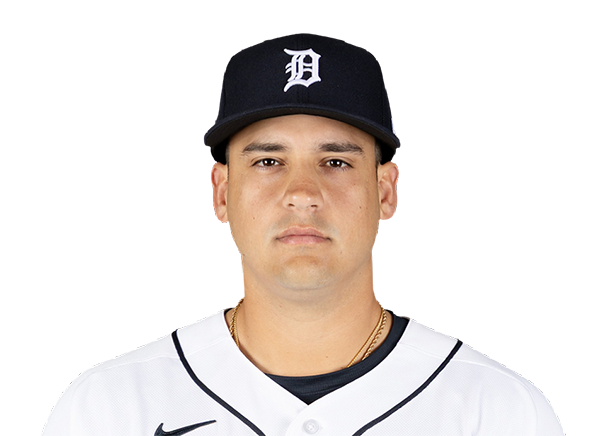 Eduardo Valencia | 0-2 | 2 | 0 | 0 | 0 | 0 | 0 | 0 | 0 | .000 | .000 | .000 |
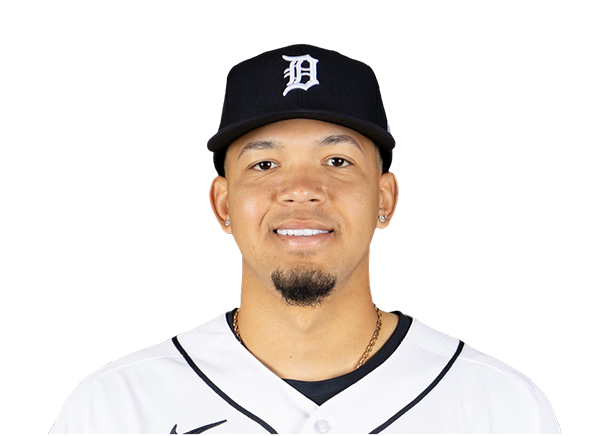 Thayron Liranzo | 0-0 | 0 | 1 | 0 | 0 | 0 | 1 | 0 | 0 | .000 | 1.000 | .000 |
 Samuel Gil | 0-1 | 1 | 0 | 0 | 0 | 0 | 0 | 0 | 0 | .000 | .000 | .000 |
 Corey Julks | 1-2 | 2 | 1 | 1 | 1 | 1 | 0 | 0 | 0 | .500 | .500 | 2.000 |
 Ben Malgeri | 0-2 | 2 | 0 | 0 | 0 | 0 | 0 | 0 | 0 | .000 | .000 | .000 |
New York Yankees
| Player | H-AB | AB | R | H | RBI | HR | BB | K | #P | AVG | OBP | SLG |
|---|---|---|---|---|---|---|---|---|---|---|---|---|
 Jasson Dominguez | 1-1 | 1 | 2 | 1 | 1 | 0 | 1 | 0 | 0 | 1.000 | .667 | 2.000 |
 George Lombard Jr. | 0-1 | 1 | 1 | 0 | 1 | 0 | 2 | 0 | 0 | .000 | .667 | .000 |
 Aaron Judge | 2-3 | 3 | 2 | 2 | 4 | 2 | 0 | 0 | 0 | .667 | .667 | 2.667 |
|
Garrett Martin | 0-2 | 2 | 2 | 0 | 1 | 0 | 1 | 1 | 0 | .000 | .250 | .000 |
 Ryan McMahon | 1-3 | 3 | 1 | 1 | 0 | 0 | 0 | 1 | 0 | .333 | .333 | .667 |
 Roderick Arias | 2-3 | 3 | 1 | 2 | 4 | 1 | 0 | 1 | 0 | .667 | .667 | 1.667 |
 Paul Goldschmidt | 2-3 | 3 | 0 | 2 | 2 | 0 | 0 | 0 | 0 | .667 | .667 | .667 |
 Marco Luciano | 0-1 | 1 | 1 | 0 | 0 | 0 | 2 | 0 | 0 | .000 | .400 | .000 |
 Seth Brown | 1-3 | 3 | 0 | 1 | 0 | 0 | 0 | 0 | 0 | .333 | .333 | .333 |
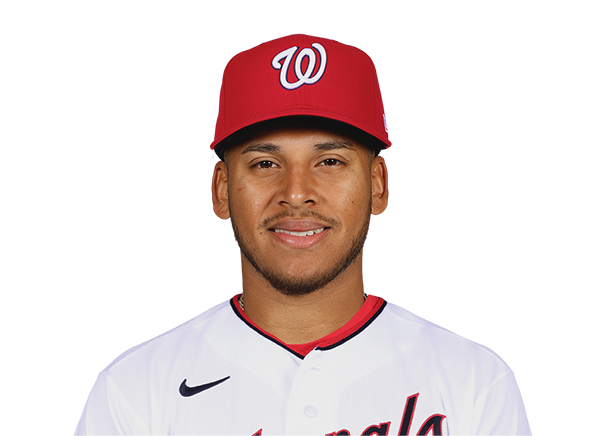 Jorbit Vivas | 1-3 | 3 | 1 | 1 | 0 | 0 | 0 | 0 | 0 | .333 | .333 | .333 |
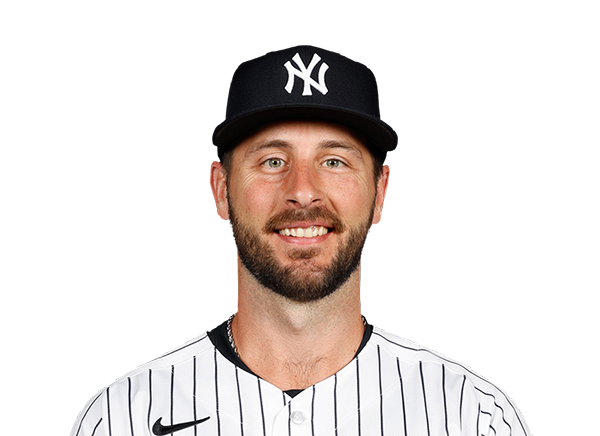 Paul DeJong | 1-2 | 2 | 0 | 1 | 0 | 0 | 1 | 1 | 0 | .500 | .667 | .500 |
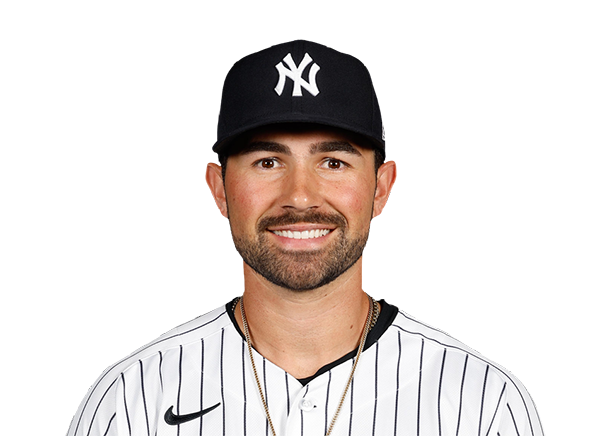 Payton Henry | 3-3 | 3 | 2 | 3 | 1 | 0 | 0 | 0 | 0 | .600 | .600 | .800 |
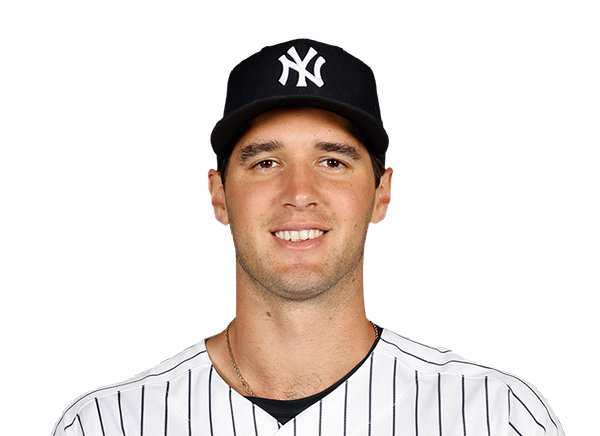 Spencer Jones | 1-3 | 3 | 1 | 1 | 1 | 1 | 0 | 2 | 0 | .333 | .333 | 1.333 |
|
Jackson Castillo | 1-2 | 2 | 2 | 1 | 3 | 1 | 1 | 0 | 0 | .667 | .750 | 1.667 |
 Max Schuemann | 0-1 | 1 | 1 | 0 | 0 | 0 | 2 | 0 | 0 | .000 | .667 | .000 |
|
Tyler Hardman | 1-2 | 2 | 2 | 1 | 1 | 1 | 1 | 1 | 0 | .333 | .500 | 1.333 |
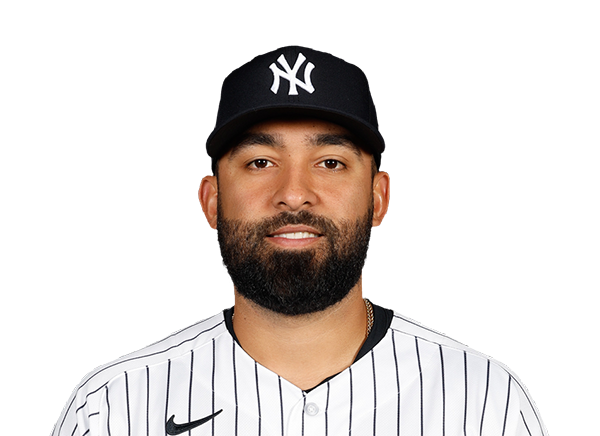 Ali Sanchez | 1-3 | 3 | 1 | 1 | 0 | 0 | 0 | 1 | 0 | .167 | .167 | .167 |
 Duke Ellis | 0-2 | 2 | 0 | 0 | 0 | 0 | 0 | 1 | 0 | .000 | .000 | .000 |
Detroit Tigers
| Player | IP | H | R | ER | BB | K | HR | PC-ST | ERA | PC |
|---|---|---|---|---|---|---|---|---|---|---|
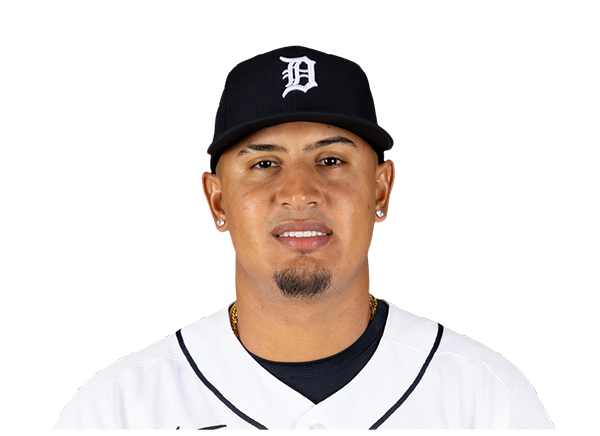 Keider Montero | 2.0 | 3 | 3 | 3 | 1 | 2 | 1 | ----- | 13.50 | -- |
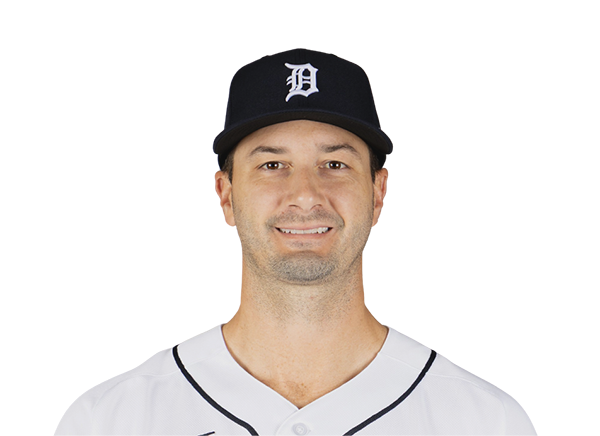 Burch Smith | 1.0 | 4 | 2 | 2 | 0 | 1 | 1 | ----- | 18.00 | -- |
 Ricky Vanasco | 1.0 | 3 | 3 | 3 | 1 | 1 | 1 | ----- | 27.00 | -- |
 Drew Sommers | 1.0 | 0 | 0 | 0 | 2 | 1 | 0 | ----- | 0.00 | -- |
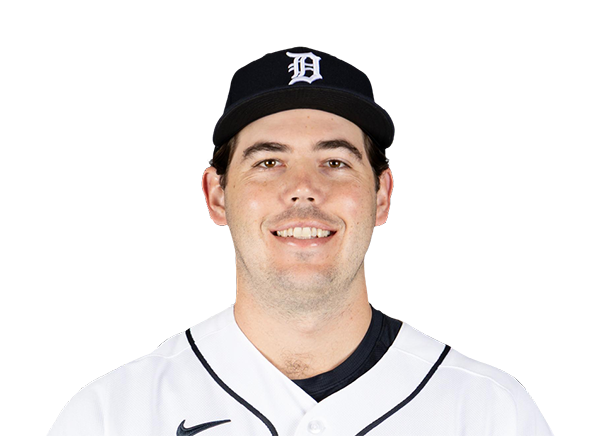 Jack Little | 1.0 | 1 | 2 | 0 | 1 | 1 | 0 | ----- | 0.00 | -- |
 Cole Waites | 0.2 | 2 | 1 | 1 | 2 | 1 | 1 | ----- | 13.50 | -- |
|
Carlos Manuel Pena | 0.1 | 0 | 0 | 0 | 0 | 0 | 0 | ----- | 0.00 | -- |
 Matt Seelinger | 0.1 | 1 | 5 | 5 | 4 | 1 | 0 | ----- | 135.00 | -- |
 Woo-Suk Go | 0.2 | 4 | 4 | 4 | 0 | 1 | 2 | ----- | 54.00 | -- |
New York Yankees
| Player | IP | H | R | ER | BB | K | HR | PC-ST | ERA | PC |
|---|---|---|---|---|---|---|---|---|---|---|
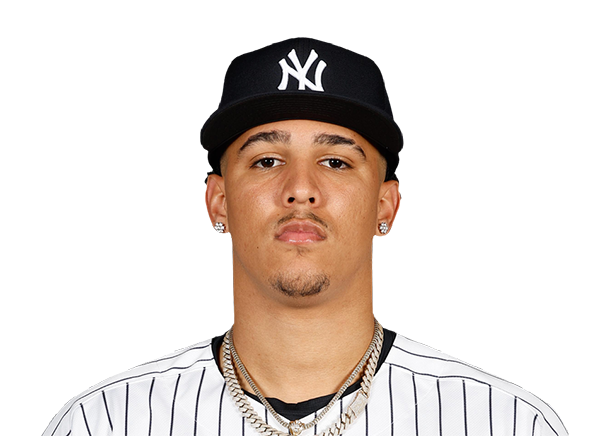 Carlos Lagrange | 2.2 | 3 | 2 | 1 | 2 | 2 | 1 | ----- | 3.38 | -- |
|
William Brian | 0.1 | 0 | 0 | 0 | 0 | 0 | 0 | ----- | 0.00 | -- |
 David Bednar | 1.0 | 0 | 0 | 0 | 1 | 0 | 0 | ----- | 0.00 | -- |
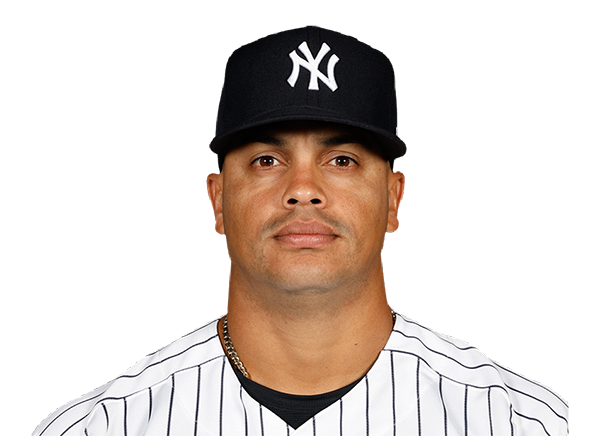 Fernando Cruz | 1.0 | 0 | 0 | 0 | 0 | 0 | 0 | ----- | 0.00 | -- |
 Harrison Cohen | 1.0 | 1 | 0 | 0 | 0 | 0 | 0 | ----- | 0.00 | -- |
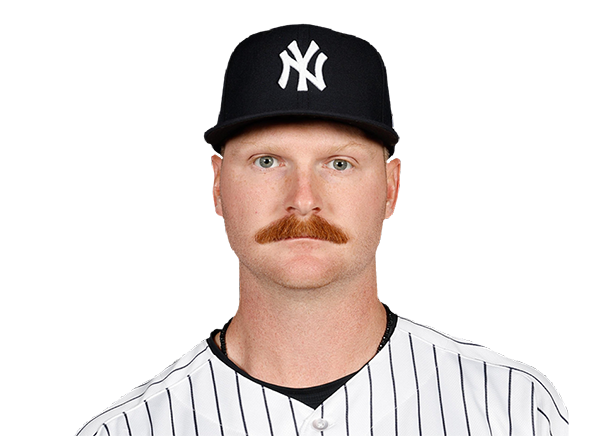 Drake Fellows | 1.0 | 1 | 1 | 0 | 2 | 0 | 0 | ----- | 0.00 | -- |
|
Brock Selvidge | 2.0 | 0 | 0 | 0 | 1 | 4 | 0 | ----- | 0.00 | -- |
H2H / Season Series
DET3–1
NYY
NYY1–12
DET
DET3–4
NYY
NYY20–3
DET
Last 5 Games
| Date | Opponent | Result |
|---|---|---|
| Sep 2 |  @ MIN | W11–6 |
| Sep 1 | @ MIN | L2–15 |
| Aug 31 | @ MIN | L1–11 |
| Aug 30 |  vs LAD | L1–6 |
| Aug 29 | vs LAD | W2–1 |
| Date | Opponent | Result |
|---|---|---|
| Sep 2 |  @ LAA | W6–3 |
| Sep 1 | @ LAA | W7–3 |
| Aug 31 | @ LAA | L1–10 |
| Aug 30 |  vs BOS | W16–1 |
| Aug 29 | vs BOS | W9–2 |
Standings
American League
| Team | W | L | PCT | GB | DIFF | STRK |
|---|---|---|---|---|---|---|
1 Rays | 83 | 56 | .597 | - | +51 | L1 |
2 White Sox | 73 | 66 | .525 | 10 | +43 | L1 |
3 Astros | 71 | 69 | .507 | 12.5 | -42 | W1 |
| 4Yankees | 80 | 60 | .571 | 3.5 | +115 | W2 |
| 5Red Sox | 75 | 65 | .536 | 8.5 | +77 | L2 |
6 Guardians | 70 | 69 | .504 | 13 | -8 | L1 |
7 Rangers | 69 | 71 | .493 | 14.5 | -48 | L1 |
8 Blue Jays | 69 | 71 | .493 | 14.5 | -44 | W1 |
9 Orioles | 69 | 71 | .493 | 14.5 | -20 | L2 |
| 10Twins | 67 | 73 | .479 | 16.5 | -38 | L1 |
11 Mariners | 66 | 74 | .471 | 17.5 | -65 | W2 |
| 12Tigers | 64 | 75 | .460 | 19 | +47 | W1 |
13 Royals | 62 | 78 | .443 | 21.5 | -89 | L3 |
14 Athletics | 54 | 86 | .386 | 29.5 | -194 | W1 |
| 15Angels | 53 | 87 | .379 | 30.5 | -80 | L2 |
National League
| Team | W | L | PCT | GB | DIFF | STRK |
|---|---|---|---|---|---|---|
1 Brewers | 87 | 53 | .621 | - | +172 | W2 |
2 Braves | 83 | 57 | .593 | 4 | +118 | W1 |
| 3Dodgers | 82 | 57 | .590 | 4.5 | +146 | L2 |
4 Phillies | 79 | 61 | .564 | 8 | +36 | L1 |
5 Cubs | 78 | 62 | .557 | 9 | +132 | L2 |
6 Diamondbacks | 74 | 67 | .525 | 13.5 | -1 | W1 |
7 Padres | 73 | 67 | .521 | 14 | +10 | L2 |
8 Marlins | 71 | 69 | .507 | 16 | +18 | W2 |
9 Cardinals | 70 | 70 | .500 | 17 | -8 | W2 |
10 Pirates | 68 | 72 | .486 | 19 | +26 | L1 |
11 Reds | 67 | 73 | .479 | 20 | -108 | W2 |
12 Nationals | 67 | 75 | .472 | 21 | +14 | L1 |
13 Mets | 63 | 77 | .450 | 24 | -50 | W1 |
14 Giants | 58 | 82 | .414 | 29 | -70 | W1 |
15 Rockies | 54 | 86 | .386 | 33 | -140 | W2 |
DET
VS
NYY
Pitchers
Keider Montero
Burch Smith
Ricky Vanasco
Drew Sommers
Jack Little
Cole Waites
Carlos Manuel Pena
Matt Seelinger
Woo-Suk Go
Catchers
Eduardo Valencia
Thayron Liranzo
Infielders
John Peck
Kevin McGonigle
Gleyber Torres
Max Anderson
Colt Keith
Hao-Yu Lee
Jace Jung
Josue Briceno
Outfielders
Jahmai Jones
Max Clark
Trei Cruz
Cal Stevenson
Corey Julks
Ben Malgeri
Designated Hitters
Jake Rogers
Justice Bigbie
Other Players
Samuel Gil
Pitchers
Carlos Lagrange
William Brian
David Bednar
Fernando Cruz
Harrison Cohen
Drake Fellows
Brock Selvidge
Catchers
Payton Henry
Ali Sanchez
Infielders
George Lombard Jr.
Ryan McMahon
Roderick Arias
Seth Brown
Jorbit Vivas
Paul DeJong
Max Schuemann
Tyler Hardman
Outfielders
Jasson Dominguez
Aaron Judge
Garrett Martin
Spencer Jones
Jackson Castillo
Duke Ellis
Designated Hitters
Paul Goldschmidt
Marco Luciano
Tigers
VS
Yankees
Batting
139
Team Games Played
140
4685
At Bats
4632
1115
Hits
1083
582
Runs Batted In
607
157
Home Runs
192
42
Stolen Bases
137
.238
Batting Average
.234
610
Runs
636
217
Doubles
201
28
Triples
17
1859
Total Bases
1894
484
Walks
502
1197
Strikeouts
1288
.315
On Base Percentage
.311
.397
Slugging Percentage
.409
.711
OBP Pct + SLG Pct
.720
139
Games Played
140
139
Games Started
140
57
Hit By Pitch
35
0.0
Wins Above Replacement
0.0
0.0
Offensive Wins Above Replacement
0.0
19
Caught Stealing
43
1
Is Qualified
1
595.6
Runs Created
606.1
4.3
Runs Created Per 27 Outs
4.4
.092
Walks Per Plate Appearance
.096
0.40
Walk To Strikeout Ratio
0.39
.159
Isolated Power
.175
.267
Secondary Average
.304
3.92
Pitches Per Plate Appearance
3.98
402
Extra Base Hits
410
5277
Plate Appearances
5217
29.8
At Bats Per Home Run
24.1
8
Sacrifice Hit
8
38
Sacrifice Flies
36
Pitching
139
Team Games Played
140
51
Quality Starts
56
64
Wins
80
75
Losses
60
27
Saves
40
64
Holds
79
1077
Hits
1047
506
Earned runs
451
143
Home Runs
137
439
Walks
421
1124
Strikeouts
1256
8.2
Strikeouts Per 9 Innings
9.0
142.5
Pitches Per Start
145.0
1.23
Walks Plus Hits Per Inning Pitched
1.17
3.70
Earned Run Average
3.24
75
Losses
60
1231.1
Innings pitched
1251.2
.460
Win Percentage
.571
57
Save Opportunities
66
.233
Opponent Batting Average
.225
.307
Opponent's On-base pct.
.295
.380
Opponent's Slugging pct.
.364
.687
Opponent's OPB Pct + SLG Pct
.659
4617
At Bats
4660
212
Doubles
199
19
Triples
20
64
Batters Hit
54
78
Stolen Bases
64
139
Games Played
140
0
Complete Games
0
14
Shutouts
13
34
Wild Pitches
32
536
Runs Batted In
497
3
Balks
3
1231.1
Innings pitched
1251.2
8.2
Strikeouts Per 9 Innings
9.0
29
Caught Stealing
18
139
Games Started
140
0.0
Wins Above Replacement
0.0
1
Is Qualified
1
563
Runs
521
506
Earned Runs
451
1756
Total Bases
1697
Fielding
139
Team Games Played
140
1231
Full Innings
1252
5003
Total Chances
5056
3694
Putouts
3755
1243
Assists
1220
66
Errors
81
217
Double Plays
201
0.987
Fielding Percentage
0.984
36.1
Range Factor
35.8
0.0
Zone Rating
0.0
139
Games Played
140
0
Games Started
0
0.0
Defensive Wins Above Replacement
0.0
1
Qualified
1