

Twins vs Angels Live Score (18 Sep, 2026)
Game Information
Stage
STD
Season
2026
First Pitch
Thu, Sep 17, 9:38 pm
Venue
Angel Stadium
Location
Anaheim, California
Venue Type
Outdoor
Broadcast
MLB.TV
Attendance
34,251
Inning Scores
Live Situation
0Balls
0Strikes
0Outs
—Pitcher
—At Bat
Pitch Sequence
1
BALL IN PLAY
Sinker
90 MPH
Injury Report


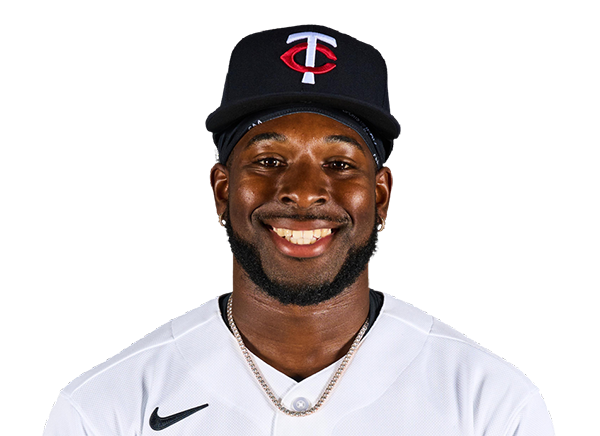
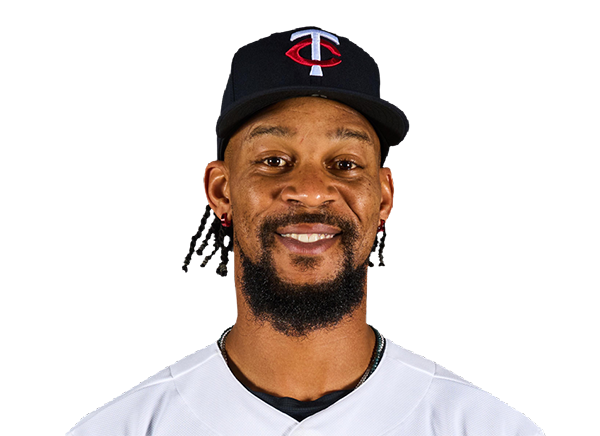
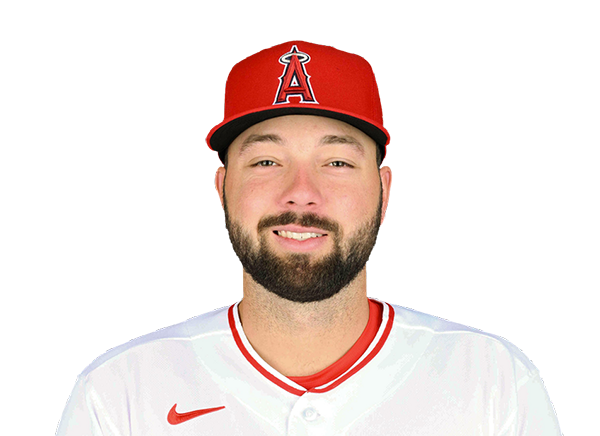


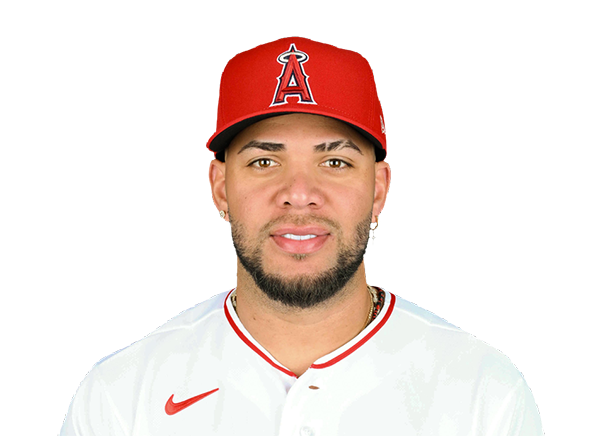
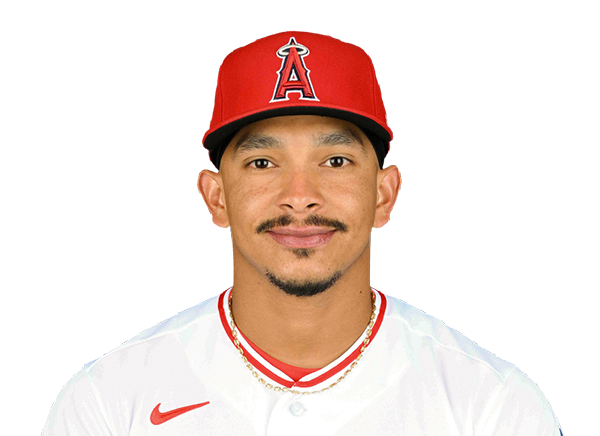
Team Stats
 MIN
LAA

4
Runs
5
10
Hits
8
0
Errors
0
1
Home Runs
0
2
Walks
3
15
Strikeouts
14
Player Box Score
Minnesota Twins
| Player | H-AB | AB | R | H | RBI | HR | BB | K | #P | AVG | OBP | SLG |
|---|---|---|---|---|---|---|---|---|---|---|---|---|
 Luke Keaschall |
1-5 | 5 | 0 | 1 | 0 | 0 | 0 | 2 | 18 | .279 | .370 | .387 |
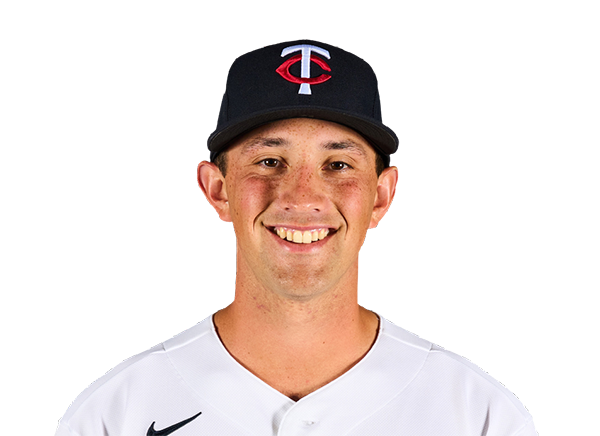 Brooks Lee |
2-4 | 4 | 0 | 2 | 2 | 0 | 0 | 0 | 14 | .248 | .298 | .427 |
 Kody Clemens |
1-3 | 3 | 0 | 1 | 0 | 0 | 1 | 1 | 19 | .242 | .304 | .469 |
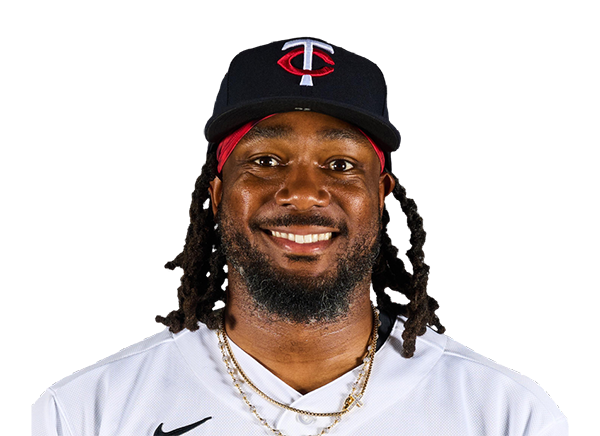 Josh Bell |
1-5 | 5 | 0 | 1 | 0 | 0 | 0 | 1 | 18 | .252 | .315 | .419 |
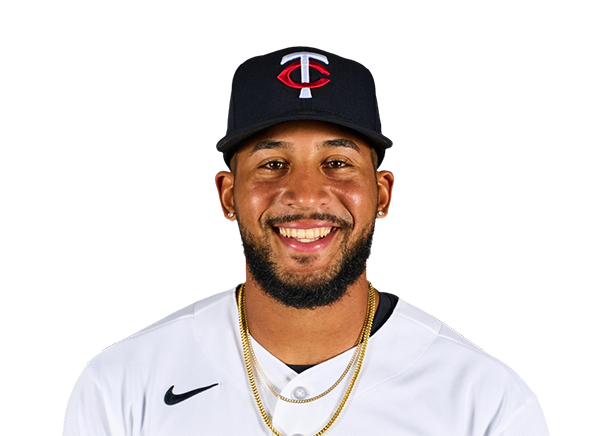 Emmanuel Rodriguez |
0-4 | 4 | 0 | 0 | 0 | 0 | 0 | 3 | 12 | .217 | .250 | .478 |
 Ryan Jeffers |
0-0 | 0 | 0 | 0 | 0 | 0 | 1 | 0 | 0 | .259 | .362 | .476 |
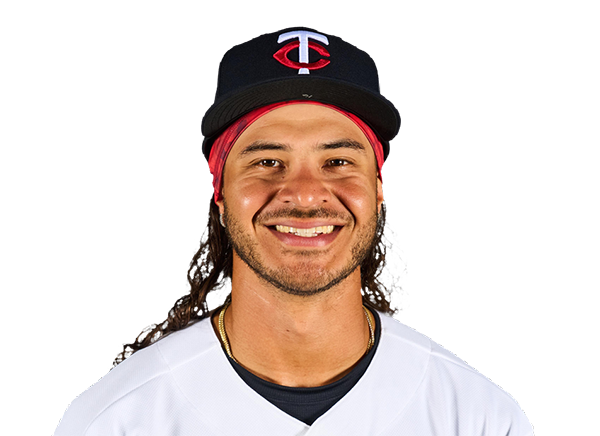 Austin Martin |
0-0 | 0 | 0 | 0 | 0 | 0 | 0 | 0 | 0 | .234 | .346 | .322 |
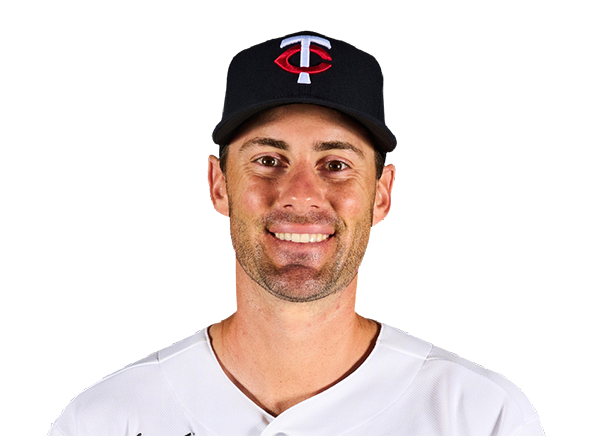 Ryan Kreidler |
0-0 | 0 | 0 | 0 | 0 | 0 | 0 | 0 | 0 | .217 | .280 | .374 |
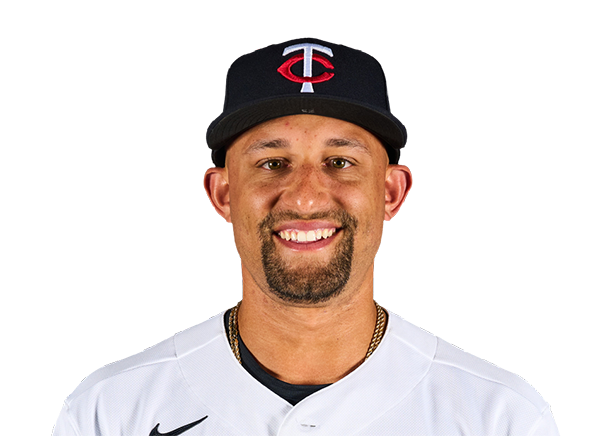 Royce Lewis |
0-5 | 5 | 0 | 0 | 0 | 0 | 0 | 4 | 24 | .226 | .290 | .381 |
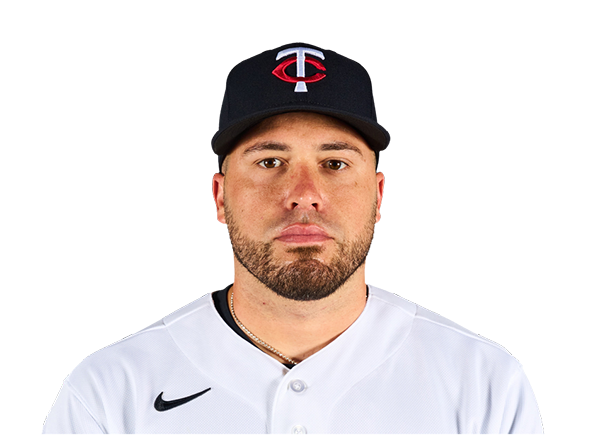 Victor Caratini |
1-4 | 4 | 1 | 1 | 0 | 0 | 0 | 1 | 11 | .221 | .314 | .317 |
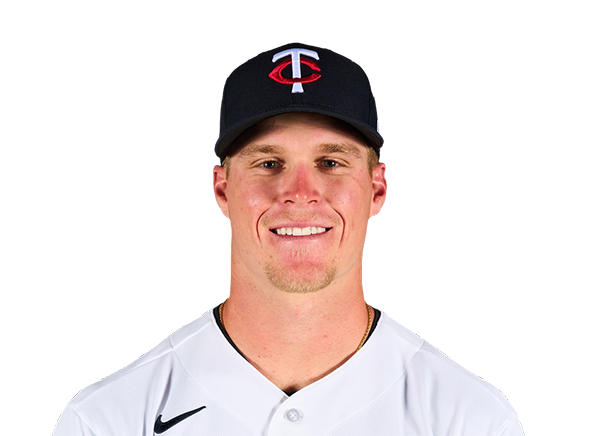 Walker Jenkins |
3-4 | 4 | 2 | 3 | 2 | 1 | 0 | 1 | 10 | .143 | .250 | .306 |
 Ben Ross |
1-4 | 4 | 1 | 1 | 0 | 0 | 0 | 2 | 19 | .200 | .200 | .400 |
Los Angeles Angels
| Player | H-AB | AB | R | H | RBI | HR | BB | K | #P | AVG | OBP | SLG |
|---|---|---|---|---|---|---|---|---|---|---|---|---|
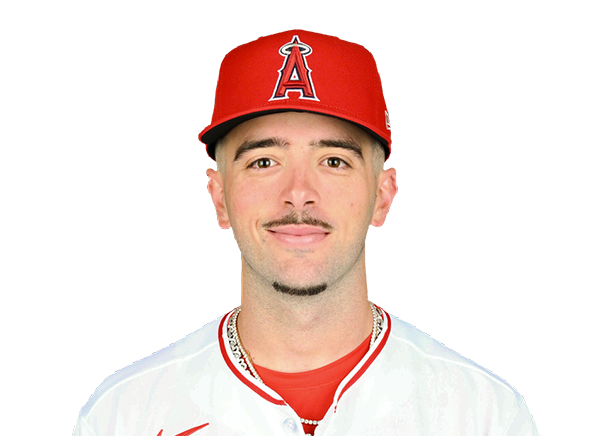 Zach Neto |
0-4 | 4 | 1 | 0 | 0 | 0 | 1 | 3 | 22 | .241 | .323 | .440 |
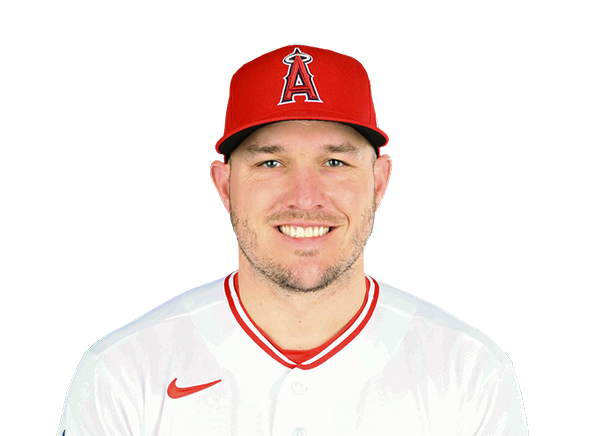 Mike Trout |
1-4 | 4 | 1 | 1 | 1 | 0 | 1 | 1 | 25 | .241 | .379 | .423 |
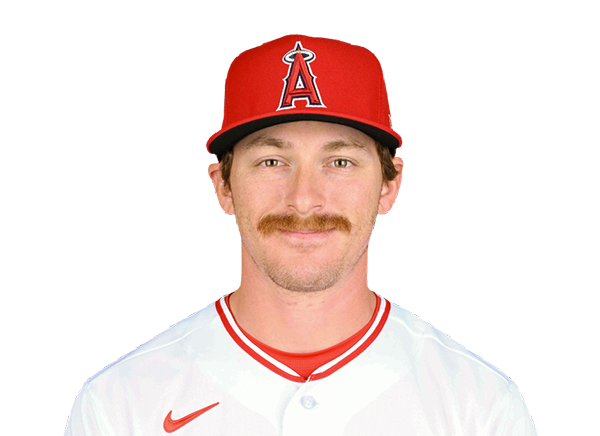 Wade Meckler |
2-5 | 5 | 1 | 2 | 1 | 0 | 0 | 1 | 13 | .294 | .370 | .381 |
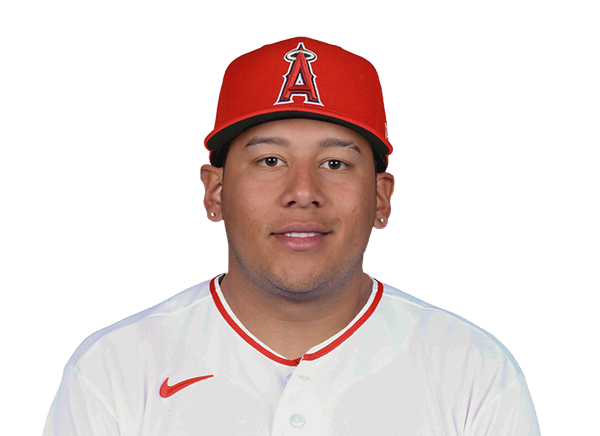 Moises Ballesteros |
1-4 | 4 | 1 | 1 | 1 | 0 | 0 | 1 | 14 | .228 | .293 | .356 |
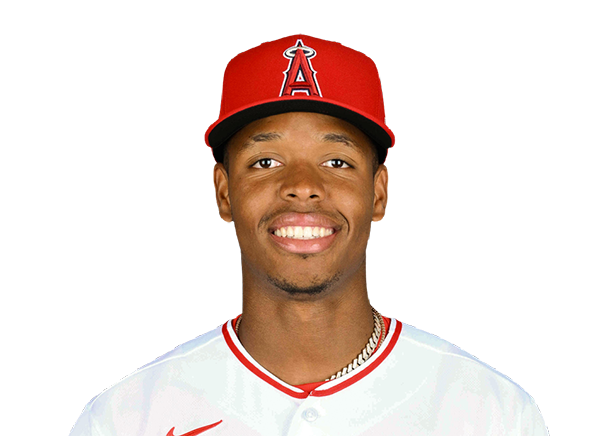 Denzer Guzman |
1-4 | 4 | 0 | 1 | 1 | 0 | 0 | 1 | 15 | .230 | .271 | .349 |
 Josh Lowe |
1-4 | 4 | 0 | 1 | 0 | 0 | 0 | 2 | 12 | .212 | .278 | .368 |
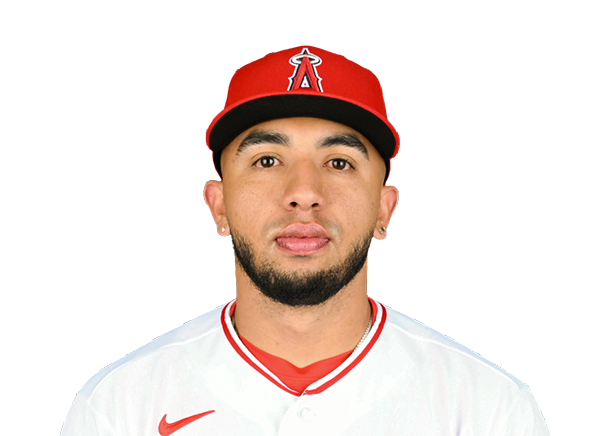 Oswald Peraza |
2-3 | 3 | 0 | 2 | 1 | 0 | 0 | 0 | 13 | .227 | .285 | .339 |
 Adam Frazier |
0-0 | 0 | 0 | 0 | 0 | 0 | 1 | 0 | 0 | .234 | .310 | .336 |
 Jose Siri |
0-4 | 4 | 1 | 0 | 0 | 0 | 0 | 3 | 17 | .225 | .281 | .392 |
 Tyler Heineman |
0-3 | 3 | 0 | 0 | 0 | 0 | 0 | 2 | 12 | .171 | .217 | .218 |
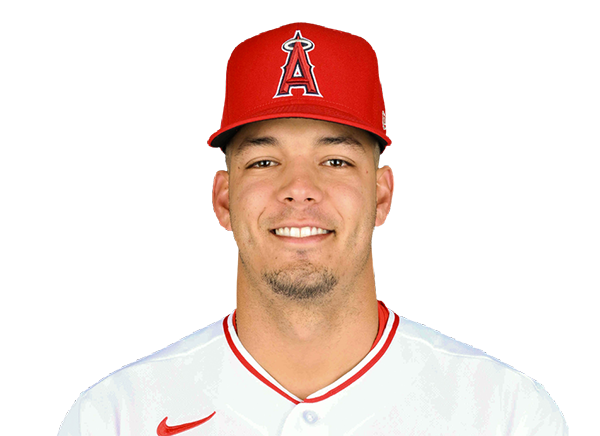 Vaughn Grissom |
0-1 | 1 | 0 | 0 | 0 | 0 | 0 | 0 | 6 | .238 | .302 | .381 |
Minnesota Twins
| Player | IP | H | R | ER | BB | K | HR | PC-ST | ERA | PC |
|---|---|---|---|---|---|---|---|---|---|---|
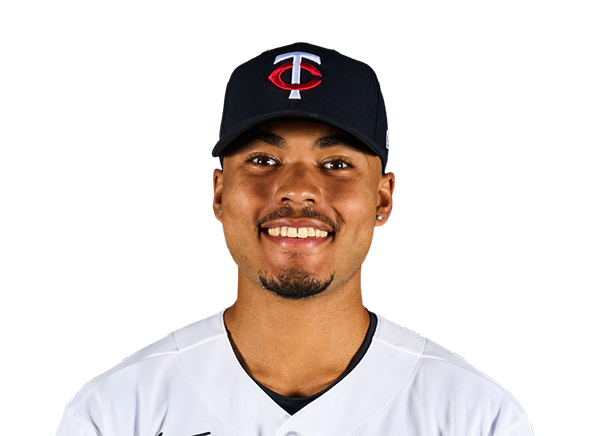 Taj Bradley |
7.0 | 5 | 3 | 3 | 1 | 9 | 0 | 98-65 | 3.81 | 98 |
|
Andrew Morris
|
1.0 | 0 | 0 | 0 | 0 | 2 | 0 | 13-10 | 4.39 | 13 |
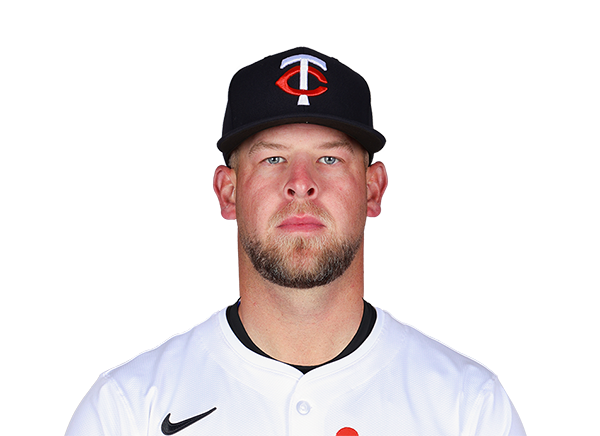 A.J. Minter |
0.2 | 1 | 0 | 0 | 0 | 2 | 0 | 14-8 | 2.57 | 14 |
 Jeff Hoffman |
0.1 | 0 | 0 | 0 | 1 | 1 | 0 | 5-3 | 3.52 | 5 |
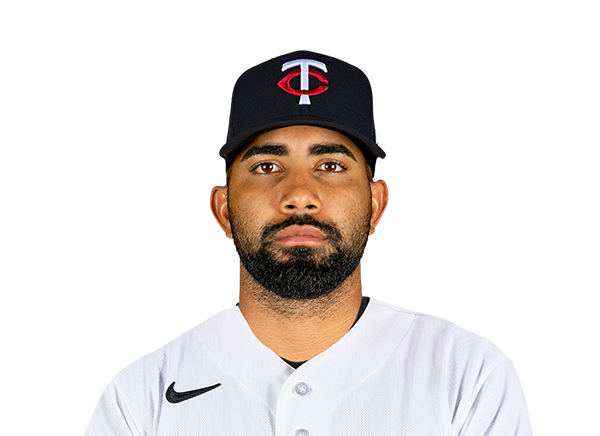 Yoendrys Gomez |
0.1 | 1 | 2 | 1 | 1 | 0 | 0 | 18-9 | 4.22 | 18 |
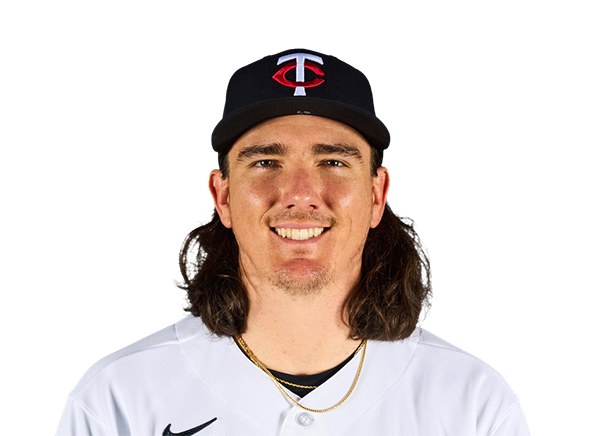 Kody Funderburk |
0.0 | 1 | 0 | 0 | 0 | 0 | 0 | 1-1 | 3.86 | 1 |
Los Angeles Angels
| Player | IP | H | R | ER | BB | K | HR | PC-ST | ERA | PC |
|---|---|---|---|---|---|---|---|---|---|---|
 Walbert Urena |
7.0 | 4 | 0 | 0 | 0 | 9 | 0 | 91-62 | 2.74 | 91 |
 Luke Murphy |
0.1 | 2 | 1 | 1 | 0 | 1 | 0 | 8-7 | 6.61 | 8 |
 Tayler Saucedo |
0.2 | 0 | 0 | 0 | 1 | 1 | 0 | 11-5 | 2.79 | 11 |
 Ben Joyce |
1.0 | 2 | 2 | 2 | 0 | 3 | 1 | 21-13 | 4.40 | 21 |
 Blake Weiman |
1.0 | 2 | 1 | 0 | 1 | 1 | 0 | 14-8 | 2.40 | 14 |
H2H / Season Series
LAA5–4
MIN
MIN4–2
LAA
MIN5–3
LAA
MIN3–4
LAA
Last 5 Games
| Date | Opponent | Result |
|---|---|---|
| Sep 17 | @ LAA | L4–5 |
| Sep 16 |  vs NYY | W5–4 |
| Sep 15 | vs NYY | L1–8 |
| Sep 14 | vs NYY | L3–8 |
| Sep 13 |  vs CLE | L2–9 |
| Date | Opponent | Result |
|---|---|---|
| Sep 17 | vs MIN | W5–4 |
| Sep 16 |  vs SEA | L2–7 |
| Sep 15 | vs SEA | W2–1 |
| Sep 14 | vs SEA | W6–4 |
| Sep 13 |  @ WSH | L5–6 |
Standings
American League
| Team | W | L | PCT | GB | DIFF | STRK |
|---|---|---|---|---|---|---|
1 Rays | 93 | 59 | .612 | - | +80 | W6 |
2 White Sox | 78 | 75 | .510 | 15.5 | +36 | W1 |
3 Astros | 77 | 76 | .503 | 16.5 | -50 | W1 |
| 4Yankees | 88 | 64 | .579 | 5 | +136 | L1 |
5 Red Sox | 83 | 70 | .542 | 10.5 | +83 | W1 |
| 6Guardians | 78 | 75 | .510 | 15.5 | -7 | W2 |
7 Rangers | 76 | 77 | .497 | 17.5 | -39 | L1 |
8 Blue Jays | 76 | 77 | .497 | 17.5 | -37 | W1 |
9 Orioles | 75 | 78 | .490 | 18.5 | -26 | W3 |
10 Tigers | 72 | 81 | .471 | 21.5 | +74 | L2 |
| 11Mariners | 71 | 82 | .464 | 22.5 | -56 | W1 |
| 12Twins | 71 | 82 | .464 | 22.5 | -74 | L1 |
13 Royals | 67 | 86 | .438 | 26.5 | -97 | L1 |
14 Athletics | 61 | 92 | .399 | 32.5 | -214 | L3 |
| 15Angels | 59 | 94 | .386 | 34.5 | -77 | W1 |
National League
| Team | W | L | PCT | GB | DIFF | STRK |
|---|---|---|---|---|---|---|
1 Brewers | 95 | 58 | .621 | - | +197 | L1 |
2 Dodgers | 93 | 60 | .608 | 2 | +179 | W1 |
3 Braves | 89 | 64 | .582 | 6 | +111 | L1 |
4 Cubs | 85 | 68 | .556 | 10 | +143 | W1 |
5 Phillies | 85 | 68 | .556 | 10 | +34 | W2 |
6 Padres | 84 | 69 | .549 | 11 | +30 | W2 |
7 Diamondbacks | 80 | 73 | .523 | 15 | 0 | L2 |
8 Marlins | 76 | 77 | .497 | 19 | +8 | W2 |
9 Pirates | 76 | 77 | .497 | 19 | +24 | W1 |
10 Cardinals | 75 | 78 | .490 | 20 | -14 | L2 |
| 11Nationals | 71 | 82 | .464 | 24 | +3 | L1 |
12 Reds | 71 | 82 | .464 | 24 | -154 | L1 |
13 Mets | 69 | 84 | .451 | 26 | -46 | L5 |
14 Giants | 64 | 89 | .418 | 31 | -70 | W2 |
15 Rockies | 56 | 97 | .366 | 39 | -177 | L2 |
MIN
VS
LAA
Pitchers
Taj Bradley
Catchers
Victor Caratini
Infielders
Brooks Lee
Kody Clemens
Royce Lewis
Ben Ross
Outfielders
Luke Keaschall
Emmanuel Rodriguez
Walker Jenkins
Designated Hitters
Josh Bell
Pitchers
Walbert Urena
Catchers
Tyler Heineman
Infielders
Zach Neto
Moises Ballesteros
Denzer Guzman
Oswald Peraza
Outfielders
Wade Meckler
Josh Lowe
Jose Siri
Designated Hitters
Mike Trout
Twins
VS
Angels
Batting
153
Team Games Played
153
5156
At Bats
5104
1256
Hits
1194
666
Runs Batted In
592
177
Home Runs
146
86
Stolen Bases
87
.244
Batting Average
.234
696
Runs
619
246
Doubles
230
22
Triples
14
2077
Total Bases
1890
488
Walks
473
1227
Strikeouts
1458
.317
On Base Percentage
.309
.403
Slugging Percentage
.370
.720
OBP Pct + SLG Pct
.679
153
Games Played
153
153
Games Started
153
89
Hit By Pitch
93
0.0
Wins Above Replacement
0.0
0.0
Offensive Wins Above Replacement
0.0
34
Caught Stealing
25
1
Is Qualified
1
667.8
Runs Created
588.7
4.4
Runs Created Per 27 Outs
3.9
.084
Walks Per Plate Appearance
.083
0.40
Walk To Strikeout Ratio
0.32
.159
Isolated Power
.136
.264
Secondary Average
.241
3.86
Pitches Per Plate Appearance
3.92
445
Extra Base Hits
390
5789
Plate Appearances
5731
29.1
At Bats Per Home Run
35.0
11
Sacrifice Hit
27
44
Sacrifice Flies
31
Pitching
153
Team Games Played
153
49
Quality Starts
53
71
Wins
59
82
Losses
94
41
Saves
24
101
Holds
89
1306
Hits
1200
702
Earned runs
630
178
Home Runs
155
556
Walks
610
1292
Strikeouts
1372
8.6
Strikeouts Per 9 Innings
9.1
150.3
Pitches Per Start
152.0
1.38
Walks Plus Hits Per Inning Pitched
1.34
4.67
Earned Run Average
4.20
82
Losses
94
1354.0
Innings pitched
1351.1
.464
Win Percentage
.386
61
Save Opportunities
53
.251
Opponent Batting Average
.236
.328
Opponent's On-base pct.
.324
.413
Opponent's Slugging pct.
.377
.741
Opponent's OPB Pct + SLG Pct
.702
5206
At Bats
5081
272
Doubles
214
19
Triples
19
65
Batters Hit
75
130
Stolen Bases
112
153
Games Played
153
1
Complete Games
1
3
Shutouts
11
43
Wild Pitches
60
736
Runs Batted In
661
6
Balks
4
1354.0
Innings pitched
1351.1
8.6
Strikeouts Per 9 Innings
9.1
21
Caught Stealing
30
153
Games Started
153
0.0
Wins Above Replacement
0.0
1
Is Qualified
1
770
Runs
696
702
Earned Runs
630
2150
Total Bases
1917
Fielding
153
Team Games Played
153
1354
Full Innings
1351
5293
Total Chances
5421
4062
Putouts
4054
1162
Assists
1283
69
Errors
84
246
Double Plays
230
0.987
Fielding Percentage
0.985
34.7
Range Factor
35.5
0.0
Zone Rating
0.0
153
Games Played
153
0
Games Started
0
0.0
Defensive Wins Above Replacement
0.0
1
Qualified
1