

Twins vs Brewers Live Score (7 Aug, 2026)
Game Information
Stage
Standard
Season
2026
First Pitch
Fri, Aug 7, 7:40 pm
Venue
American Family Field
Location
Milwaukee, Wisconsin
Attendance
42,118
Home Runs
Byron Buxton
25 HR
.263 AVG
45 RBI
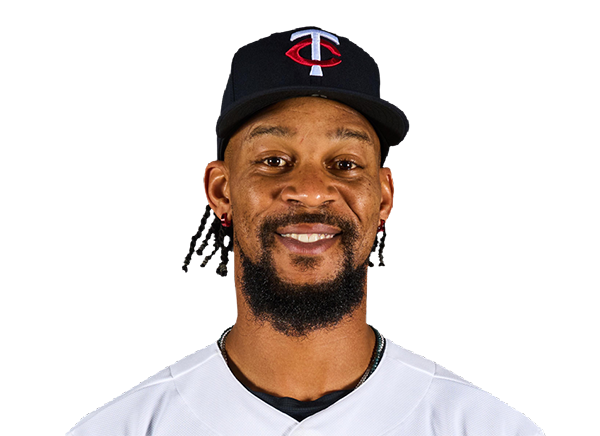
Jake Bauers
20 HR
.270 AVG
64 RBI

Batting Average
Byron Buxton
.263 AVG
.320 OBP
.544 SLG
Jackson Chourio
.277 AVG
.335 OBP
.470 SLG
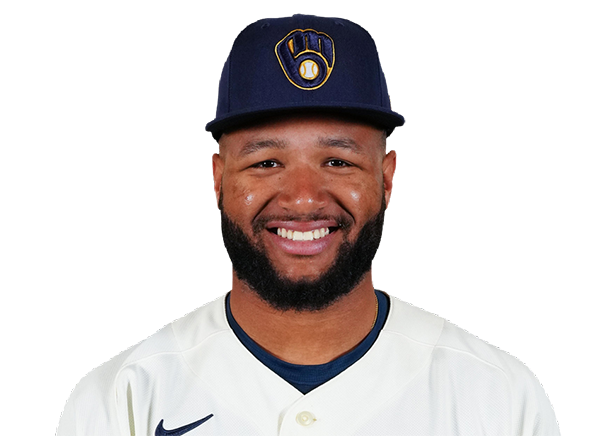
Runs Batted In
Josh Bell
65 RBI
14 HR
.246 AVG
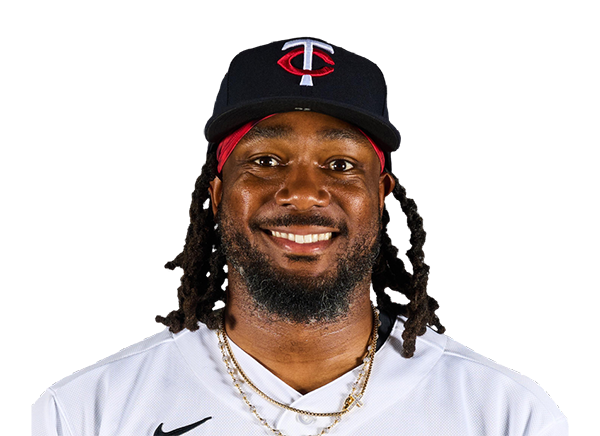
Brice Turang
70 RBI
16 HR
.266 AVG

Earned Run Average
Joe Ryan
3.65 ERA
6 W
138 K
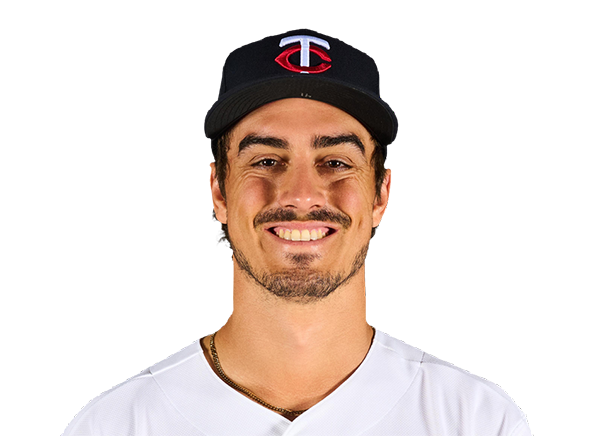
Jacob Misiorowski
1.63 ERA
11 W
195 K

Wins
Taj Bradley
9 W
3.69 ERA
141 K
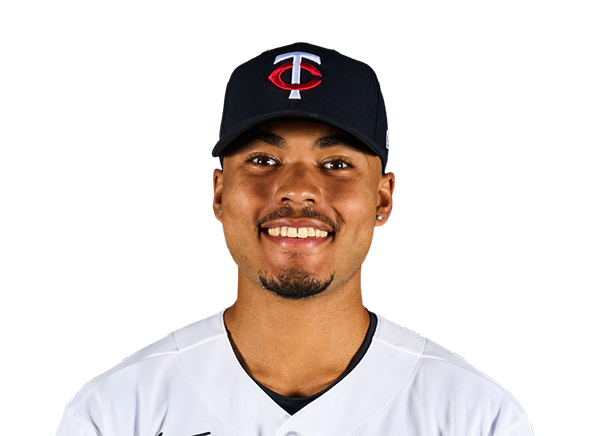
Aaron Ashby
12 W
3.68 ERA
89 K

Strikeouts
Taj Bradley
141 K
9 W
3.69 ERA
Jacob Misiorowski
195 K
11 W
1.63 ERA
Injury Report


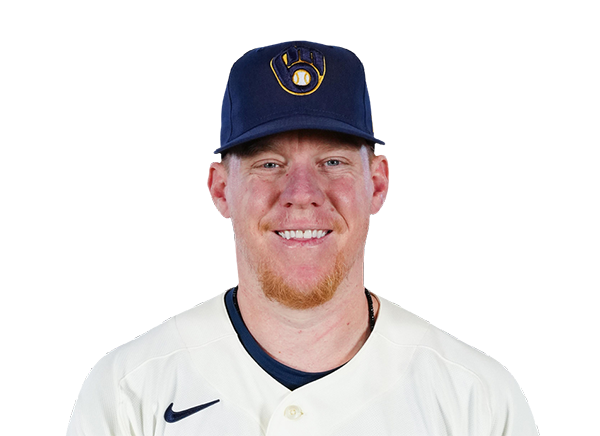


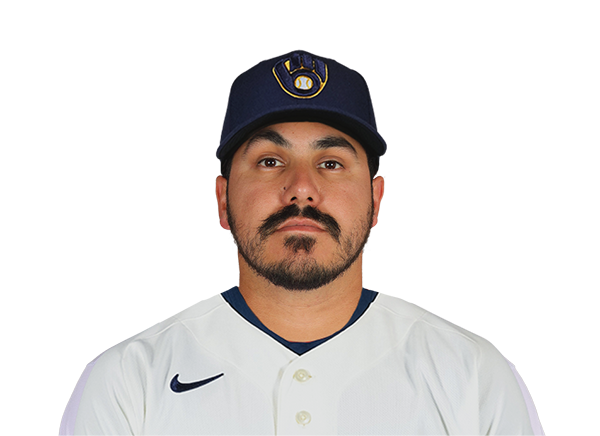

Team Stats
 MIN
MIL


Array
Runs
Array
13
Hits
9
1
Errors
0
—
Home Runs
—
—
Walks
—
—
Strikeouts
—
Standings
American League
| Team | W | L | PCT | GB | DIFF | STRK |
|---|---|---|---|---|---|---|
1 Rays | 76 | 52 | .594 | - | +43 | L2 |
2 White Sox | 67 | 61 | .523 | 9 | +47 | W1 |
3 Astros | 65 | 64 | .504 | 11.5 | -42 | W1 |
4 Yankees | 73 | 56 | .566 | 3.5 | +95 | L1 |
5 Red Sox | 69 | 59 | .539 | 7 | +97 | W1 |
6 Rangers | 64 | 65 | .496 | 12.5 | -45 | W2 |
7 Blue Jays | 64 | 67 | .489 | 13.5 | -50 | W1 |
| 8Twins | 63 | 66 | .488 | 13.5 | -45 | L1 |
9 Guardians | 63 | 66 | .488 | 13.5 | -15 | W2 |
10 Orioles | 62 | 67 | .481 | 14.5 | -34 | W1 |
11 Tigers | 61 | 67 | .477 | 15 | +79 | L3 |
12 Mariners | 61 | 68 | .473 | 15.5 | -45 | W1 |
13 Royals | 56 | 74 | .431 | 21 | -97 | W6 |
14 Angels | 51 | 78 | .395 | 25.5 | -71 | L1 |
15 Athletics | 49 | 80 | .380 | 27.5 | -189 | L5 |
National League
| Team | W | L | PCT | GB | DIFF | STRK |
|---|---|---|---|---|---|---|
| 1Brewers | 81 | 49 | .623 | - | +163 | W3 |
2 Dodgers | 78 | 51 | .605 | 2.5 | +146 | W4 |
3 Braves | 75 | 55 | .577 | 6 | +108 | L2 |
4 Cubs | 74 | 55 | .574 | 6.5 | +99 | L2 |
5 Phillies | 71 | 58 | .550 | 9.5 | +16 | W7 |
6 Padres | 69 | 60 | .535 | 11.5 | +7 | W1 |
7 Diamondbacks | 68 | 61 | .527 | 12.5 | +13 | W2 |
8 Marlins | 66 | 64 | .508 | 15 | +17 | W2 |
9 Cardinals | 66 | 64 | .508 | 15 | +9 | L1 |
10 Pirates | 63 | 67 | .485 | 18 | +30 | L1 |
11 Reds | 61 | 68 | .473 | 19.5 | -98 | L2 |
12 Nationals | 61 | 70 | .466 | 20.5 | +14 | L3 |
13 Mets | 58 | 71 | .450 | 22.5 | -44 | L1 |
14 Giants | 52 | 76 | .406 | 28 | -78 | L2 |
15 Rockies | 50 | 78 | .391 | 30 | -130 | L4 |
MIN
VS
MIL
Pitchers
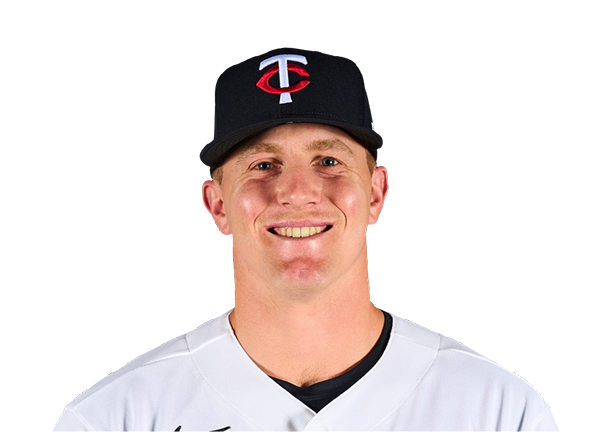
Zebby Matthews
Catchers

Ryan Jeffers
Infielders
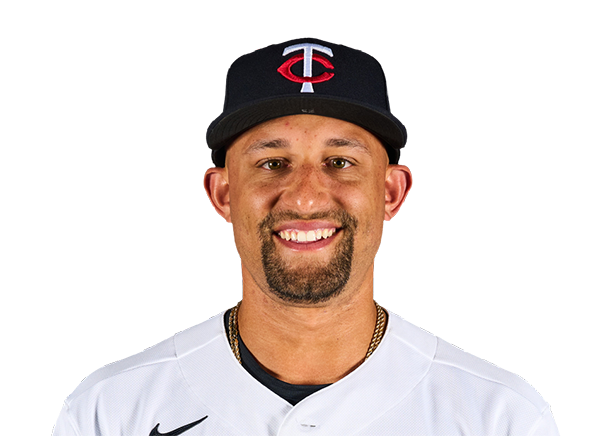
Royce Lewis
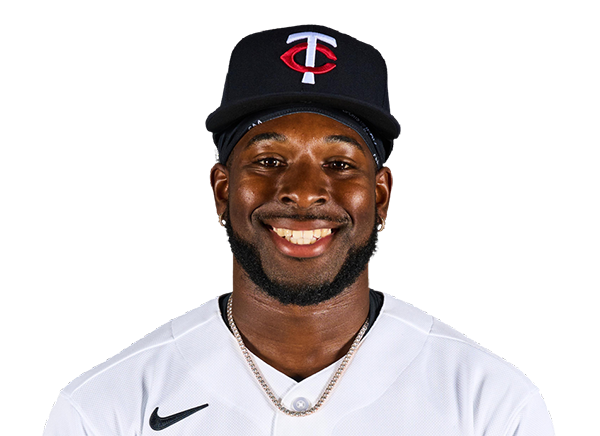
Kaelen Culpepper
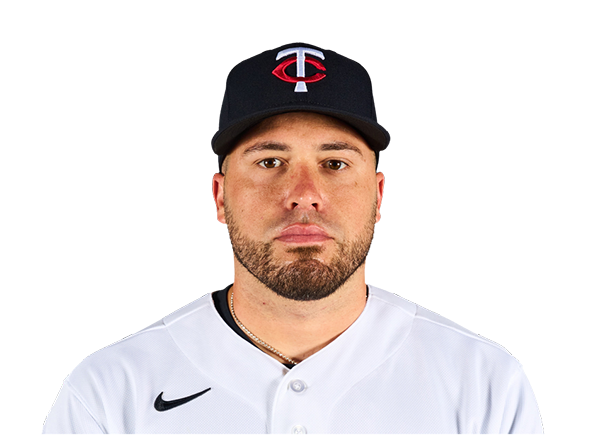
Victor Caratini
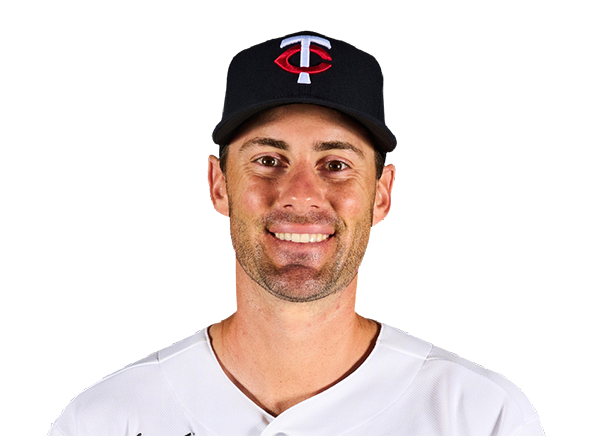
Ryan Kreidler
Outfielders
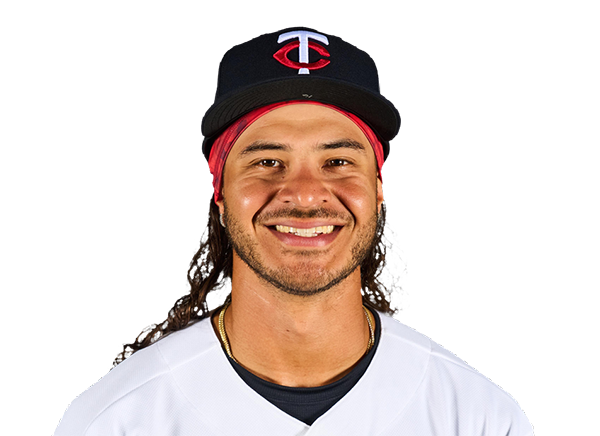
Austin Martin

Kody Clemens

Luke Keaschall
Designated Hitters
Josh Bell
Pitchers

Shane Drohan
Catchers
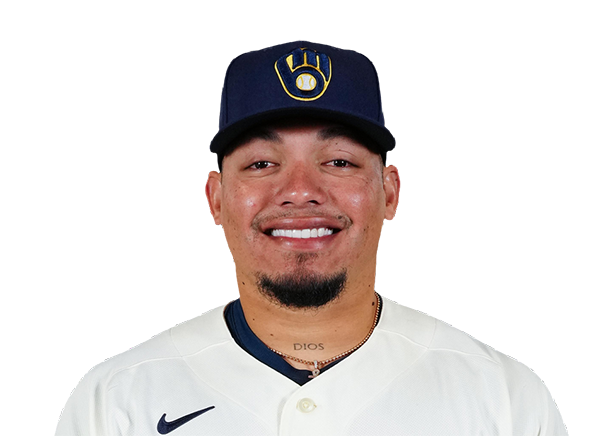
William Contreras
Infielders
Brice Turang
Jake Bauers

Cooper Pratt
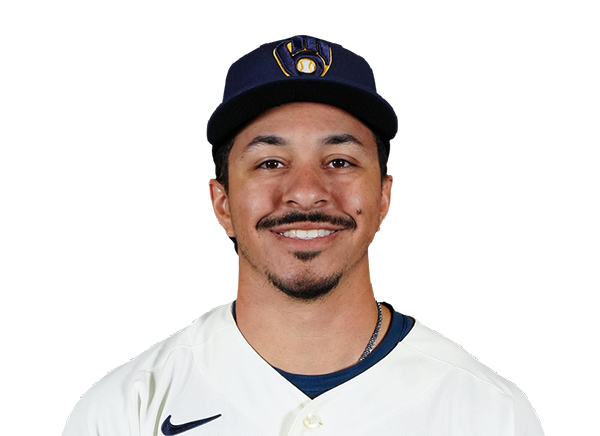
David Hamilton
Outfielders
Jackson Chourio
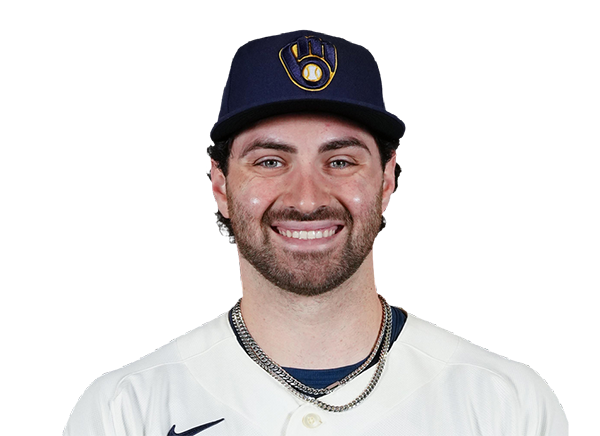
Garrett Mitchell
Luis Lara
Designated Hitters

Christian Yelich
Twins
VS
Brewers
Batting
117
Team Games Played
116
3938
At Bats
3916
961
Hits
990
519
Runs Batted In
546
139
Home Runs
107
70
Stolen Bases
115
.244
Batting Average
.253
547
Runs
577
187
Doubles
208
18
Triples
20
1601
Total Bases
1559
383
Walks
480
942
Strikeouts
953
.318
On Base Percentage
.336
.407
Slugging Percentage
.398
.725
OBP Pct + SLG Pct
.734
117
Games Played
116
117
Games Started
116
60
Hit By Pitch
28
0.0
Wins Above Replacement
0.0
0.0
Offensive Wins Above Replacement
0.0
29
Caught Stealing
34
1
Is Qualified
1
518.1
Runs Created
547.9
4.5
Runs Created Per 27 Outs
4.8
.087
Walks Per Plate Appearance
.107
0.41
Walk To Strikeout Ratio
0.50
.163
Isolated Power
.145
.270
Secondary Average
.289
3.87
Pitches Per Plate Appearance
3.98
344
Extra Base Hits
335
4421
Plate Appearances
4488
28.3
At Bats Per Home Run
36.6
6
Sacrifice Hit
27
34
Sacrifice Flies
30
Pitching
117
Team Games Played
116
42
Quality Starts
38
58
Wins
72
59
Losses
44
33
Saves
37
77
Holds
60
996
Hits
840
528
Earned runs
401
134
Home Runs
116
427
Walks
364
955
Strikeouts
1135
8.3
Strikeouts Per 9 Innings
9.9
149.8
Pitches Per Start
145.1
1.38
Walks Plus Hits Per Inning Pitched
1.16
4.60
Earned Run Average
3.48
59
Losses
44
1032.1
Innings pitched
1036.2
.496
Win Percentage
.621
45
Save Opportunities
52
.251
Opponent Batting Average
.220
.330
Opponent's On-base pct.
.294
.412
Opponent's Slugging pct.
.358
.741
Opponent's OPB Pct + SLG Pct
.652
3961
At Bats
3826
205
Doubles
159
14
Triples
11
53
Batters Hit
46
104
Stolen Bases
45
117
Games Played
116
1
Complete Games
1
3
Shutouts
8
31
Wild Pitches
40
554
Runs Batted In
420
5
Balks
5
1032.1
Innings pitched
1036.2
8.3
Strikeouts Per 9 Innings
9.9
16
Caught Stealing
26
117
Games Started
116
0.0
Wins Above Replacement
0.0
1
Is Qualified
1
580
Runs
438
528
Earned Runs
401
1631
Total Bases
1369
Fielding
117
Team Games Played
116
1032
Full Innings
1037
4045
Total Chances
4060
3097
Putouts
3110
890
Assists
901
58
Errors
49
187
Double Plays
208
0.986
Fielding Percentage
0.988
34.8
Range Factor
34.8
0.0
Zone Rating
0.0
117
Games Played
116
0
Games Started
0
0.0
Defensive Wins Above Replacement
0.0
1
Qualified
1