

Twins vs Brewers Live Score (8 Aug, 2026)
Game Information
Stage
Standard
Season
2026
First Pitch
Sat, Aug 8, 7:10 pm
Venue
American Family Field
Location
Milwaukee, Wisconsin
Attendance
40,625
Home Runs
Byron Buxton
25 HR
.263 AVG
45 RBI
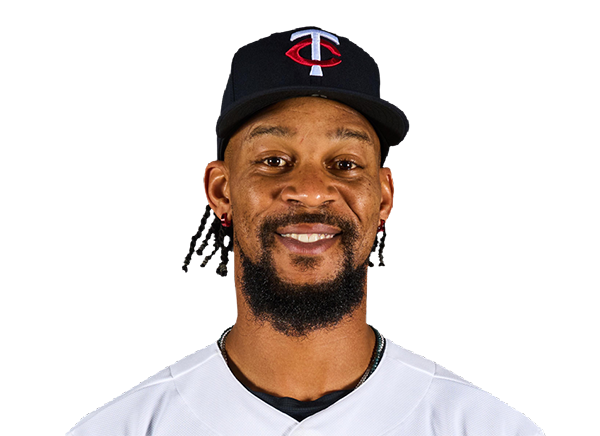
Jake Bauers
20 HR
.268 AVG
65 RBI

Batting Average
Luke Keaschall
.262 AVG
.355 OBP
.359 SLG

Jackson Chourio
.276 AVG
.336 OBP
.476 SLG
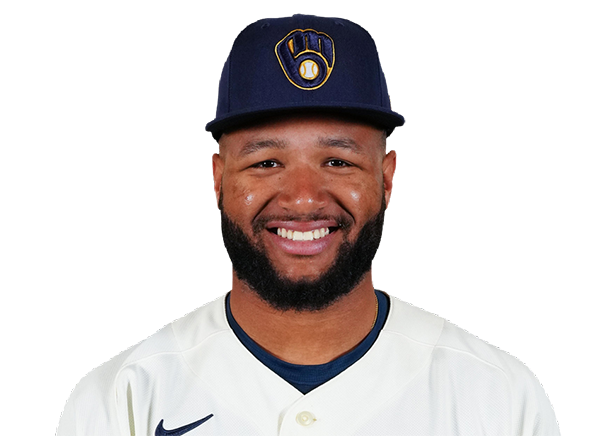
Runs Batted In
Josh Bell
68 RBI
15 HR
.252 AVG
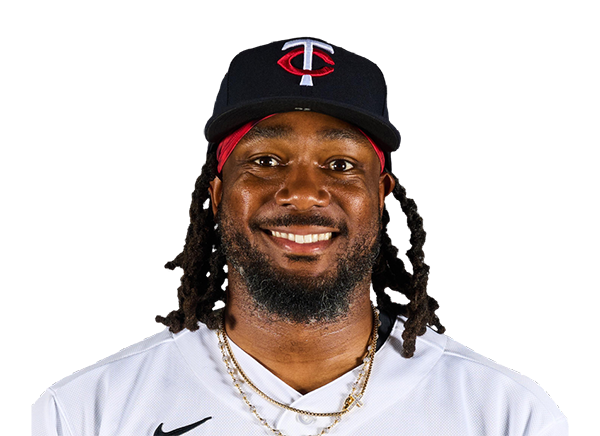
Brice Turang
72 RBI
16 HR
.268 AVG

Earned Run Average
Joe Ryan
3.65 ERA
6 W
138 K
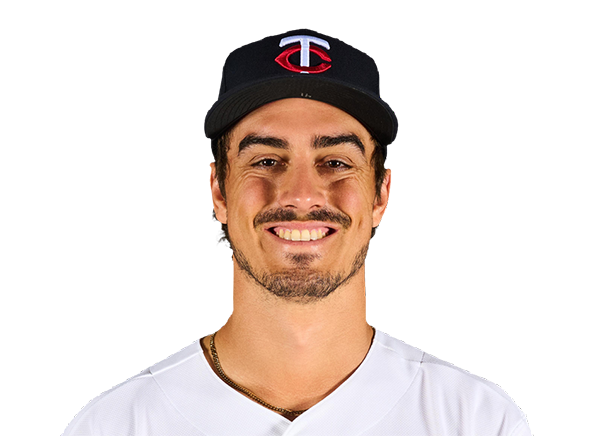
Jacob Misiorowski
1.63 ERA
11 W
195 K

Wins
Taj Bradley
9 W
3.69 ERA
141 K
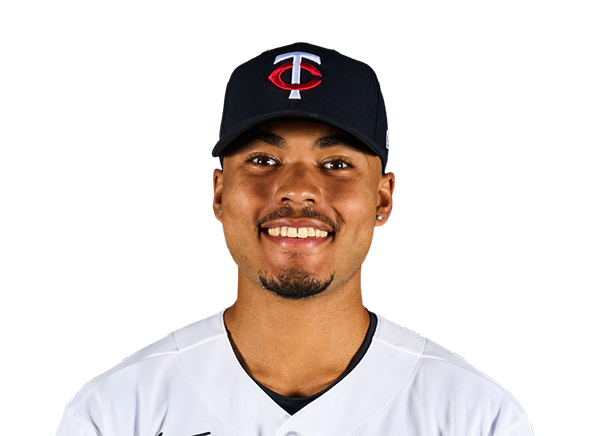
Aaron Ashby
12 W
3.68 ERA
89 K

Strikeouts
Taj Bradley
141 K
9 W
3.69 ERA
Jacob Misiorowski
195 K
11 W
1.63 ERA
Injury Report



Team Stats
 MIN
MIL


Array
Runs
Array
7
Hits
8
0
Errors
0
—
Home Runs
—
—
Walks
—
—
Strikeouts
—
Standings
American League
| Team | W | L | PCT | GB | DIFF | STRK |
|---|---|---|---|---|---|---|
1 Rays | 76 | 53 | .589 | - | +42 | L3 |
2 White Sox | 67 | 62 | .519 | 9 | +42 | L1 |
3 Astros | 65 | 65 | .500 | 11.5 | -43 | L1 |
4 Yankees | 73 | 56 | .566 | 3 | +95 | L1 |
5 Red Sox | 70 | 59 | .543 | 6 | +98 | W2 |
6 Rangers | 64 | 66 | .492 | 12.5 | -48 | L1 |
7 Guardians | 64 | 66 | .492 | 12.5 | -14 | W3 |
8 Blue Jays | 64 | 67 | .489 | 13 | -50 | W1 |
| 9Twins | 63 | 67 | .485 | 13.5 | -47 | L2 |
10 Orioles | 63 | 67 | .485 | 13.5 | -33 | W2 |
11 Mariners | 62 | 68 | .477 | 14.5 | -44 | W2 |
12 Tigers | 61 | 68 | .473 | 15 | +77 | L4 |
13 Royals | 57 | 74 | .435 | 20 | -95 | W7 |
14 Angels | 52 | 78 | .400 | 24.5 | -68 | W1 |
15 Athletics | 50 | 80 | .385 | 26.5 | -188 | W1 |
National League
| Team | W | L | PCT | GB | DIFF | STRK |
|---|---|---|---|---|---|---|
| 1Brewers | 81 | 49 | .623 | - | +163 | W3 |
2 Dodgers | 79 | 51 | .608 | 2 | +147 | W5 |
3 Braves | 75 | 55 | .577 | 6 | +108 | L2 |
4 Cubs | 74 | 56 | .569 | 7 | +98 | L3 |
5 Phillies | 72 | 58 | .554 | 9 | +25 | W8 |
6 Padres | 70 | 60 | .538 | 11 | +9 | W2 |
7 Diamondbacks | 68 | 62 | .523 | 13 | +7 | L1 |
8 Marlins | 66 | 64 | .508 | 15 | +17 | W2 |
9 Cardinals | 66 | 65 | .504 | 15.5 | 0 | L2 |
10 Pirates | 63 | 68 | .481 | 18.5 | +29 | L2 |
11 Reds | 62 | 68 | .477 | 19 | -92 | W1 |
12 Nationals | 61 | 70 | .466 | 20.5 | +14 | L3 |
13 Mets | 59 | 71 | .454 | 22 | -39 | W1 |
14 Giants | 52 | 77 | .403 | 28.5 | -79 | L3 |
15 Rockies | 50 | 79 | .388 | 30.5 | -131 | L5 |
MIN
VS
MIL
Pitchers
Taj Bradley
Catchers

Ryan Jeffers
Infielders
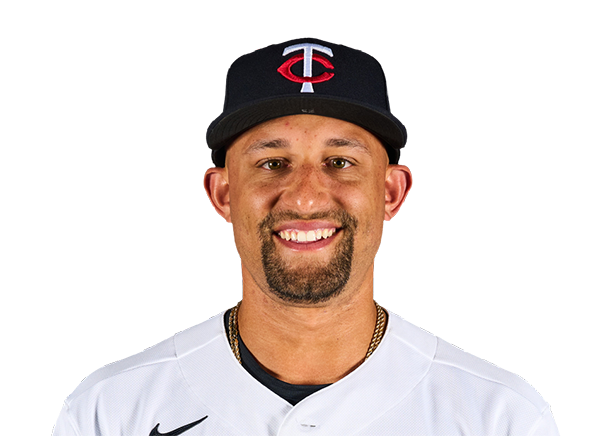
Royce Lewis

Kody Clemens
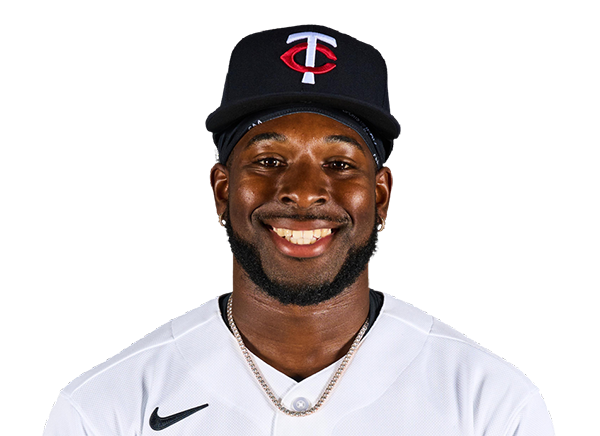
Kaelen Culpepper
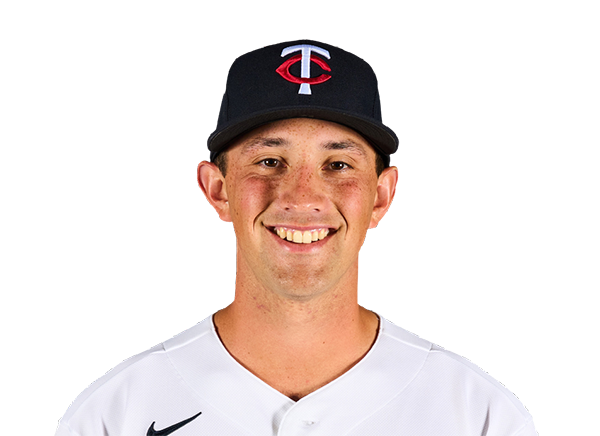
Brooks Lee
Outfielders
Austin Martin
Luke Keaschall
Ryan Kreidler
Designated Hitters
Josh Bell
Pitchers

Robert Gasser
Catchers
William Contreras
Infielders
Brice Turang
Andrew Vaughn

Cooper Pratt

Joey Ortiz
Outfielders
Jackson Chourio
Jake Bauers
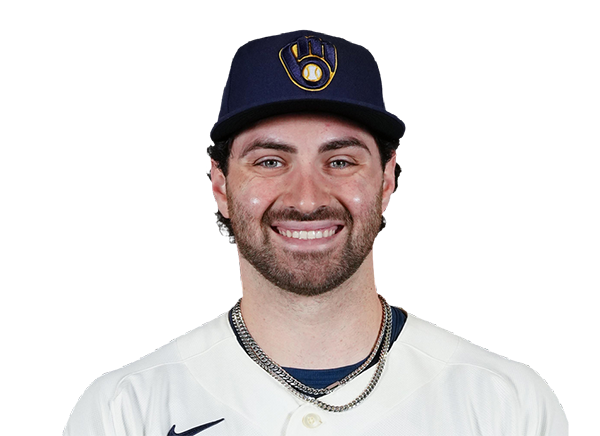
Garrett Mitchell
Designated Hitters
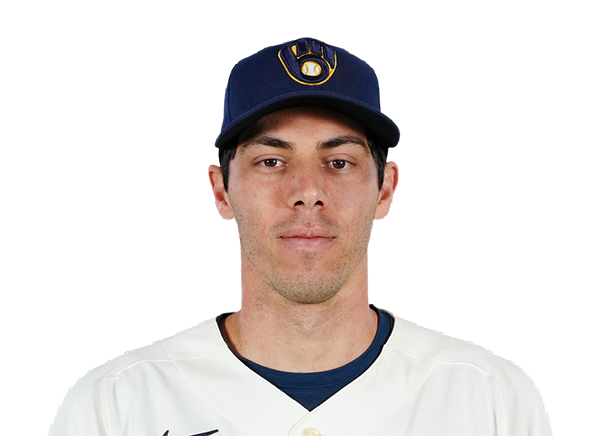
Christian Yelich
Twins
VS
Brewers
Batting
118
Team Games Played
117
3970
At Bats
3948
968
Hits
998
522
Runs Batted In
550
139
Home Runs
107
71
Stolen Bases
117
.244
Batting Average
.253
550
Runs
581
189
Doubles
209
18
Triples
20
1610
Total Bases
1568
386
Walks
482
948
Strikeouts
967
.318
On Base Percentage
.336
.406
Slugging Percentage
.397
.724
OBP Pct + SLG Pct
.733
118
Games Played
117
118
Games Started
117
63
Hit By Pitch
29
0.0
Wins Above Replacement
0.0
0.0
Offensive Wins Above Replacement
0.0
30
Caught Stealing
34
1
Is Qualified
1
521.3
Runs Created
551.3
4.5
Runs Created Per 27 Outs
4.8
.087
Walks Per Plate Appearance
.107
0.41
Walk To Strikeout Ratio
0.50
.162
Isolated Power
.144
.269
Secondary Average
.287
3.87
Pitches Per Plate Appearance
3.99
346
Extra Base Hits
336
4459
Plate Appearances
4523
28.6
At Bats Per Home Run
36.9
6
Sacrifice Hit
27
34
Sacrifice Flies
30
Pitching
118
Team Games Played
117
42
Quality Starts
38
58
Wins
73
60
Losses
44
33
Saves
38
77
Holds
60
1004
Hits
847
532
Earned runs
404
134
Home Runs
116
429
Walks
367
969
Strikeouts
1141
8.4
Strikeouts Per 9 Innings
9.8
149.7
Pitches Per Start
145.1
1.38
Walks Plus Hits Per Inning Pitched
1.16
4.60
Earned Run Average
3.48
60
Losses
44
1040.1
Innings pitched
1045.2
.492
Win Percentage
.624
45
Save Opportunities
53
.251
Opponent Batting Average
.220
.329
Opponent's On-base pct.
.294
.411
Opponent's Slugging pct.
.357
.740
Opponent's OPB Pct + SLG Pct
.651
3993
At Bats
3858
206
Doubles
161
14
Triples
11
54
Batters Hit
49
106
Stolen Bases
46
118
Games Played
117
1
Complete Games
1
3
Shutouts
8
31
Wild Pitches
40
558
Runs Batted In
423
5
Balks
6
1040.1
Innings pitched
1045.2
8.4
Strikeouts Per 9 Innings
9.8
16
Caught Stealing
27
118
Games Started
117
0.0
Wins Above Replacement
0.0
1
Is Qualified
1
584
Runs
441
532
Earned Runs
404
1640
Total Bases
1378
Fielding
118
Team Games Played
117
1040
Full Innings
1046
4074
Total Chances
4096
3121
Putouts
3137
895
Assists
910
58
Errors
49
189
Double Plays
209
0.986
Fielding Percentage
0.988
34.7
Range Factor
34.8
0.0
Zone Rating
0.0
118
Games Played
117
0
Games Started
0
0.0
Defensive Wins Above Replacement
0.0
1
Qualified
1