

Twins vs Giants Live Score (23 Sep, 2026)
Game Information
Stage
STD
Season
2026
First Pitch
Tue, Sep 22, 9:45 pm
Venue
Oracle Park
Location
San Francisco, California
Venue Type
Outdoor
Broadcast
MLB.TV
Attendance
28,079
Live Situation
3Balls
3Strikes
0Outs
—Pitcher
—At Bat
Pitch Sequence
1
STRIKE SWINGING
Slider
85 MPH
2
BALL
Slider
84 MPH
3
STRIKE SWINGING
Slider
84 MPH
4
STRIKE FOUL
Slider
86 MPH
5
BALL
Four-seam FB
95 MPH
6
BALL
Four-seam FB
96 MPH
7
STRIKE SWINGING
Slider
84 MPH
Injury Report
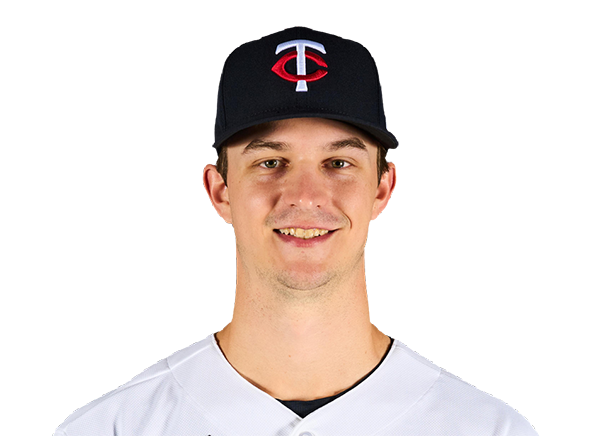
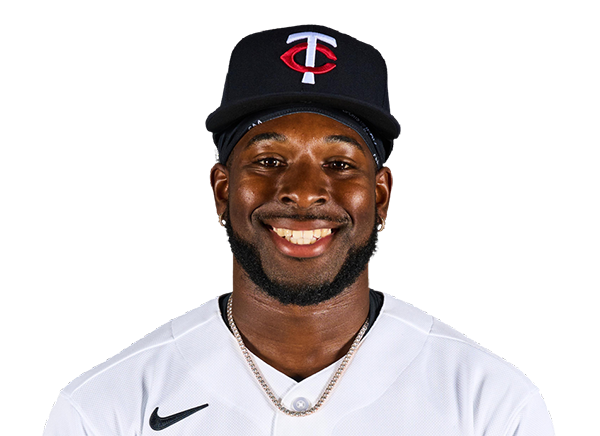

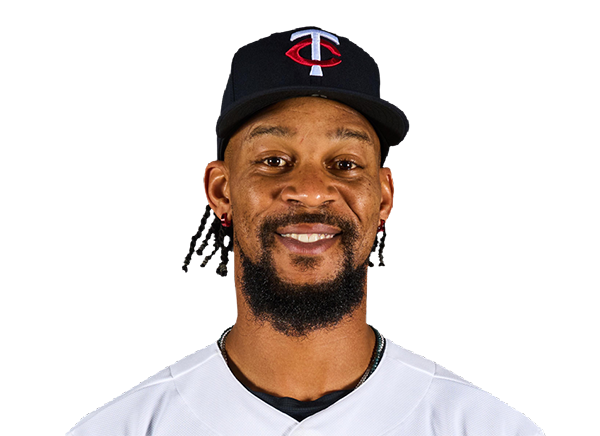
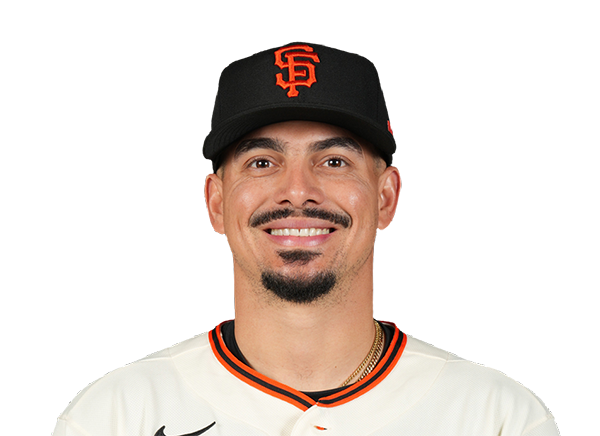

Team Stats
 MIN
SF


3
Runs
2
6
Hits
6
1
Errors
1
1
Home Runs
0
1
Walks
6
7
Strikeouts
10
Player Box Score
Minnesota Twins
| Player | H-AB | AB | R | H | RBI | HR | BB | K | #P | AVG | OBP | SLG |
|---|---|---|---|---|---|---|---|---|---|---|---|---|
 Luke Keaschall | 1-4 | 4 | 1 | 1 | 1 | 0 | 0 | 0 | 14 | .276 | .367 | .386 |
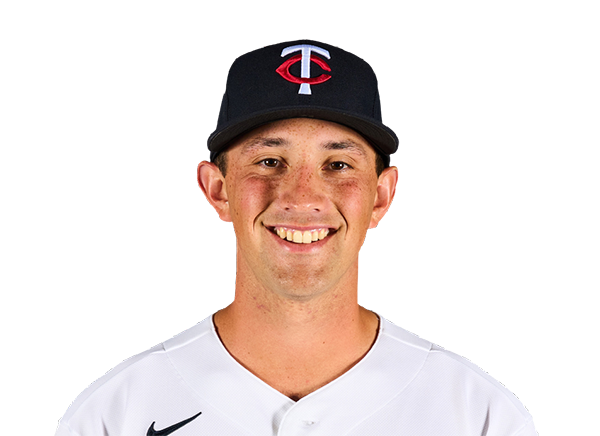 Brooks Lee | 2-4 | 4 | 0 | 2 | 1 | 0 | 0 | 1 | 14 | .255 | .302 | .434 |
 Kody Clemens | 1-4 | 4 | 0 | 1 | 0 | 0 | 0 | 1 | 13 | .236 | .297 | .456 |
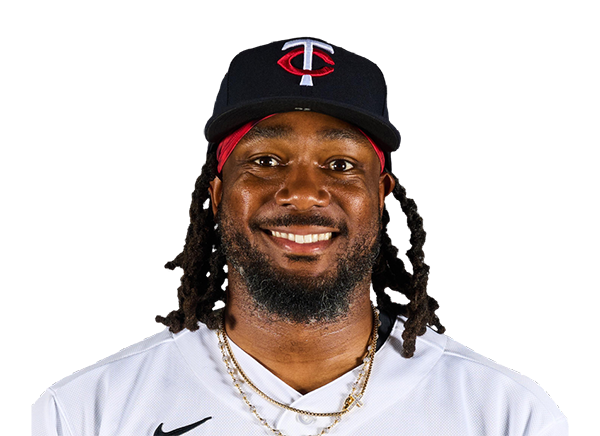 Josh Bell | 0-4 | 4 | 0 | 0 | 0 | 0 | 0 | 1 | 15 | .256 | .318 | .418 |
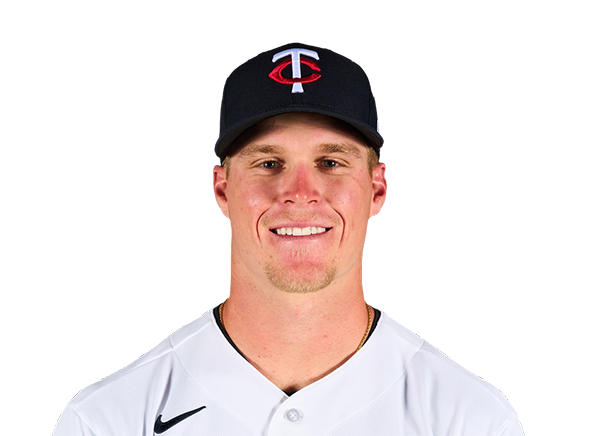 Walker Jenkins | 1-4 | 4 | 1 | 1 | 1 | 1 | 0 | 0 | 14 | .214 | .295 | .414 |
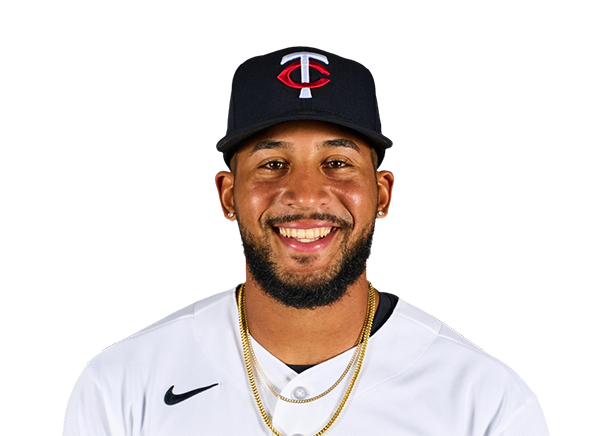 Emmanuel Rodriguez | 0-2 | 2 | 0 | 0 | 0 | 0 | 1 | 1 | 12 | .184 | .225 | .447 |
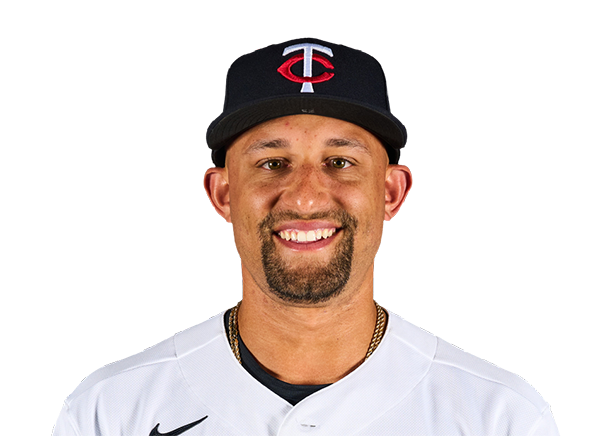 Royce Lewis | 0-3 | 3 | 0 | 0 | 0 | 0 | 0 | 1 | 5 | .226 | .288 | .378 |
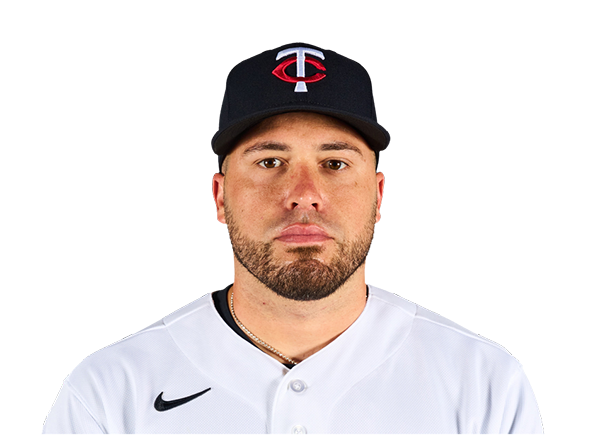 Victor Caratini | 0-3 | 3 | 0 | 0 | 0 | 0 | 0 | 1 | 12 | .220 | .312 | .313 |
 Ryan Kreidler | 1-3 | 3 | 1 | 1 | 0 | 0 | 0 | 1 | 15 | .217 | .282 | .379 |
San Francisco Giants
| Player | H-AB | AB | R | H | RBI | HR | BB | K | #P | AVG | OBP | SLG |
|---|---|---|---|---|---|---|---|---|---|---|---|---|
 Drew Gilbert | 1-3 | 3 | 0 | 1 | 0 | 0 | 0 | 1 | 14 | .238 | .327 | .396 |
 Osleivis Basabe | 0-1 | 1 | 0 | 0 | 0 | 0 | 1 | 0 | 13 | .203 | .270 | .344 |
 Marcelo Mayer | 0-0 | 0 | 0 | 0 | 0 | 0 | 0 | 0 | 0 | .215 | .277 | .306 |
 Jonah Cox | 0-4 | 4 | 0 | 0 | 1 | 0 | 1 | 2 | 26 | .272 | .317 | .412 |
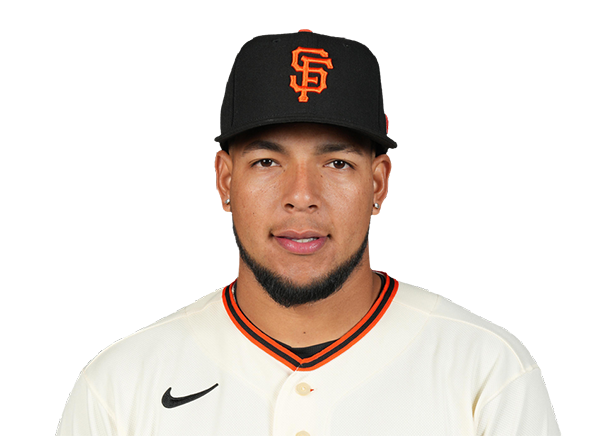 Victor Bericoto | 0-4 | 4 | 0 | 0 | 0 | 0 | 1 | 2 | 27 | .242 | .265 | .434 |
|
Turner Hill | 0-4 | 4 | 0 | 0 | 0 | 0 | 0 | 0 | 15 | .229 | .325 | .323 |
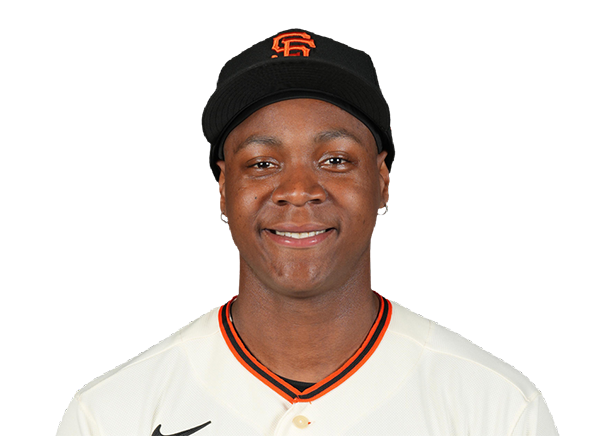 Bo Davidson | 1-3 | 3 | 0 | 1 | 0 | 0 | 1 | 1 | 11 | .286 | .375 | .286 |
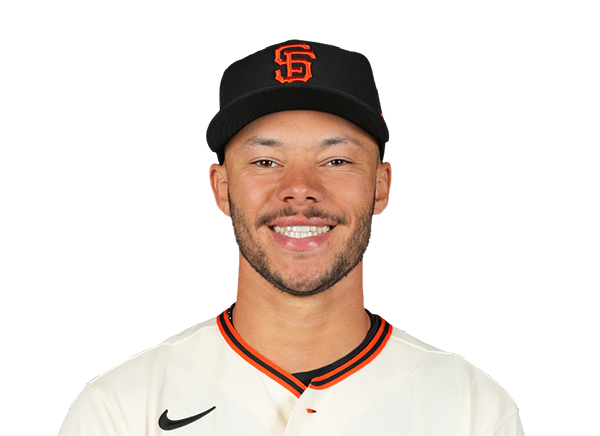 Grant McCray | 0-0 | 0 | 0 | 0 | 0 | 0 | 0 | 0 | 0 | .147 | .256 | .280 |
 Shay Whitcomb | 1-3 | 3 | 1 | 1 | 0 | 0 | 1 | 1 | 19 | .179 | .209 | .321 |
|
Scott Bandura | 1-2 | 2 | 0 | 1 | 0 | 0 | 0 | 1 | 10 | .190 | .227 | .238 |
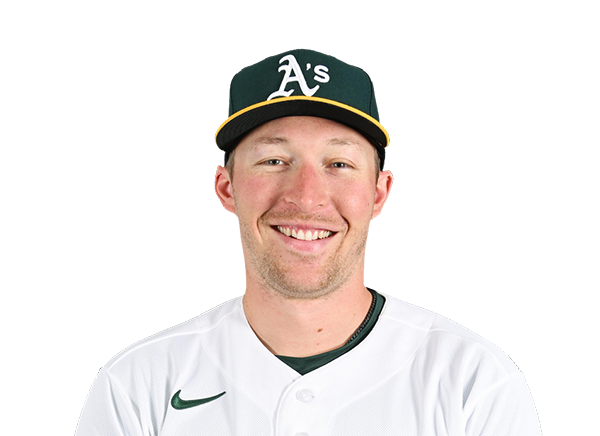 Brett Harris | 0-1 | 1 | 1 | 0 | 0 | 0 | 1 | 1 | 11 | .188 | .316 | .250 |
|
Drew Cavanaugh | 0-1 | 1 | 0 | 0 | 1 | 0 | 0 | 0 | 9 | .226 | .316 | .270 |
 Andrew Knizner | 1-1 | 1 | 0 | 1 | 0 | 0 | 0 | 0 | 7 | .231 | .306 | .369 |
 Christian Koss | 1-3 | 3 | 0 | 1 | 0 | 0 | 0 | 1 | 7 | .232 | .274 | .326 |
Minnesota Twins
| Player | IP | H | R | ER | BB | K | HR | PC-ST | ERA | PC |
|---|---|---|---|---|---|---|---|---|---|---|
 Taj Bradley | 6.0 | 3 | 1 | 1 | 3 | 6 | 0 | 104-67 | 3.73 | 104 |
 Kody Funderburk | 0.1 | 2 | 0 | 0 | 0 | 1 | 0 | 13-8 | 3.78 | 13 |
|
Andrew Morris | 1.0 | 0 | 0 | 0 | 1 | 1 | 0 | 19-10 | 4.27 | 19 |
 A.J. Minter | 0.2 | 1 | 0 | 0 | 0 | 1 | 0 | 9-5 | 2.47 | 9 |
 Jeff Hoffman | 1.0 | 0 | 1 | 1 | 2 | 1 | 0 | 24-11 | 3.55 | 24 |
San Francisco Giants
| Player | IP | H | R | ER | BB | K | HR | PC-ST | ERA | PC |
|---|---|---|---|---|---|---|---|---|---|---|
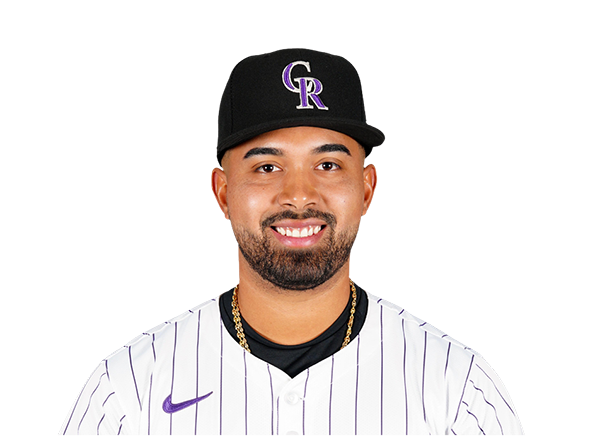 Anthony Molina | 6.0 | 4 | 2 | 2 | 1 | 6 | 0 | 85-57 | 3.97 | 85 |
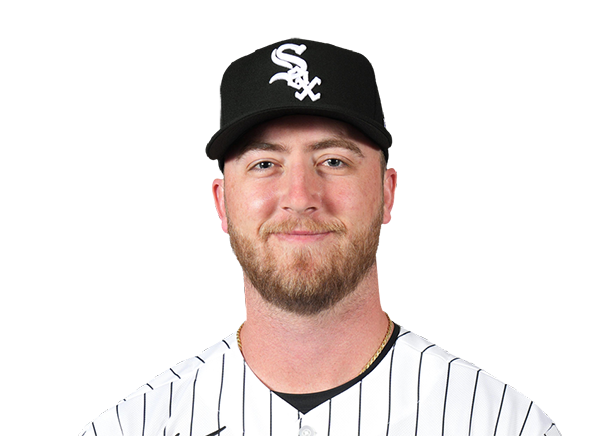 Duncan Davitt | 2.0 | 2 | 1 | 1 | 0 | 1 | 1 | 24-16 | 2.84 | 24 |
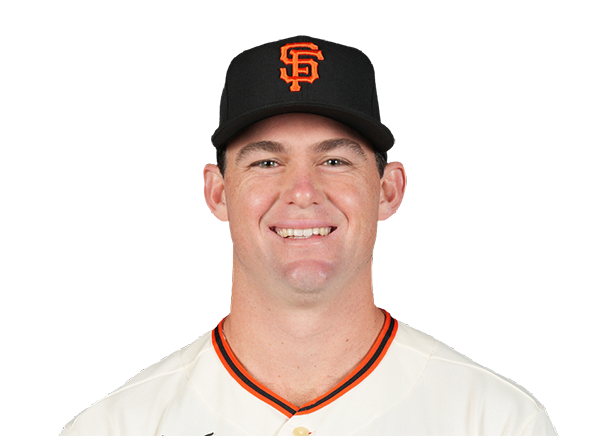 Carson Seymour | 1.0 | 0 | 0 | 0 | 0 | 0 | 0 | 5-4 | 4.85 | 5 |
H2H / Season Series
SF2–3
MIN
SF5–2
MIN
Last 5 Games
| Date | Opponent | Result |
|---|---|---|
| Sep 22 | @ SF | W3–2 |
| Sep 21 | @ SF | L2–5 |
| Sep 20 |  @ LAA | W8–0 |
| Sep 19 | @ LAA | L5–6 |
| Sep 18 | @ LAA | W3–0 |
| Date | Opponent | Result |
|---|---|---|
| Sep 22 | vs MIN | L2–3 |
| Sep 21 | vs MIN | W5–2 |
| Sep 20 |  @ LAD | L1–3 |
| Sep 19 | @ LAD | L4–10 |
| Sep 18 | @ LAD | L2–8 |
Standings
American League
| Team | W | L | PCT | GB | DIFF | STRK |
|---|---|---|---|---|---|---|
1 Rays | 96 | 61 | .611 | - | +86 | W1 |
2 Guardians | 82 | 75 | .522 | 14 | +3 | W6 |
3 Astros | 78 | 79 | .497 | 18 | -52 | W1 |
4 Yankees | 90 | 67 | .573 | 6 | +134 | L1 |
5 Red Sox | 84 | 73 | .535 | 12 | +79 | L3 |
6 White Sox | 81 | 76 | .516 | 15 | +45 | W3 |
7 Rangers | 78 | 79 | .497 | 18 | -37 | L2 |
8 Blue Jays | 77 | 80 | .490 | 19 | -43 | L1 |
9 Orioles | 76 | 81 | .484 | 20 | -30 | W1 |
| 10Twins | 74 | 84 | .468 | 22.5 | -66 | W1 |
11 Tigers | 74 | 84 | .468 | 22.5 | +73 | L1 |
12 Mariners | 73 | 84 | .465 | 23 | -63 | L1 |
13 Royals | 67 | 90 | .427 | 29 | -105 | L5 |
14 Athletics | 62 | 95 | .395 | 34 | -221 | W1 |
| 15Angels | 60 | 97 | .382 | 36 | -89 | L2 |
National League
| Team | W | L | PCT | GB | DIFF | STRK |
|---|---|---|---|---|---|---|
1 Brewers | 98 | 59 | .624 | - | +200 | L1 |
| 2Dodgers | 97 | 60 | .618 | 1 | +200 | W5 |
3 Braves | 92 | 65 | .586 | 6 | +116 | L1 |
4 Phillies | 87 | 70 | .554 | 11 | +31 | W2 |
5 Cubs | 87 | 70 | .554 | 11 | +146 | L1 |
6 Padres | 87 | 70 | .554 | 11 | +34 | L1 |
7 Diamondbacks | 83 | 74 | .529 | 15 | +4 | W3 |
8 Pirates | 80 | 77 | .510 | 18 | +31 | W5 |
9 Marlins | 77 | 80 | .490 | 21 | +3 | W1 |
10 Cardinals | 76 | 81 | .484 | 22 | -25 | L1 |
11 Nationals | 74 | 84 | .468 | 24.5 | +7 | W1 |
12 Reds | 73 | 84 | .465 | 25 | -159 | W1 |
13 Mets | 72 | 85 | .459 | 26 | -38 | W1 |
| 14Giants | 65 | 93 | .411 | 33.5 | -82 | L1 |
15 Rockies | 57 | 100 | .363 | 41 | -182 | L2 |
MIN
VS
SF
Pitchers
Taj Bradley
Catchers
Victor Caratini
Infielders
Brooks Lee
Kody Clemens
Royce Lewis
Ryan Kreidler
Outfielders
Luke Keaschall
Walker Jenkins
Emmanuel Rodriguez
Designated Hitters
Josh Bell
Pitchers
Anthony Molina
Catchers
Drew Cavanaugh
Infielders
Jonah Cox
Victor Bericoto
Shay Whitcomb
Christian Koss
Outfielders
Drew Gilbert
Turner Hill
Scott Bandura
Designated Hitters
Bo Davidson
Twins
VS
Giants
Batting
158
Team Games Played
158
5334
At Bats
5347
1299
Hits
1319
686
Runs Batted In
640
183
Home Runs
178
88
Stolen Bases
84
.244
Batting Average
.247
717
Runs
663
250
Doubles
257
23
Triples
25
2144
Total Bases
2160
494
Walks
443
1269
Strikeouts
1295
.316
On Base Percentage
.309
.402
Slugging Percentage
.404
.718
OBP Pct + SLG Pct
.713
158
Games Played
158
158
Games Started
158
91
Hit By Pitch
54
0.0
Wins Above Replacement
0.0
0.0
Offensive Wins Above Replacement
0.0
35
Caught Stealing
25
1
Is Qualified
1
684.6
Runs Created
675.6
4.4
Runs Created Per 27 Outs
4.3
.083
Walks Per Plate Appearance
.075
0.39
Walk To Strikeout Ratio
0.34
.158
Isolated Power
.157
.261
Secondary Average
.251
3.85
Pitches Per Plate Appearance
3.87
456
Extra Base Hits
460
5976
Plate Appearances
5926
29.1
At Bats Per Home Run
30.0
11
Sacrifice Hit
40
45
Sacrifice Flies
41
Pitching
158
Team Games Played
158
52
Quality Starts
52
74
Wins
65
84
Losses
93
44
Saves
30
109
Holds
84
1338
Hits
1312
713
Earned runs
675
181
Home Runs
154
574
Walks
583
1348
Strikeouts
1174
8.7
Strikeouts Per 9 Innings
7.6
150.4
Pitches Per Start
147.9
1.37
Walks Plus Hits Per Inning Pitched
1.36
4.58
Earned Run Average
4.36
84
Losses
93
1399.2
Innings pitched
1393.0
.468
Win Percentage
.411
65
Save Opportunities
56
.249
Opponent Batting Average
.248
.327
Opponent's On-base pct.
.328
.409
Opponent's Slugging pct.
.392
.736
Opponent's OPB Pct + SLG Pct
.719
5370
At Bats
5282
276
Doubles
228
19
Triples
33
70
Batters Hit
65
136
Stolen Bases
132
158
Games Played
158
1
Complete Games
1
5
Shutouts
10
44
Wild Pitches
56
749
Runs Batted In
702
6
Balks
5
1399.2
Innings pitched
1393.0
8.7
Strikeouts Per 9 Innings
7.6
21
Caught Stealing
37
158
Games Started
158
0.0
Wins Above Replacement
0.0
1
Is Qualified
1
783
Runs
745
713
Earned Runs
675
2195
Total Bases
2068
Fielding
158
Team Games Played
158
1400
Full Innings
1393
5471
Total Chances
5761
4199
Putouts
4179
1200
Assists
1477
72
Errors
105
250
Double Plays
257
0.987
Fielding Percentage
0.982
34.7
Range Factor
36.5
0.0
Zone Rating
0.0
158
Games Played
158
0
Games Started
0
0.0
Defensive Wins Above Replacement
0.0
1
Qualified
1