

Twins vs Guardians Live Score (10 May, 2026)
Game Information
Stage
Standard
Season
2026
First Pitch
Sun, May 10, 1:40 pm
Venue
Progressive Field
Location
Cleveland, Ohio
Attendance
22,475
Live Situation
1Balls
2Strikes
0Outs
—Pitcher
—At Bat
Pitch Sequence
1
STRIKE LOOKING
Four-seam FB
94 MPH
2
STRIKE LOOKING
Four-seam FB
96 MPH
3
STRIKE FOUL
Four-seam FB
97 MPH
4
STRIKE FOUL
Four-seam FB
97 MPH
5
BALL
Changeup
89 MPH
6
BALL IN PLAY
Four-seam FB
96 MPH
Injury Report
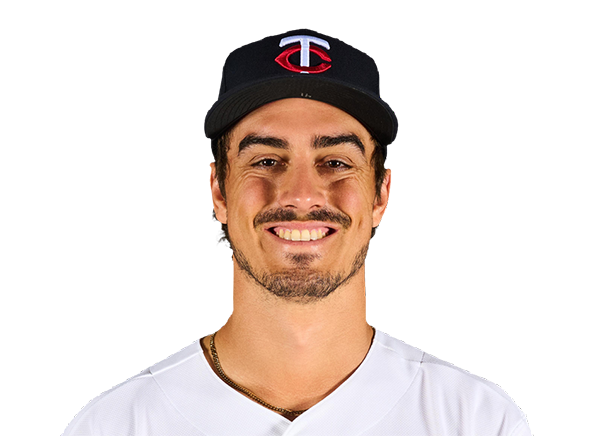
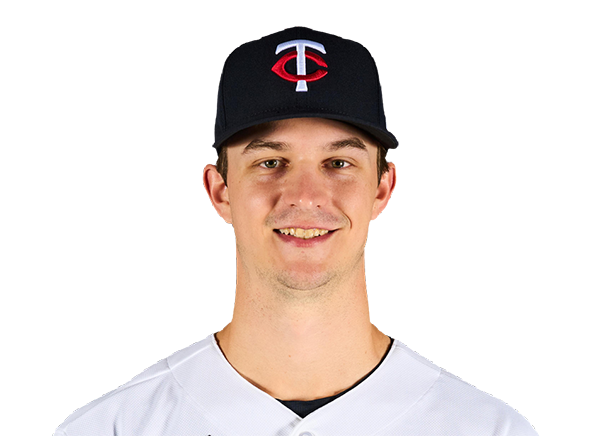
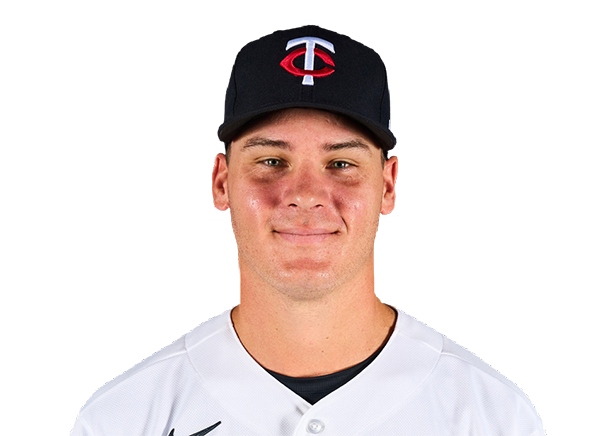
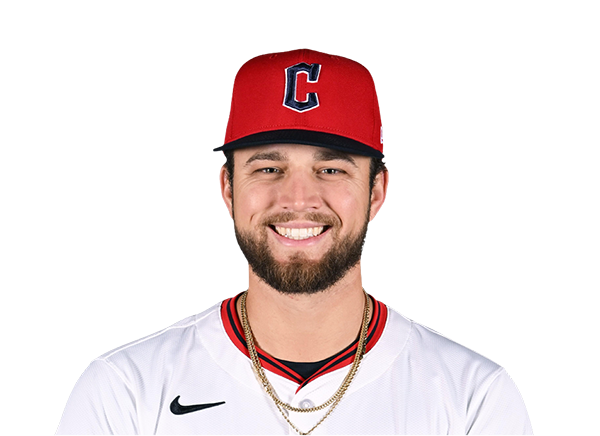
Team Stats
 MIN
CLE


5
Runs
4
13
Hits
11
1
Errors
0
0
Home Runs
0
2
Walks
6
8
Strikeouts
9
Player Box Score
Minnesota Twins
| Player | H-AB | AB | R | H | RBI | HR | BB | K | #P | AVG | OBP | SLG |
|---|---|---|---|---|---|---|---|---|---|---|---|---|
 Byron Buxton | 1-4 | 4 | 1 | 1 | 0 | 0 | 1 | 2 | 21 | .259 | .313 | .556 |
 Trevor Larnach | 1-4 | 4 | 0 | 1 | 0 | 0 | 0 | 1 | 13 | .263 | .386 | .379 |
 Victor Caratini | 0-1 | 1 | 0 | 0 | 0 | 0 | 0 | 0 | 5 | .198 | .289 | .240 |
 James Outman | 0-0 | 0 | 0 | 0 | 0 | 0 | 0 | 0 | 0 | .121 | .171 | .182 |
 Ryan Jeffers | 1-4 | 4 | 0 | 1 | 0 | 0 | 0 | 0 | 11 | .298 | .403 | .519 |
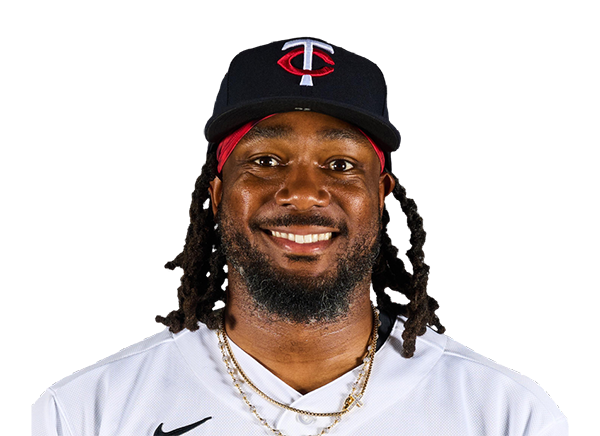 Josh Bell | 2-4 | 4 | 0 | 2 | 1 | 0 | 0 | 2 | 25 | .218 | .291 | .324 |
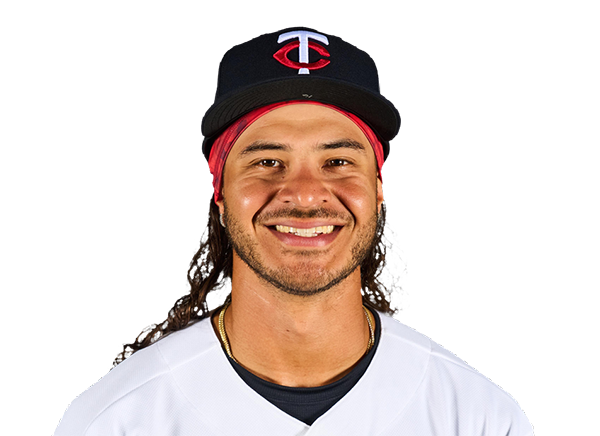 Austin Martin | 2-3 | 3 | 0 | 2 | 1 | 0 | 1 | 0 | 16 | .337 | .466 | .424 |
 Luke Keaschall | 0-4 | 4 | 0 | 0 | 0 | 0 | 0 | 1 | 15 | .226 | .311 | .301 |
 Kody Clemens | 3-4 | 4 | 2 | 3 | 0 | 0 | 0 | 0 | 13 | .209 | .321 | .374 |
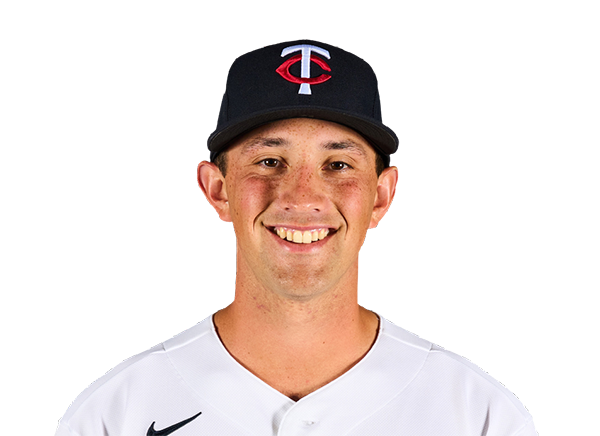 Brooks Lee | 2-3 | 3 | 1 | 2 | 1 | 0 | 0 | 0 | 7 | .276 | .326 | .425 |
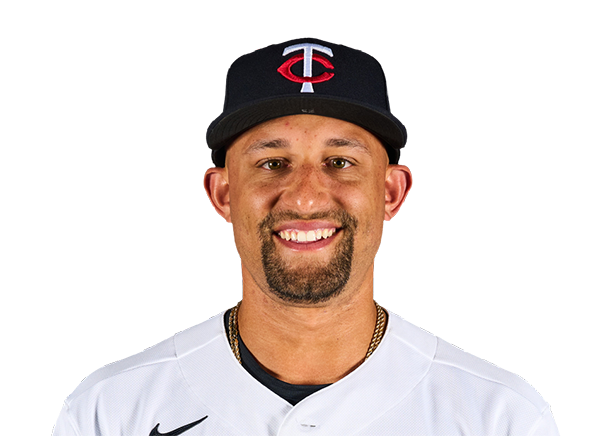 Royce Lewis | 1-4 | 4 | 1 | 1 | 1 | 0 | 0 | 2 | 17 | .170 | .267 | .307 |
Cleveland Guardians
| Player | H-AB | AB | R | H | RBI | HR | BB | K | #P | AVG | OBP | SLG |
|---|---|---|---|---|---|---|---|---|---|---|---|---|
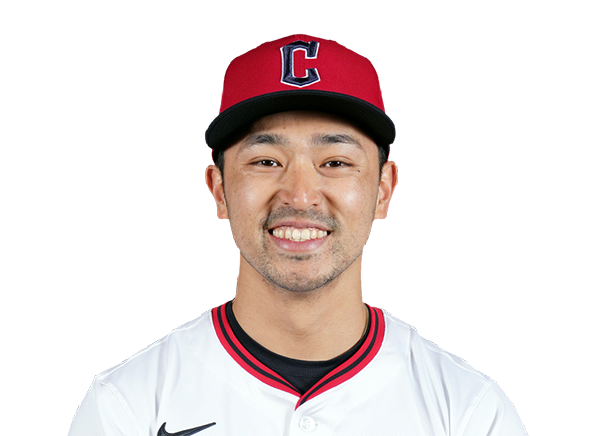 Steven Kwan | 0-4 | 4 | 0 | 0 | 0 | 0 | 0 | 2 | 20 | .208 | .304 | .268 |
 Chase DeLauter | 2-5 | 5 | 0 | 2 | 2 | 0 | 0 | 0 | 13 | .299 | .379 | .522 |
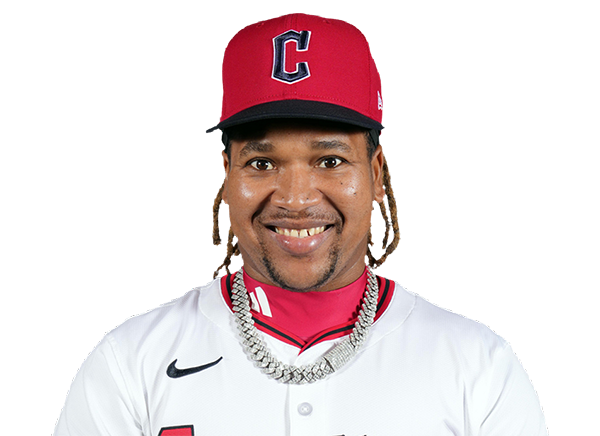 Jose Ramirez | 1-4 | 4 | 0 | 1 | 1 | 0 | 1 | 1 | 24 | .222 | .353 | .392 |
 Kyle Manzardo | 0-1 | 1 | 1 | 0 | 0 | 0 | 2 | 1 | 12 | .202 | .285 | .284 |
 Rhys Hoskins | 0-2 | 2 | 0 | 0 | 0 | 0 | 0 | 0 | 6 | .189 | .336 | .356 |
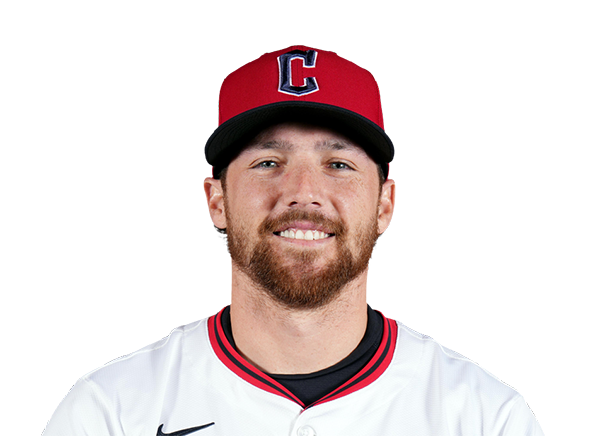 Daniel Schneemann | 1-4 | 4 | 0 | 1 | 0 | 0 | 1 | 2 | 21 | .274 | .358 | .462 |
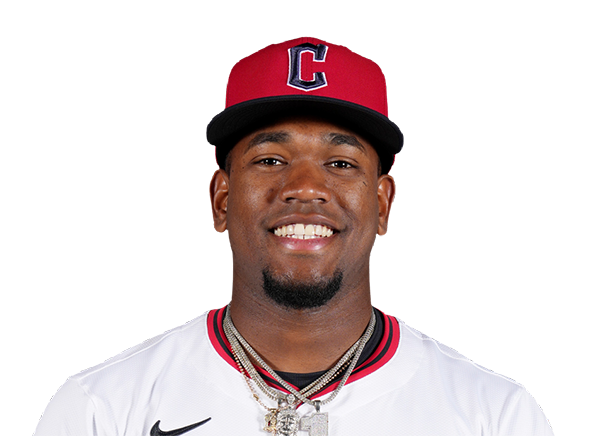 Angel Martinez | 1-5 | 5 | 0 | 1 | 1 | 0 | 0 | 2 | 16 | .250 | .293 | .427 |
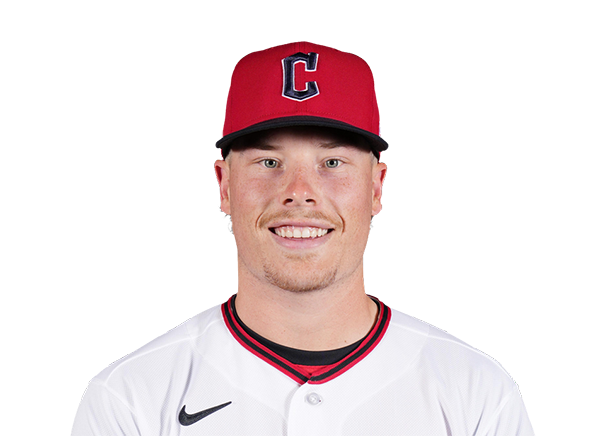 Travis Bazzana | 1-3 | 3 | 0 | 1 | 0 | 0 | 2 | 0 | 24 | .194 | .396 | .278 |
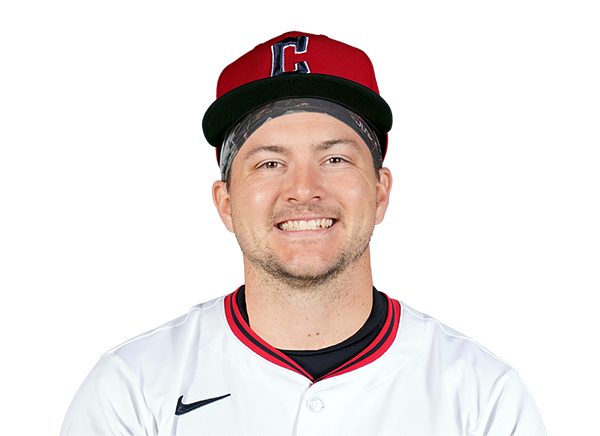 Patrick Bailey | 0-3 | 3 | 0 | 0 | 0 | 0 | 0 | 1 | 11 | .141 | .207 | .176 |
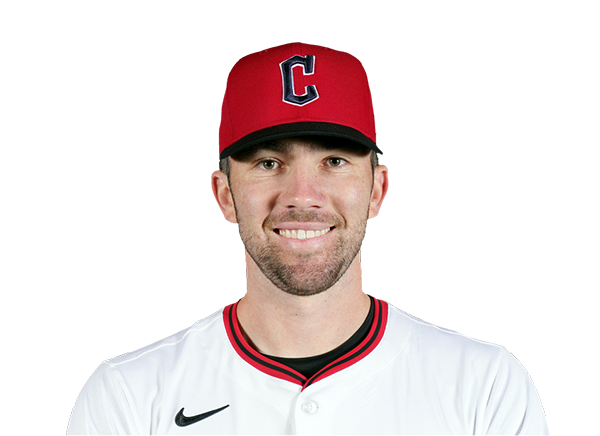 David Fry | 1-1 | 1 | 1 | 1 | 0 | 0 | 0 | 0 | 4 | .250 | .381 | .442 |
 Brayan Rocchio | 4-4 | 4 | 2 | 4 | 0 | 0 | 0 | 0 | 7 | .278 | .360 | .383 |
Minnesota Twins
| Player | IP | H | R | ER | BB | K | HR | PC-ST | ERA | PC |
|---|---|---|---|---|---|---|---|---|---|---|
 Andrew Morris | 1.0 | 0 | 0 | 0 | 0 | 0 | 0 | 6-4 | 4.67 | 6 |
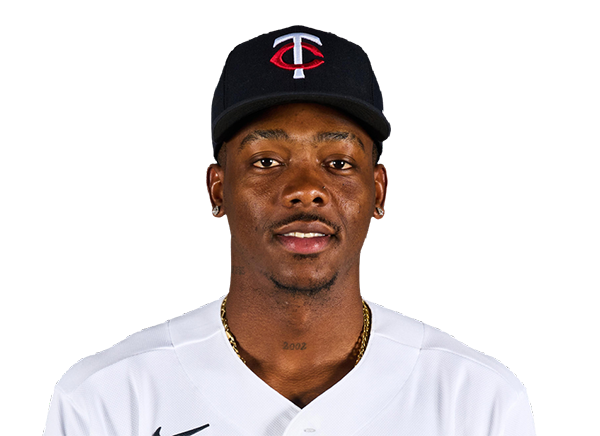 Kendry Rojas | 3.1 | 5 | 1 | 1 | 3 | 5 | 0 | 60-34 | 1.69 | 60 |
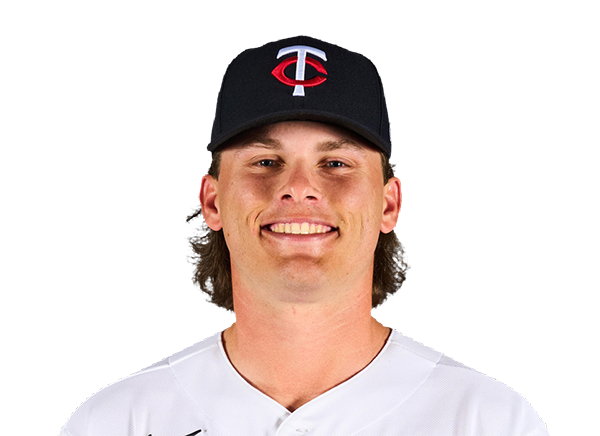 Travis Adams | 1.1 | 4 | 2 | 2 | 2 | 2 | 0 | 43-24 | 13.50 | 43 |
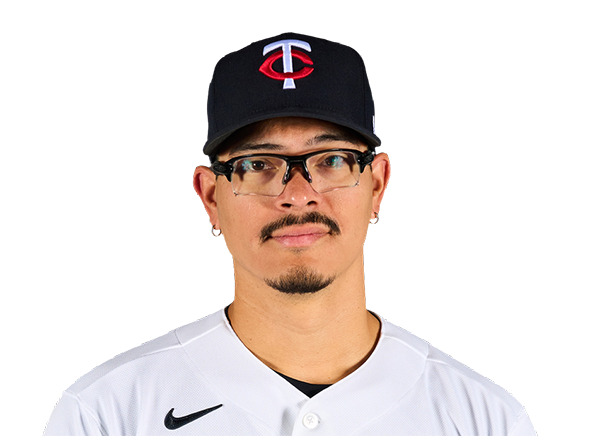 Anthony Banda | 1.1 | 0 | 0 | 0 | 0 | 2 | 0 | 19-11 | 7.64 | 19 |
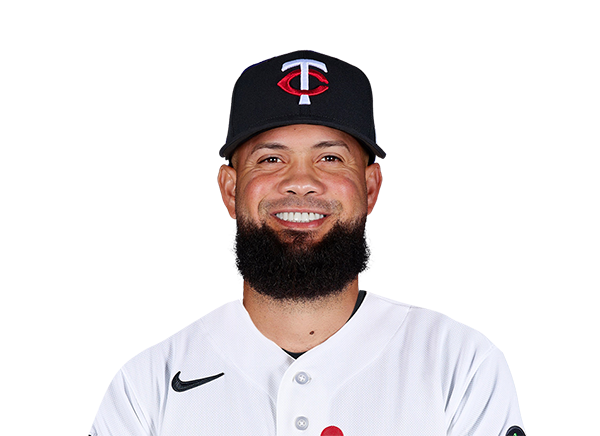 Luis Garcia | 1.0 | 2 | 1 | 1 | 1 | 0 | 0 | 20-10 | 10.50 | 20 |
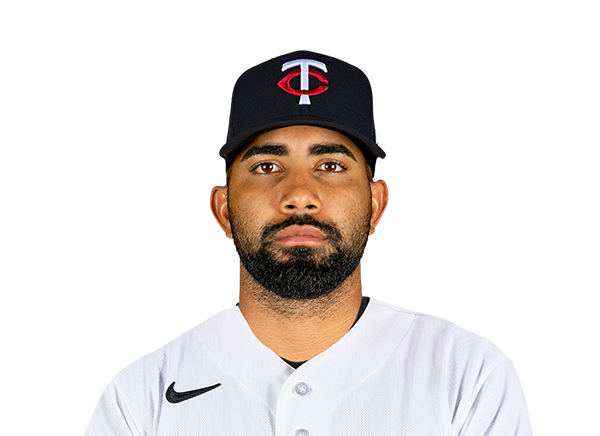 Yoendrys Gomez | 1.0 | 0 | 0 | 0 | 0 | 0 | 0 | 10-9 | 5.68 | 10 |
Cleveland Guardians
| Player | IP | H | R | ER | BB | K | HR | PC-ST | ERA | PC |
|---|---|---|---|---|---|---|---|---|---|---|
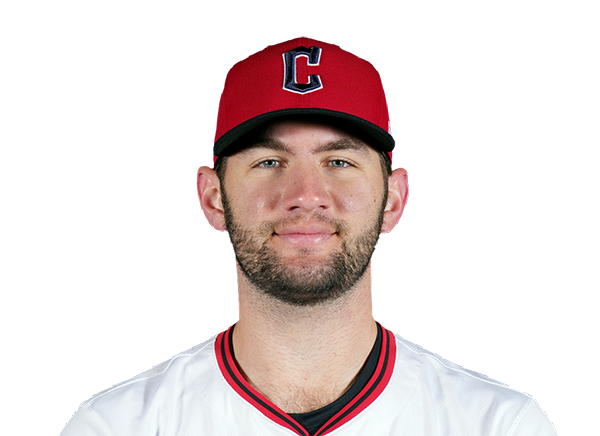 Gavin Williams | 6.0 | 10 | 5 | 5 | 1 | 6 | 0 | 101-73 | 3.74 | 101 |
 Franco Aleman | 2.0 | 2 | 0 | 0 | 0 | 1 | 0 | 28-19 | 0.00 | 28 |
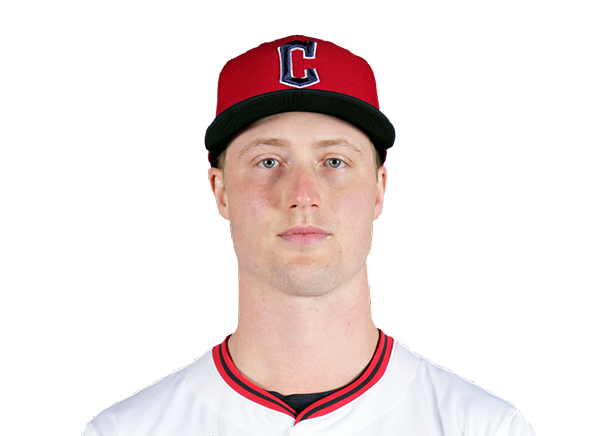 Tim Herrin | 1.0 | 1 | 0 | 0 | 1 | 1 | 0 | 14-11 | 0.00 | 14 |
H2H / Season Series
CLE1–3
MIN
CLE6–10
MIN
CLE5–2
MIN
CLE13–4
MIN
MIN2–5
CLE
MIN6–5
CLE
MIN3–1
CLE
CLE4–5
MIN
CLE1–2
MIN
CLE6–4
MIN
Last 5 Games
| Date | Opponent | Result |
|---|---|---|
| Aug 24 |  @ ATH | W9–6 |
| Aug 23 |  @ SD | L1–8 |
| Aug 22 | @ SD | L5–7 |
| Aug 21 | @ SD | L2–6 |
| Aug 19 |  vs ATL | W6–4 |
| Date | Opponent | Result |
|---|---|---|
| Aug 24 |  @ LAA | W4–2 |
| Aug 23 |  @ COL | W7–2 |
| Aug 22 | @ COL | W4–3 |
| Aug 21 | @ COL | W9–1 |
| Aug 20 |  vs SF | W5–2 |
Standings
American League
| Team | W | L | PCT | GB | DIFF | STRK |
|---|---|---|---|---|---|---|
1 Rays | 78 | 53 | .595 | - | +47 | W2 |
2 White Sox | 68 | 63 | .519 | 10 | +34 | L1 |
3 Rangers | 66 | 66 | .500 | 12.5 | -37 | W2 |
4 Yankees | 74 | 56 | .569 | 3.5 | +100 | W1 |
5 Red Sox | 72 | 59 | .550 | 6 | +101 | W4 |
| 6Guardians | 66 | 66 | .500 | 12.5 | -7 | W5 |
7 Astros | 65 | 66 | .496 | 13 | -44 | L2 |
| 8Twins | 64 | 68 | .485 | 14.5 | -51 | W1 |
9 Blue Jays | 64 | 68 | .485 | 14.5 | -55 | L1 |
10 Orioles | 63 | 68 | .481 | 15 | -35 | L1 |
11 Mariners | 63 | 69 | .477 | 15.5 | -54 | W1 |
12 Tigers | 61 | 70 | .466 | 17 | +70 | L6 |
13 Royals | 58 | 74 | .439 | 20.5 | -91 | W8 |
| 14Angels | 52 | 80 | .394 | 26.5 | -72 | L2 |
| 15Athletics | 51 | 81 | .386 | 27.5 | -190 | L1 |
National League
| Team | W | L | PCT | GB | DIFF | STRK |
|---|---|---|---|---|---|---|
1 Brewers | 81 | 50 | .618 | - | +161 | L1 |
2 Dodgers | 80 | 51 | .611 | 1 | +151 | W6 |
| 3Braves | 76 | 55 | .580 | 5 | +110 | W1 |
4 Cubs | 76 | 56 | .576 | 5.5 | +122 | W2 |
5 Phillies | 73 | 59 | .553 | 8.5 | +20 | L1 |
| 6Padres | 71 | 61 | .538 | 10.5 | +15 | L1 |
7 Diamondbacks | 69 | 63 | .523 | 12.5 | +2 | L1 |
8 Marlins | 67 | 65 | .508 | 14.5 | +19 | L1 |
9 Cardinals | 66 | 66 | .500 | 15.5 | -2 | L3 |
10 Pirates | 64 | 69 | .481 | 18 | +26 | W1 |
11 Reds | 62 | 70 | .470 | 19.5 | -99 | L2 |
12 Nationals | 62 | 71 | .466 | 20 | +20 | W1 |
13 Mets | 59 | 72 | .450 | 22 | -40 | L1 |
| 14Giants | 53 | 78 | .405 | 28 | -75 | W1 |
| 15Rockies | 50 | 81 | .382 | 31 | -146 | L7 |
MIN
VS
CLE
Pitchers
Andrew Morris
Kendry Rojas
Travis Adams
Anthony Banda
Luis Garcia
Yoendrys Gomez
Catchers
Ryan Jeffers
Infielders
Luke Keaschall
Kody Clemens
Brooks Lee
Royce Lewis
Outfielders
Byron Buxton
Trevor Larnach
James Outman
Austin Martin
Designated Hitters
Josh Bell
Other Players
Victor Caratini
Pitchers
Gavin Williams
Franco Aleman
Tim Herrin
Catchers
Patrick Bailey
David Fry
Infielders
Kyle Manzardo
Rhys Hoskins
Daniel Schneemann
Travis Bazzana
Brayan Rocchio
Outfielders
Steven Kwan
Chase DeLauter
Angel Martinez
Designated Hitters
Jose Ramirez
Twins
VS
Guardians
Batting
132
Team Games Played
132
4451
At Bats
4393
1096
Hits
1032
581
Runs Batted In
508
152
Home Runs
124
74
Stolen Bases
126
.246
Batting Average
.235
609
Runs
531
217
Doubles
196
19
Triples
13
1807
Total Bases
1626
425
Walks
478
1056
Strikeouts
1065
.320
On Base Percentage
.314
.406
Slugging Percentage
.370
.726
OBP Pct + SLG Pct
.684
132
Games Played
132
132
Games Started
0
72
Hit By Pitch
42
0.0
Wins Above Replacement
0.0
0.0
Offensive Wins Above Replacement
0.0
31
Caught Stealing
27
1
Is Qualified
1
586.3
Runs Created
538.6
4.5
Runs Created Per 27 Outs
4.1
.085
Walks Per Plate Appearance
.096
0.40
Walk To Strikeout Ratio
0.45
.160
Isolated Power
.135
.265
Secondary Average
.267
3.86
Pitches Per Plate Appearance
3.95
388
Extra Base Hits
333
4994
Plate Appearances
4973
29.3
At Bats Per Home Run
35.4
8
Sacrifice Hit
23
37
Sacrifice Flies
35
Pitching
132
Team Games Played
132
44
Quality Starts
47
64
Wins
66
68
Losses
66
38
Saves
38
89
Holds
100
1131
Hits
1040
604
Earned runs
485
152
Home Runs
149
484
Walks
433
1088
Strikeouts
1231
8.4
Strikeouts Per 9 Innings
9.5
150.1
Pitches Per Start
147.7
1.39
Walks Plus Hits Per Inning Pitched
1.26
4.67
Earned Run Average
3.73
68
Losses
66
1163.2
Innings pitched
1169.2
.485
Win Percentage
.500
53
Save Opportunities
52
.253
Opponent Batting Average
.236
.331
Opponent's On-base pct.
.310
.414
Opponent's Slugging pct.
.390
.745
Opponent's OPB Pct + SLG Pct
.700
4470
At Bats
4401
231
Doubles
201
16
Triples
15
56
Batters Hit
51
110
Stolen Bases
90
132
Games Played
132
1
Complete Games
0
3
Shutouts
4
35
Wild Pitches
50
631
Runs Batted In
513
6
Balks
2
1163.2
Innings pitched
1169.2
8.4
Strikeouts Per 9 Innings
9.5
20
Caught Stealing
19
132
Games Started
132
0.0
Wins Above Replacement
0.0
1
Is Qualified
1
660
Runs
538
604
Earned Runs
485
1850
Total Bases
1718
Fielding
132
Team Games Played
132
1164
Full Innings
1170
4562
Total Chances
4608
3491
Putouts
3509
1009
Assists
1031
62
Errors
68
217
Double Plays
196
0.986
Fielding Percentage
0.985
34.8
Range Factor
34.9
0.0
Zone Rating
0.0
132
Games Played
132
0
Games Started
0
0.0
Defensive Wins Above Replacement
0.0
1
Qualified
1