

Twins vs Rays Live Score (26 Apr, 2026)
Game Information
Stage
Standard
Season
2026
First Pitch
Sun, Apr 26, 1:40 pm
Venue
Tropicana Field
Location
St. Petersburg, Florida
Attendance
17,618
Live Situation
2Balls
2Strikes
0Outs
—Pitcher
—At Bat
Pitch Sequence
1
BALL
Changeup
84 MPH
2
STRIKE LOOKING
Changeup
82 MPH
3
STRIKE SWINGING
Changeup
82 MPH
4
STRIKE FOUL
Four-seam FB
97 MPH
5
BALL
Changeup
82 MPH
6
BALL IN PLAY
Changeup
82 MPH
Injury Report

Team Stats
 MIN
TB


2
Runs
4
5
Hits
9
1
Errors
1
1
Home Runs
1
4
Walks
4
6
Strikeouts
4
Player Box Score
Minnesota Twins
| Player | H-AB | AB | R | H | RBI | HR | BB | K | #P | AVG | OBP | SLG |
|---|---|---|---|---|---|---|---|---|---|---|---|---|
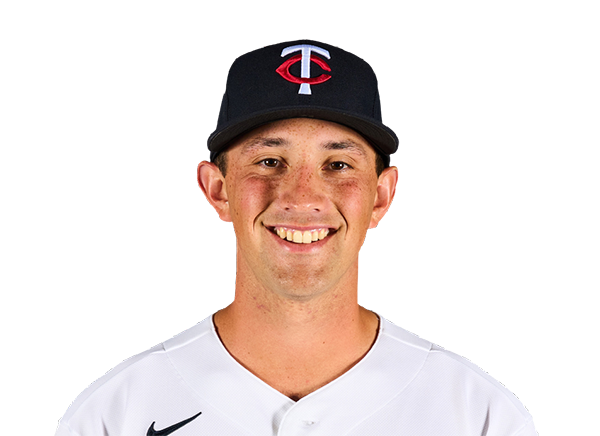 Brooks Lee | 1-3 | 3 | 1 | 1 | 2 | 1 | 1 | 0 | 15 | .253 | .316 | .448 |
 Trevor Larnach | 0-3 | 3 | 0 | 0 | 0 | 0 | 1 | 1 | 12 | .241 | .406 | .352 |
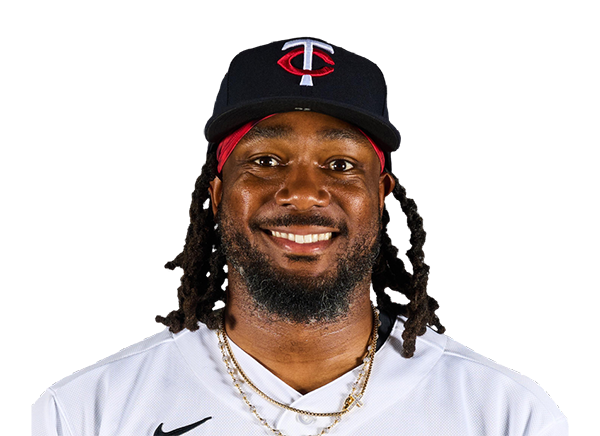 Josh Bell | 0-4 | 4 | 0 | 0 | 0 | 0 | 0 | 1 | 14 | .234 | .330 | .383 |
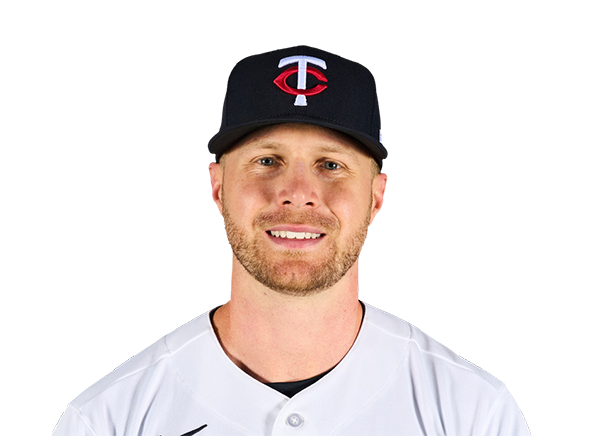 Ryan Jeffers | 1-3 | 3 | 0 | 1 | 0 | 0 | 1 | 0 | 20 | .269 | .402 | .463 |
 Kody Clemens | 1-4 | 4 | 0 | 1 | 0 | 0 | 0 | 1 | 16 | .175 | .266 | .316 |
 Luke Keaschall | 1-4 | 4 | 0 | 1 | 0 | 0 | 0 | 1 | 23 | .208 | .254 | .264 |
 Matt Wallner | 0-3 | 3 | 0 | 0 | 0 | 0 | 1 | 0 | 14 | .180 | .277 | .303 |
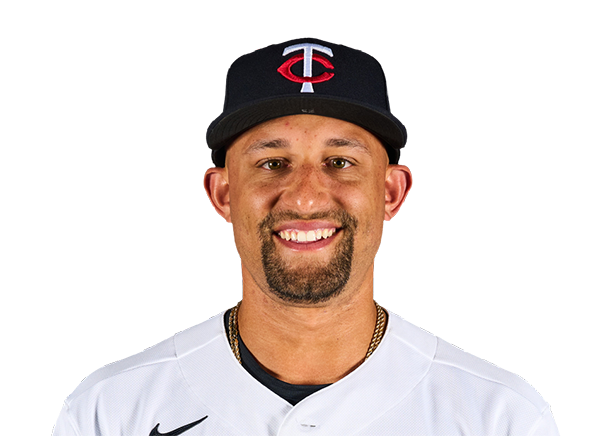 Royce Lewis | 0-4 | 4 | 0 | 0 | 0 | 0 | 0 | 2 | 16 | .196 | .308 | .393 |
 James Outman | 1-4 | 4 | 1 | 1 | 0 | 0 | 0 | 0 | 15 | .115 | .179 | .192 |
Tampa Bay Rays
| Player | H-AB | AB | R | H | RBI | HR | BB | K | #P | AVG | OBP | SLG |
|---|---|---|---|---|---|---|---|---|---|---|---|---|
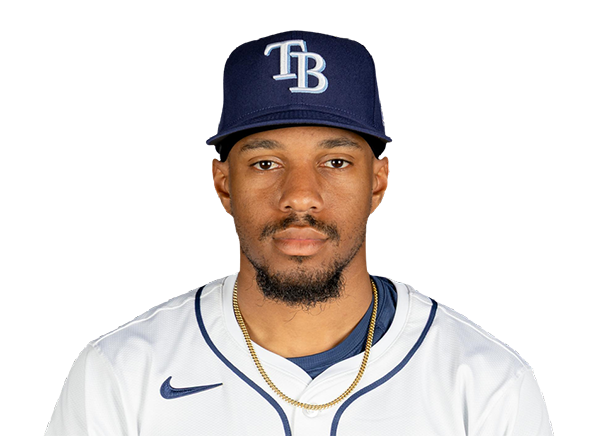 Chandler Simpson | 3-4 | 4 | 1 | 3 | 0 | 0 | 0 | 0 | 9 | .321 | .354 | .358 |
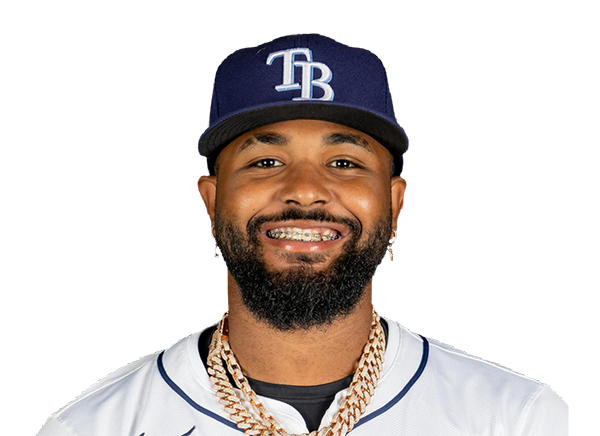 Junior Caminero | 0-4 | 4 | 0 | 0 | 0 | 0 | 0 | 0 | 17 | .259 | .336 | .509 |
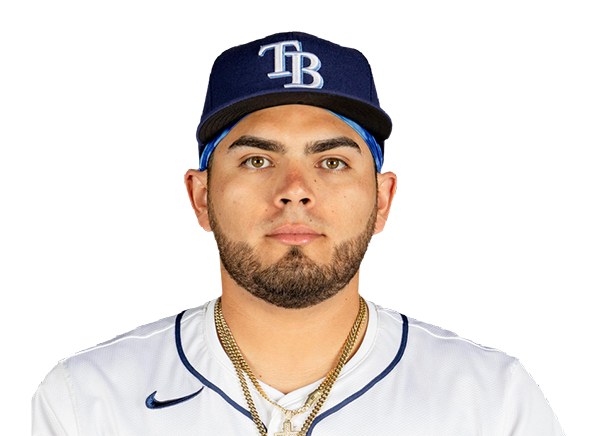 Jonathan Aranda | 1-4 | 4 | 1 | 1 | 2 | 0 | 0 | 1 | 18 | .227 | .350 | .454 |
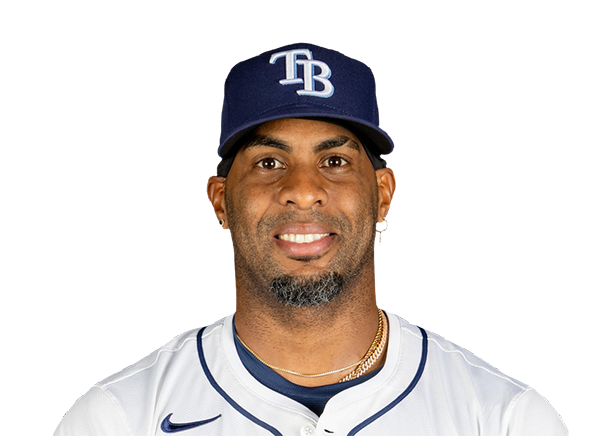 Yandy Diaz | 1-3 | 3 | 1 | 1 | 2 | 1 | 1 | 0 | 15 | .337 | .425 | .500 |
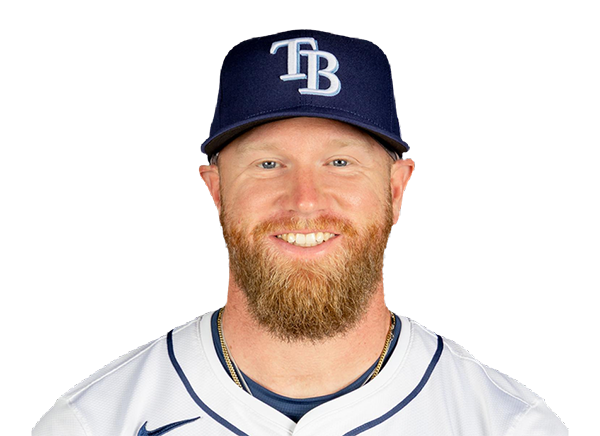 Jake Fraley | 1-3 | 3 | 0 | 1 | 0 | 0 | 1 | 1 | 18 | .245 | .322 | .453 |
 Jonny DeLuca | 0-0 | 0 | 0 | 0 | 0 | 0 | 0 | 0 | 0 | .286 | .322 | .482 |
 Ben Williamson | 1-4 | 4 | 0 | 1 | 0 | 0 | 0 | 1 | 13 | .260 | .333 | .356 |
 Cedric Mullins | 0-4 | 4 | 0 | 0 | 0 | 0 | 0 | 0 | 6 | .138 | .200 | .253 |
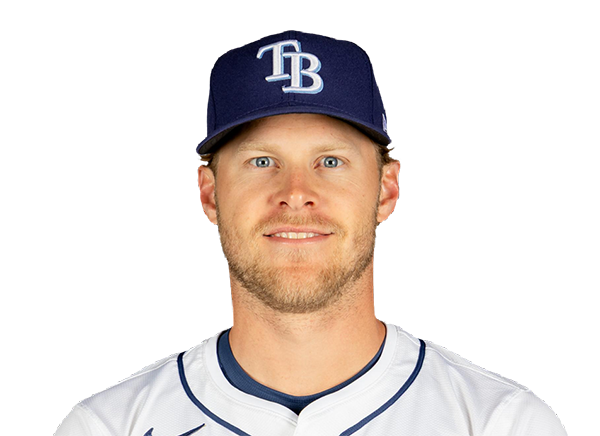 Taylor Walls | 1-2 | 2 | 0 | 1 | 0 | 0 | 1 | 1 | 13 | .212 | .281 | .250 |
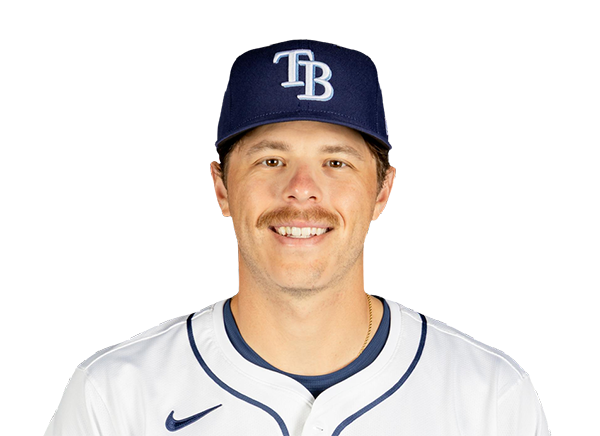 Hunter Feduccia | 1-1 | 1 | 1 | 1 | 0 | 0 | 1 | 0 | 8 | .250 | .382 | .250 |
 Nick Fortes | 0-1 | 1 | 0 | 0 | 0 | 0 | 0 | 0 | 7 | .290 | .338 | .406 |
Minnesota Twins
| Player | IP | H | R | ER | BB | K | HR | PC-ST | ERA | PC |
|---|---|---|---|---|---|---|---|---|---|---|
 Simeon Woods Richardson | 4.1 | 8 | 4 | 4 | 3 | 2 | 1 | 78-47 | 6.30 | 78 |
 Anthony Banda | 0.2 | 0 | 0 | 0 | 0 | 1 | 0 | 9-5 | 8.74 | 9 |
 Kody Funderburk | 1.1 | 0 | 0 | 0 | 1 | 0 | 0 | 20-11 | 1.74 | 20 |
 Cole Sands | 0.2 | 0 | 0 | 0 | 0 | 0 | 0 | 7-4 | 3.27 | 7 |
 Justin Topa | 1.0 | 1 | 0 | 0 | 0 | 1 | 0 | 10-8 | 3.55 | 10 |
Tampa Bay Rays
| Player | IP | H | R | ER | BB | K | HR | PC-ST | ERA | PC |
|---|---|---|---|---|---|---|---|---|---|---|
 Griffin Jax | 2.1 | 1 | 0 | 0 | 1 | 2 | 0 | 31-20 | 6.35 | 31 |
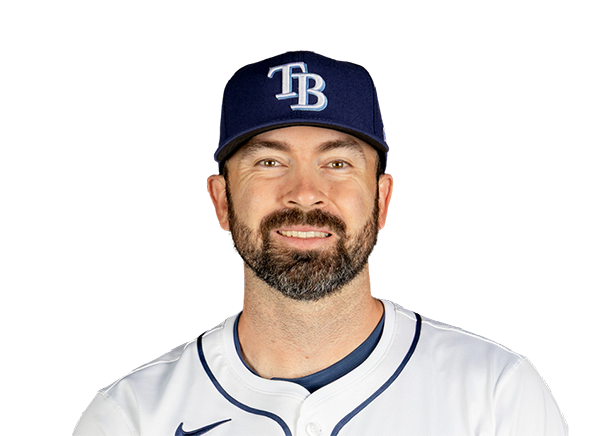 Jesse Scholtens | 4.1 | 3 | 2 | 2 | 3 | 1 | 1 | 72-47 | 3.20 | 72 |
 Cole Sulser | 1.1 | 1 | 0 | 0 | 0 | 2 | 0 | 26-17 | 3.45 | 26 |
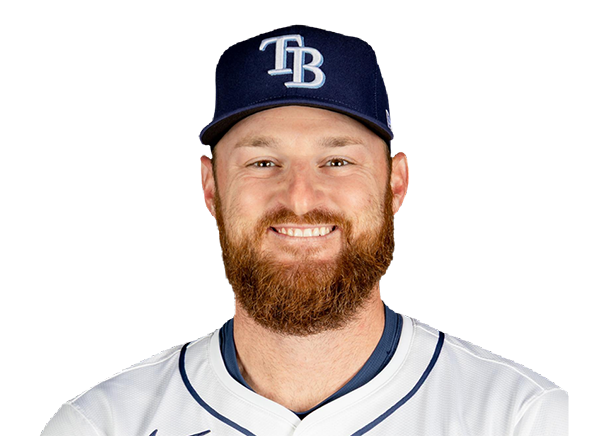 Bryan Baker | 1.0 | 0 | 0 | 0 | 0 | 1 | 0 | 16-12 | 3.48 | 16 |
H2H / Season Series
TB4–2
MIN
TB6–1
MIN
TB6–2
MIN
MIN1–4
TB
MIN1–7
TB
MIN10–4
TB
TB3–2
MIN
MIN6–9
TB
TB5–6
MIN
MIN3–5
TB
Last 5 Games
| Date | Opponent | Result |
|---|---|---|
| Aug 22 |  @ SD | L5–7 |
| Aug 21 | @ SD | L2–6 |
| Aug 19 |  vs ATL | W6–4 |
| Aug 18 | vs ATL | W4–1 |
| Aug 17 | vs ATL | W4–2 |
| Date | Opponent | Result |
|---|---|---|
| Aug 22 |  @ BAL | L2–3 |
| Aug 21 | @ BAL | L3–5 |
| Aug 20 |  vs TOR | L1–5 |
| Aug 19 | vs TOR | W7–6 |
| Aug 18 | vs TOR | L5–10 |
Standings
American League
| Team | W | L | PCT | GB | DIFF | STRK |
|---|---|---|---|---|---|---|
| 1Rays | 76 | 53 | .589 | - | +42 | L3 |
2 White Sox | 67 | 62 | .519 | 9 | +42 | L1 |
3 Astros | 65 | 65 | .500 | 11.5 | -43 | L1 |
4 Yankees | 73 | 56 | .566 | 3 | +95 | L1 |
5 Red Sox | 70 | 59 | .543 | 6 | +98 | W2 |
6 Rangers | 64 | 66 | .492 | 12.5 | -48 | L1 |
7 Guardians | 64 | 66 | .492 | 12.5 | -14 | W3 |
| 8Blue Jays | 64 | 67 | .489 | 13 | -50 | W1 |
| 9Twins | 63 | 67 | .485 | 13.5 | -47 | L2 |
| 10Orioles | 63 | 67 | .485 | 13.5 | -33 | W2 |
11 Mariners | 62 | 68 | .477 | 14.5 | -44 | W2 |
12 Tigers | 61 | 68 | .473 | 15 | +77 | L4 |
13 Royals | 57 | 74 | .435 | 20 | -95 | W7 |
14 Angels | 52 | 78 | .400 | 24.5 | -68 | W1 |
15 Athletics | 50 | 80 | .385 | 26.5 | -188 | W1 |
National League
| Team | W | L | PCT | GB | DIFF | STRK |
|---|---|---|---|---|---|---|
1 Brewers | 81 | 49 | .623 | - | +163 | W3 |
2 Dodgers | 79 | 51 | .608 | 2 | +147 | W5 |
| 3Braves | 75 | 55 | .577 | 6 | +108 | L2 |
4 Cubs | 74 | 56 | .569 | 7 | +98 | L3 |
5 Phillies | 72 | 58 | .554 | 9 | +25 | W8 |
| 6Padres | 70 | 60 | .538 | 11 | +9 | W2 |
7 Diamondbacks | 68 | 62 | .523 | 13 | +7 | L1 |
8 Marlins | 66 | 64 | .508 | 15 | +17 | W2 |
9 Cardinals | 66 | 65 | .504 | 15.5 | 0 | L2 |
10 Pirates | 63 | 68 | .481 | 18.5 | +29 | L2 |
11 Reds | 62 | 68 | .477 | 19 | -92 | W1 |
12 Nationals | 61 | 70 | .466 | 20.5 | +14 | L3 |
13 Mets | 59 | 71 | .454 | 22 | -39 | W1 |
14 Giants | 52 | 77 | .403 | 28.5 | -79 | L3 |
15 Rockies | 50 | 79 | .388 | 30.5 | -131 | L5 |
MIN
VS
TB
Pitchers
Simeon Woods Richardson
Anthony Banda
Kody Funderburk
Cole Sands
Justin Topa
Catchers
Ryan Jeffers
Infielders
Brooks Lee
Kody Clemens
Luke Keaschall
Royce Lewis
Outfielders
Trevor Larnach
Matt Wallner
James Outman
Designated Hitters
Josh Bell
Pitchers
Griffin Jax
Jesse Scholtens
Cole Sulser
Bryan Baker
Catchers
Hunter Feduccia
Nick Fortes
Infielders
Junior Caminero
Jonathan Aranda
Ben Williamson
Taylor Walls
Outfielders
Chandler Simpson
Jake Fraley
Jonny DeLuca
Cedric Mullins
Designated Hitters
Yandy Diaz
Twins
VS
Rays
Batting
130
Team Games Played
129
4379
At Bats
4337
1074
Hits
1131
571
Runs Batted In
556
150
Home Runs
135
74
Stolen Bases
128
.245
Batting Average
.261
599
Runs
584
212
Doubles
183
19
Triples
20
1774
Total Bases
1759
422
Walks
416
1045
Strikeouts
913
.319
On Base Percentage
.330
.405
Slugging Percentage
.406
.724
OBP Pct + SLG Pct
.735
130
Games Played
129
130
Games Started
129
71
Hit By Pitch
47
0.0
Wins Above Replacement
0.0
0.0
Offensive Wins Above Replacement
0.0
31
Caught Stealing
42
1
Is Qualified
1
576.1
Runs Created
589.5
4.5
Runs Created Per 27 Outs
4.7
.086
Walks Per Plate Appearance
.085
0.40
Walk To Strikeout Ratio
0.46
.160
Isolated Power
.145
.266
Secondary Average
.261
3.86
Pitches Per Plate Appearance
3.78
381
Extra Base Hits
338
4916
Plate Appearances
4874
29.2
At Bats Per Home Run
32.1
7
Sacrifice Hit
36
36
Sacrifice Flies
35
Pitching
130
Team Games Played
129
43
Quality Starts
39
63
Wins
76
67
Losses
53
37
Saves
50
89
Holds
97
1110
Hits
1014
592
Earned runs
493
149
Home Runs
166
473
Walks
329
1076
Strikeouts
1056
8.4
Strikeouts Per 9 Innings
8.3
150.0
Pitches Per Start
139.8
1.38
Walks Plus Hits Per Inning Pitched
1.17
4.65
Earned Run Average
3.85
67
Losses
53
1146.2
Innings pitched
1151.0
.485
Win Percentage
.589
52
Save Opportunities
65
.252
Opponent Batting Average
.234
.330
Opponent's On-base pct.
.293
.412
Opponent's Slugging pct.
.401
.742
Opponent's OPB Pct + SLG Pct
.694
4401
At Bats
4331
226
Doubles
199
16
Triples
13
55
Batters Hit
48
109
Stolen Bases
109
130
Games Played
129
1
Complete Games
1
3
Shutouts
11
34
Wild Pitches
35
617
Runs Batted In
518
6
Balks
2
1146.2
Innings pitched
1151.0
8.4
Strikeouts Per 9 Innings
8.3
19
Caught Stealing
29
130
Games Started
129
0.0
Wins Above Replacement
0.0
1
Is Qualified
1
646
Runs
542
592
Earned Runs
493
1815
Total Bases
1737
Fielding
130
Team Games Played
129
1147
Full Innings
1151
4492
Total Chances
4547
3440
Putouts
3453
991
Assists
1017
61
Errors
77
212
Double Plays
183
0.986
Fielding Percentage
0.983
34.8
Range Factor
35.0
0.0
Zone Rating
0.0
130
Games Played
129
0
Games Started
0
0.0
Defensive Wins Above Replacement
0.0
1
Qualified
1