

Twins vs Royals Live Score (30 Mar, 2026)
Game Information
Stage
Standard
Season
2026
First Pitch
Mon, Mar 30, 4:10 pm
Venue
Kauffman Stadium
Location
Kansas City, Missouri
Attendance
39,320
Live Situation
1Balls
1Strikes
0Outs
—Pitcher
—At Bat
Pitch Sequence
1
STRIKE LOOKING
Sweeper
82 MPH
2
BALL
Four-seam FB
93 MPH
3
BALL IN PLAY
Four-seam FB
93 MPH
Injury Report

Team Stats
 MIN
KC


1
Runs
3
4
Hits
7
0
Errors
0
1
Home Runs
2
3
Walks
2
6
Strikeouts
7
Player Box Score
Minnesota Twins
| Player | H-AB | AB | R | H | RBI | HR | BB | K | #P | AVG | OBP | SLG |
|---|---|---|---|---|---|---|---|---|---|---|---|---|
 Austin Martin | 1-1 | 1 | 0 | 1 | 0 | 0 | 2 | 0 | 16 | .400 | .571 | .400 |
 Trevor Larnach | 0-1 | 1 | 0 | 0 | 0 | 0 | 0 | 0 | 2 | .333 | .429 | .500 |
 James Outman | 0-0 | 0 | 0 | 0 | 0 | 0 | 0 | 0 | 0 | .000 | .333 | .000 |
 Byron Buxton | 0-4 | 4 | 0 | 0 | 0 | 0 | 0 | 1 | 14 | .250 | .294 | .438 |
 Luke Keaschall | 0-3 | 3 | 0 | 0 | 0 | 0 | 1 | 0 | 15 | .143 | .235 | .143 |
 Ryan Jeffers | 1-4 | 4 | 0 | 1 | 0 | 0 | 0 | 0 | 12 | .182 | .250 | .182 |
 Matt Wallner | 1-4 | 4 | 1 | 1 | 1 | 1 | 0 | 0 | 13 | .143 | .294 | .357 |
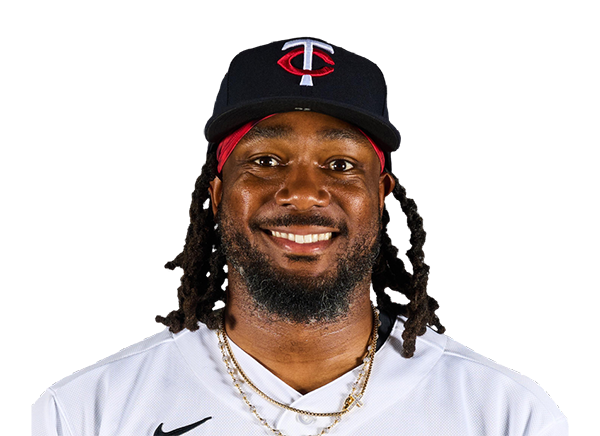 Josh Bell | 0-3 | 3 | 0 | 0 | 0 | 0 | 0 | 1 | 9 | .167 | .313 | .333 |
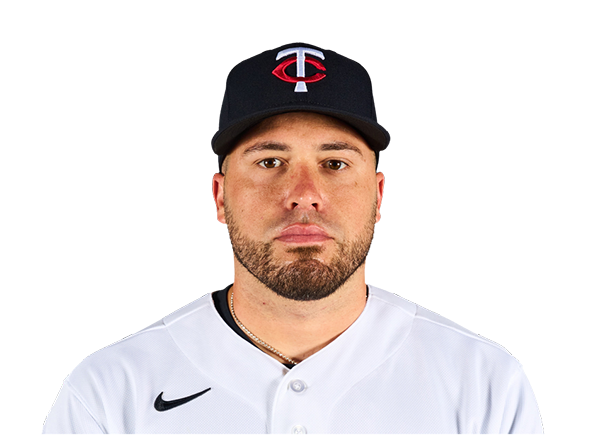 Victor Caratini | 0-3 | 3 | 0 | 0 | 0 | 0 | 0 | 1 | 9 | .273 | .333 | .273 |
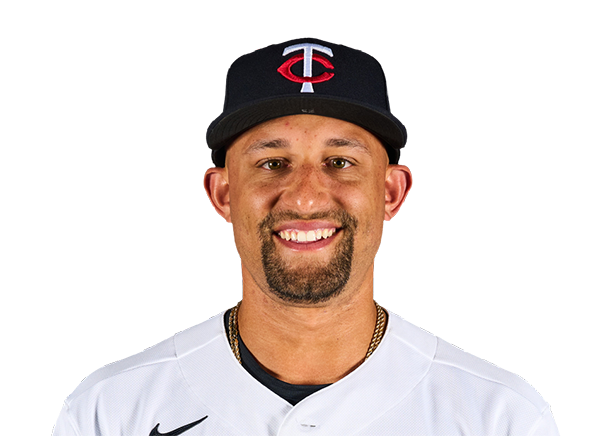 Royce Lewis | 0-3 | 3 | 0 | 0 | 0 | 0 | 0 | 2 | 7 | .167 | .286 | .667 |
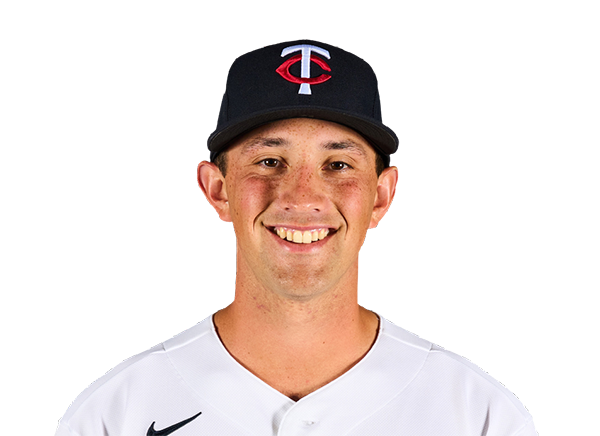 Brooks Lee | 1-3 | 3 | 0 | 1 | 0 | 0 | 0 | 1 | 10 | .111 | .111 | .111 |
Kansas City Royals
| Player | H-AB | AB | R | H | RBI | HR | BB | K | #P | AVG | OBP | SLG |
|---|---|---|---|---|---|---|---|---|---|---|---|---|
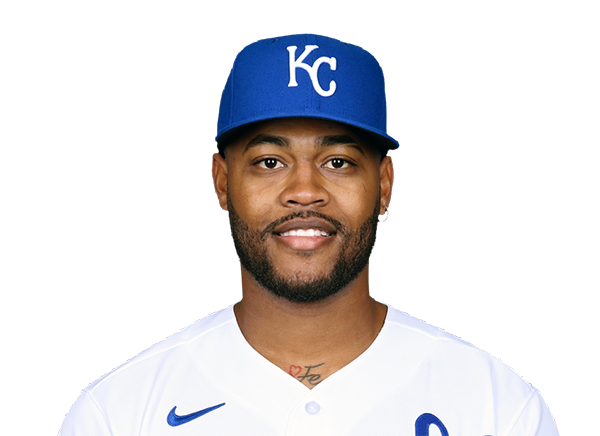 Maikel Garcia | 2-4 | 4 | 0 | 2 | 0 | 0 | 0 | 1 | 23 | .286 | .412 | .357 |
 Bobby Witt Jr. | 0-4 | 4 | 0 | 0 | 0 | 0 | 0 | 0 | 12 | .267 | .313 | .267 |
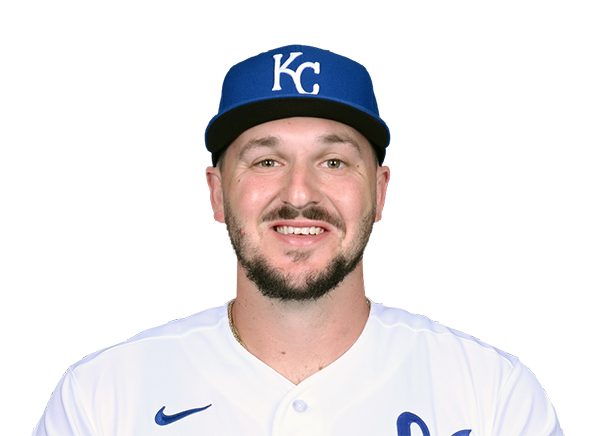 Vinnie Pasquantino | 0-2 | 2 | 0 | 0 | 0 | 0 | 2 | 1 | 19 | .154 | .313 | .154 |
 Salvador Perez | 1-4 | 4 | 0 | 1 | 0 | 0 | 0 | 1 | 16 | .188 | .188 | .375 |
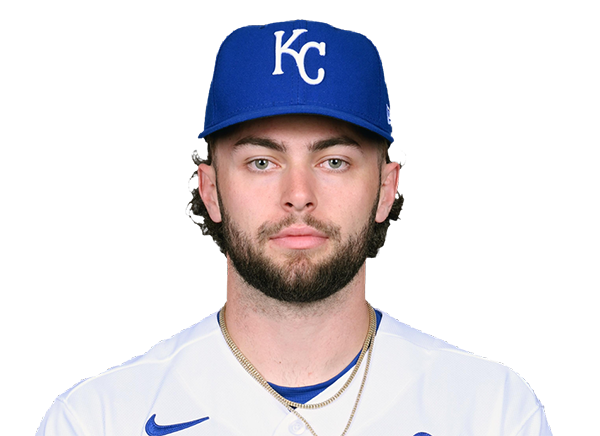 Carter Jensen | 0-3 | 3 | 0 | 0 | 0 | 0 | 0 | 1 | 13 | .091 | .154 | .364 |
 Lane Thomas | 0-1 | 1 | 0 | 0 | 0 | 0 | 0 | 0 | 5 | .111 | .200 | .111 |
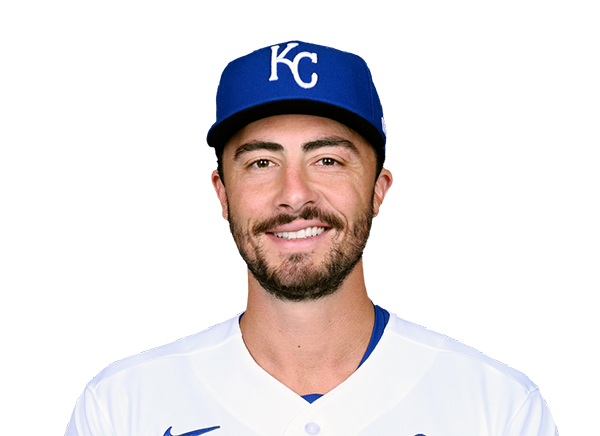 Jonathan India | 1-3 | 3 | 1 | 1 | 0 | 0 | 0 | 0 | 10 | .100 | .182 | .100 |
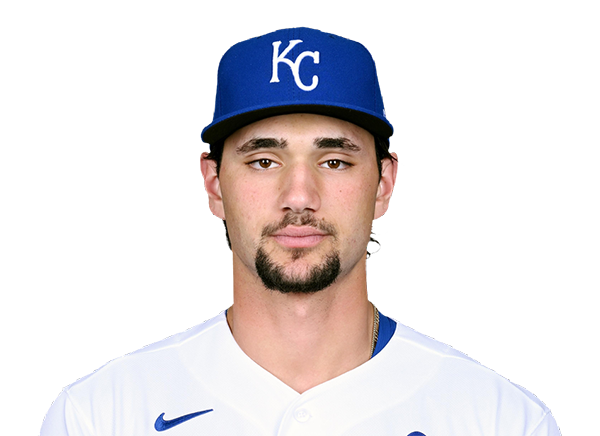 Jac Caglianone | 0-3 | 3 | 0 | 0 | 0 | 0 | 0 | 2 | 12 | .200 | .273 | .300 |
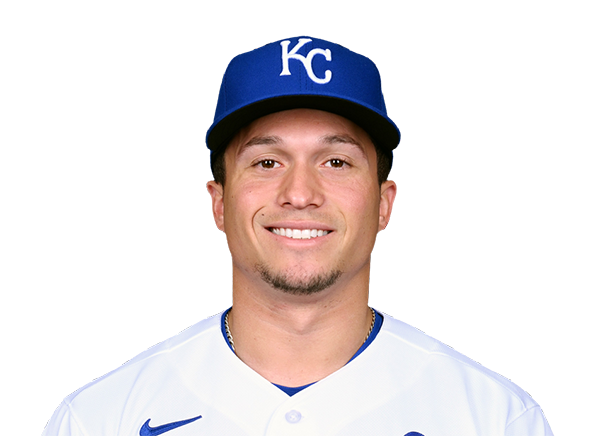 Isaac Collins | 1-3 | 3 | 1 | 1 | 1 | 1 | 0 | 1 | 13 | .111 | .200 | .444 |
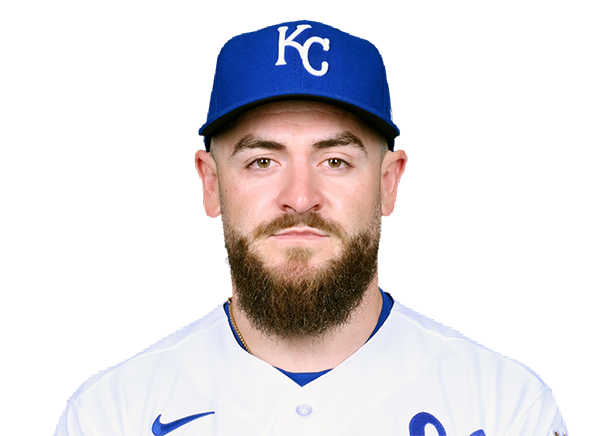 Kyle Isbel | 2-3 | 3 | 1 | 2 | 2 | 1 | 0 | 0 | 10 | .400 | .400 | .700 |
Minnesota Twins
| Player | IP | H | R | ER | BB | K | HR | PC-ST | ERA | PC |
|---|---|---|---|---|---|---|---|---|---|---|
 Simeon Woods Richardson | 5.0 | 5 | 2 | 2 | 1 | 2 | 1 | 83-45 | 3.60 | 83 |
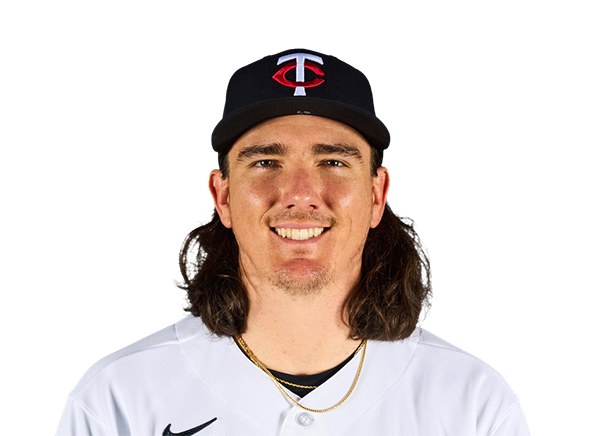 Kody Funderburk | 1.1 | 2 | 1 | 1 | 1 | 3 | 1 | 26-15 | 6.75 | 26 |
 Justin Topa | 0.2 | 0 | 0 | 0 | 0 | 1 | 0 | 10-6 | 3.38 | 10 |
 Taylor Rogers | 1.0 | 0 | 0 | 0 | 0 | 1 | 0 | 14-8 | 0.00 | 14 |
Kansas City Royals
| Player | IP | H | R | ER | BB | K | HR | PC-ST | ERA | PC |
|---|---|---|---|---|---|---|---|---|---|---|
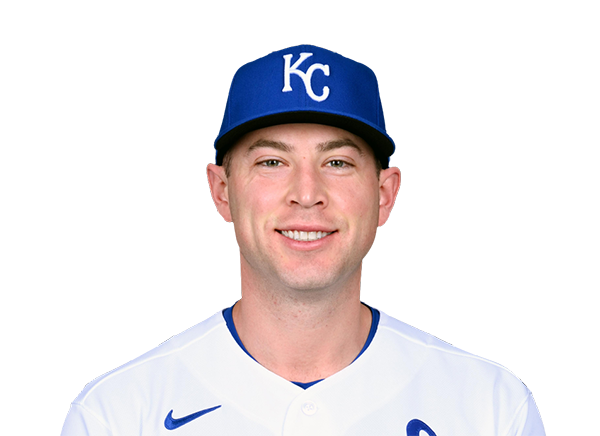 Kris Bubic | 6.0 | 2 | 1 | 1 | 3 | 4 | 1 | 75-48 | 1.50 | 75 |
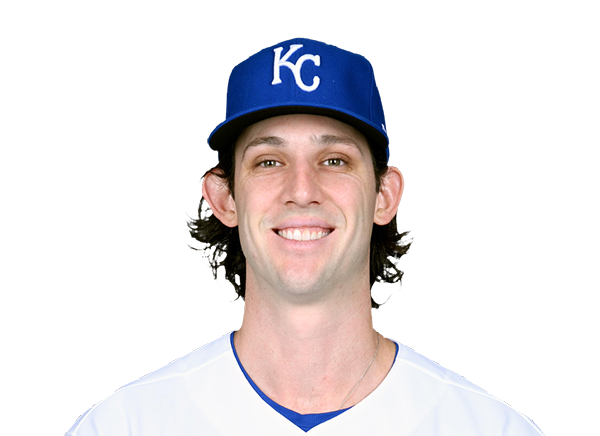 Daniel Lynch IV | 1.0 | 0 | 0 | 0 | 0 | 1 | 0 | 9-8 | 0.00 | 9 |
 Nick Mears | 1.0 | 1 | 0 | 0 | 0 | 1 | 0 | 8-6 | 0.00 | 8 |
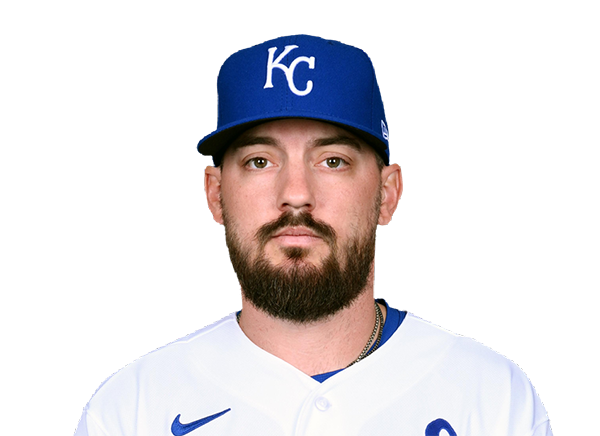 John Schreiber | 1.0 | 1 | 0 | 0 | 0 | 0 | 0 | 15-9 | 4.50 | 15 |
H2H / Season Series
KC3–4
MIN
KC2–1
MIN
KC8–2
MIN
MIN4–3
KC
MIN0–4
KC
MIN3–2
KC
MIN5–6
KC
MIN2–3
KC
MIN5–3
KC
MIN6–8
KC
Last 5 Games
| Date | Opponent | Result |
|---|---|---|
| Aug 23 |  @ SD | L1–8 |
| Aug 22 | @ SD | L5–7 |
| Aug 21 | @ SD | L2–6 |
| Aug 19 |  vs ATL | W6–4 |
| Aug 18 | vs ATL | W4–1 |
| Date | Opponent | Result |
|---|---|---|
| Aug 23 |  vs DET | W11–7 |
| Aug 22 | vs DET | W3–1 |
| Aug 21 | vs DET | W5–2 |
| Aug 20 |  vs ATH | W6–2 |
| Aug 19 | vs ATH | W9–7 |
Standings
American League
| Team | W | L | PCT | GB | DIFF | STRK |
|---|---|---|---|---|---|---|
1 Rays | 77 | 53 | .592 | - | +44 | W1 |
2 White Sox | 68 | 62 | .523 | 9 | +43 | W1 |
3 Astros | 65 | 66 | .496 | 12.5 | -44 | L2 |
4 Yankees | 74 | 56 | .569 | 3 | +100 | W1 |
5 Red Sox | 71 | 59 | .546 | 6 | +99 | W3 |
6 Rangers | 65 | 66 | .496 | 12.5 | -46 | W1 |
7 Guardians | 65 | 66 | .496 | 12.5 | -9 | W4 |
8 Blue Jays | 64 | 68 | .485 | 14 | -55 | L1 |
| 9Twins | 63 | 68 | .481 | 14.5 | -54 | L3 |
10 Orioles | 63 | 68 | .481 | 14.5 | -35 | L1 |
11 Mariners | 62 | 69 | .473 | 15.5 | -61 | L1 |
| 12Tigers | 61 | 69 | .469 | 16 | +73 | L5 |
| 13Royals | 58 | 74 | .439 | 20 | -91 | W8 |
14 Angels | 52 | 79 | .397 | 25.5 | -70 | L1 |
| 15Athletics | 51 | 80 | .389 | 26.5 | -187 | W2 |
National League
| Team | W | L | PCT | GB | DIFF | STRK |
|---|---|---|---|---|---|---|
1 Brewers | 81 | 49 | .623 | - | +163 | W3 |
2 Dodgers | 80 | 51 | .611 | 1.5 | +151 | W6 |
| 3Braves | 75 | 55 | .577 | 6 | +108 | L2 |
4 Cubs | 75 | 56 | .573 | 6.5 | +115 | W1 |
5 Phillies | 73 | 58 | .557 | 8.5 | +27 | W9 |
| 6Padres | 71 | 60 | .542 | 10.5 | +16 | W3 |
7 Diamondbacks | 69 | 62 | .527 | 12.5 | +9 | W1 |
8 Marlins | 67 | 64 | .511 | 14.5 | +21 | W3 |
9 Cardinals | 66 | 66 | .500 | 16 | -2 | L3 |
10 Pirates | 63 | 69 | .477 | 19 | +25 | L3 |
11 Reds | 62 | 69 | .473 | 19.5 | -94 | L1 |
12 Nationals | 61 | 71 | .462 | 21 | +10 | L4 |
13 Mets | 59 | 72 | .450 | 22.5 | -40 | L1 |
14 Giants | 52 | 78 | .400 | 29 | -80 | L4 |
15 Rockies | 50 | 80 | .385 | 31 | -136 | L6 |
MIN
VS
KC
Pitchers
Simeon Woods Richardson
Kody Funderburk
Justin Topa
Taylor Rogers
Catchers
Ryan Jeffers
Infielders
Luke Keaschall
Victor Caratini
Royce Lewis
Brooks Lee
Outfielders
Austin Martin
James Outman
Byron Buxton
Matt Wallner
Designated Hitters
Josh Bell
Other Players
Trevor Larnach
Pitchers
Kris Bubic
Daniel Lynch IV
Nick Mears
John Schreiber
Catchers
Salvador Perez
Infielders
Maikel Garcia
Bobby Witt Jr.
Vinnie Pasquantino
Jonathan India
Outfielders
Jac Caglianone
Isaac Collins
Kyle Isbel
Designated Hitters
Carter Jensen
Lane Thomas
Twins
VS
Royals
Batting
130
Team Games Played
131
4379
At Bats
4380
1074
Hits
1074
571
Runs Batted In
523
150
Home Runs
134
74
Stolen Bases
99
.245
Batting Average
.245
599
Runs
549
212
Doubles
233
19
Triples
18
1774
Total Bases
1745
422
Walks
406
1045
Strikeouts
1026
.319
On Base Percentage
.313
.405
Slugging Percentage
.398
.724
OBP Pct + SLG Pct
.712
130
Games Played
131
130
Games Started
131
71
Hit By Pitch
46
0.0
Wins Above Replacement
0.0
0.0
Offensive Wins Above Replacement
0.0
31
Caught Stealing
28
1
Is Qualified
1
576.1
Runs Created
558.4
4.5
Runs Created Per 27 Outs
4.3
.086
Walks Per Plate Appearance
.083
0.40
Walk To Strikeout Ratio
0.40
.160
Isolated Power
.153
.266
Secondary Average
.262
3.86
Pitches Per Plate Appearance
3.81
381
Extra Base Hits
385
4916
Plate Appearances
4897
29.2
At Bats Per Home Run
32.7
7
Sacrifice Hit
22
36
Sacrifice Flies
41
Pitching
130
Team Games Played
131
43
Quality Starts
53
63
Wins
57
67
Losses
74
37
Saves
33
89
Holds
63
1110
Hits
1130
592
Earned runs
603
149
Home Runs
162
473
Walks
485
1076
Strikeouts
957
8.4
Strikeouts Per 9 Innings
7.5
150.0
Pitches Per Start
147.2
1.38
Walks Plus Hits Per Inning Pitched
1.40
4.65
Earned Run Average
4.71
67
Losses
74
1146.2
Innings pitched
1151.1
.485
Win Percentage
.435
52
Save Opportunities
56
.252
Opponent Batting Average
.257
.330
Opponent's On-base pct.
.336
.412
Opponent's Slugging pct.
.431
.742
Opponent's OPB Pct + SLG Pct
.767
4401
At Bats
4389
226
Doubles
237
16
Triples
20
55
Batters Hit
49
109
Stolen Bases
64
130
Games Played
131
1
Complete Games
2
3
Shutouts
7
34
Wild Pitches
46
617
Runs Batted In
613
6
Balks
3
1146.2
Innings pitched
1151.1
8.4
Strikeouts Per 9 Innings
7.5
19
Caught Stealing
33
130
Games Started
131
0.0
Wins Above Replacement
0.0
1
Is Qualified
1
646
Runs
644
592
Earned Runs
603
1815
Total Bases
1893
Fielding
130
Team Games Played
131
1147
Full Innings
1151
4492
Total Chances
4700
3440
Putouts
3454
991
Assists
1190
61
Errors
56
212
Double Plays
233
0.986
Fielding Percentage
0.988
34.8
Range Factor
36.3
0.0
Zone Rating
0.0
130
Games Played
131
0
Games Started
0
0.0
Defensive Wins Above Replacement
0.0
1
Qualified
1