

Twins vs Tigers Live Score (10 Jun, 2026)
Game Information
Stage
Standard
Season
2026
First Pitch
Wed, Jun 10, 6:40 pm
Venue
Comerica Park
Location
Detroit, Michigan
Attendance
23,517
Live Situation
2Balls
3Strikes
0Outs
—Pitcher
—At Bat
Pitch Sequence
1
BALL
Changeup
92 MPH
2
BALL
Changeup
91 MPH
3
STRIKE FOUL
Four-seam FB
95 MPH
4
STRIKE SWINGING
Four-seam FB
94 MPH
5
STRIKE SWINGING
Four-seam FB
95 MPH
Injury Report



Team Stats
 MIN
DET


6
Runs
4
12
Hits
6
1
Errors
0
2
Home Runs
0
5
Walks
6
3
Strikeouts
14
Player Box Score
Minnesota Twins
| Player | H-AB | AB | R | H | RBI | HR | BB | K | #P | AVG | OBP | SLG |
|---|---|---|---|---|---|---|---|---|---|---|---|---|
 Austin Martin | 1-3 | 3 | 2 | 1 | 0 | 0 | 1 | 1 | 15 | .249 | .359 | .333 |
 Byron Buxton | 2-4 | 4 | 1 | 2 | 3 | 1 | 1 | 0 | 17 | .260 | .322 | .566 |
 Brooks Lee | 1-3 | 3 | 1 | 1 | 0 | 0 | 2 | 0 | 20 | .243 | .301 | .417 |
 Orlando Arcia | 1-5 | 5 | 0 | 1 | 0 | 0 | 0 | 1 | 15 | .289 | .319 | .378 |
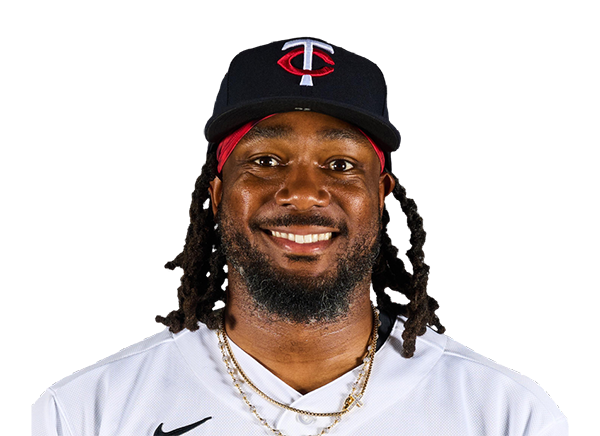 Josh Bell | 1-5 | 5 | 0 | 1 | 1 | 0 | 0 | 0 | 15 | .227 | .284 | .364 |
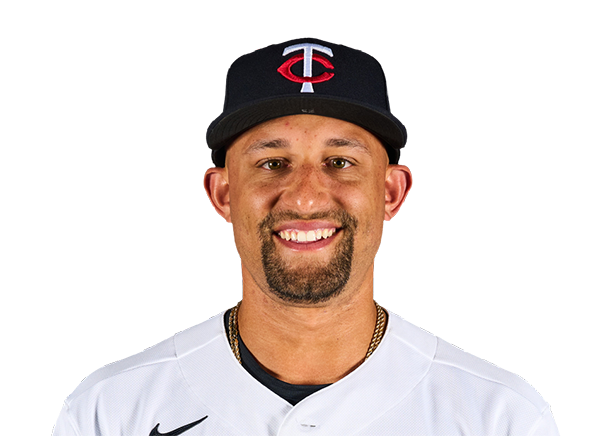 Royce Lewis | 1-4 | 4 | 1 | 1 | 1 | 1 | 1 | 0 | 19 | .176 | .272 | .311 |
 Luke Keaschall | 1-4 | 4 | 0 | 1 | 0 | 0 | 0 | 1 | 21 | .247 | .323 | .313 |
 Ryan Kreidler | 1-2 | 2 | 0 | 1 | 0 | 0 | 0 | 0 | 7 | .230 | .319 | .443 |
 Kody Clemens | 1-2 | 2 | 0 | 1 | 0 | 0 | 0 | 0 | 9 | .250 | .318 | .484 |
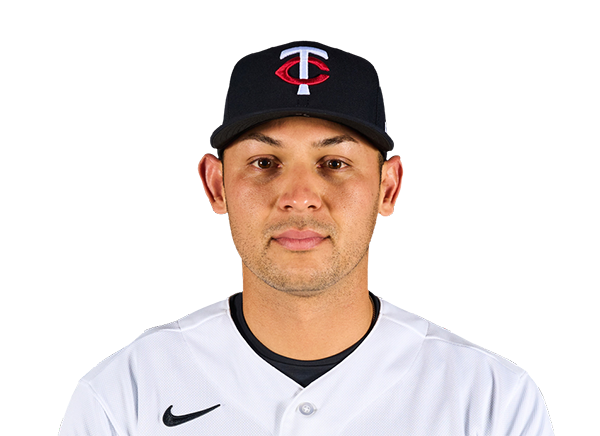 Alex Jackson | 2-3 | 3 | 1 | 2 | 0 | 0 | 0 | 0 | 10 | .308 | .333 | .346 |
Detroit Tigers
| Player | H-AB | AB | R | H | RBI | HR | BB | K | #P | AVG | OBP | SLG |
|---|---|---|---|---|---|---|---|---|---|---|---|---|
 Kevin McGonigle | 0-2 | 2 | 2 | 0 | 0 | 0 | 3 | 0 | 31 | .284 | .394 | .416 |
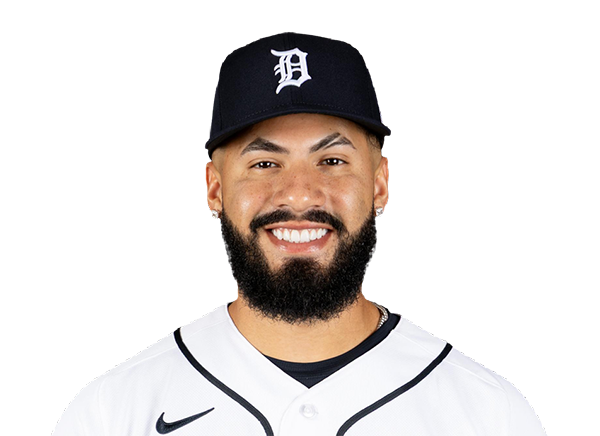 Gleyber Torres | 3-4 | 4 | 0 | 3 | 1 | 0 | 1 | 1 | 27 | .283 | .398 | .379 |
 Kerry Carpenter | 1-2 | 2 | 0 | 1 | 2 | 0 | 0 | 1 | 8 | .234 | .308 | .500 |
 Matt Vierling | 0-2 | 2 | 0 | 0 | 0 | 0 | 0 | 0 | 6 | .206 | .268 | .347 |
 Dillon Dingler | 1-5 | 5 | 0 | 1 | 1 | 0 | 0 | 3 | 22 | .247 | .327 | .520 |
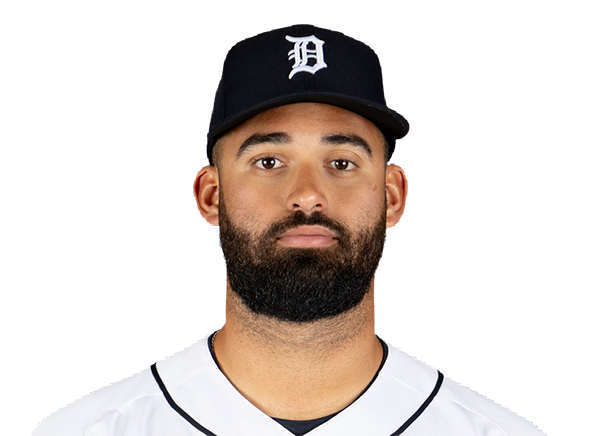 Riley Greene | 0-4 | 4 | 0 | 0 | 0 | 0 | 1 | 3 | 30 | .301 | .393 | .451 |
 Spencer Torkelson | 0-3 | 3 | 0 | 0 | 0 | 0 | 1 | 2 | 20 | .211 | .313 | .395 |
 Colt Keith | 0-3 | 3 | 0 | 0 | 0 | 0 | 0 | 0 | 8 | .257 | .301 | .322 |
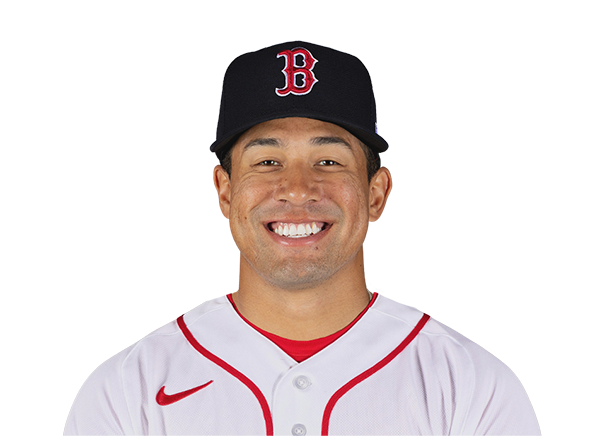 Jahmai Jones | 0-1 | 1 | 0 | 0 | 0 | 0 | 0 | 0 | 6 | .139 | .227 | .241 |
 Zach McKinstry | 0-4 | 4 | 1 | 0 | 0 | 0 | 0 | 1 | 21 | .173 | .267 | .236 |
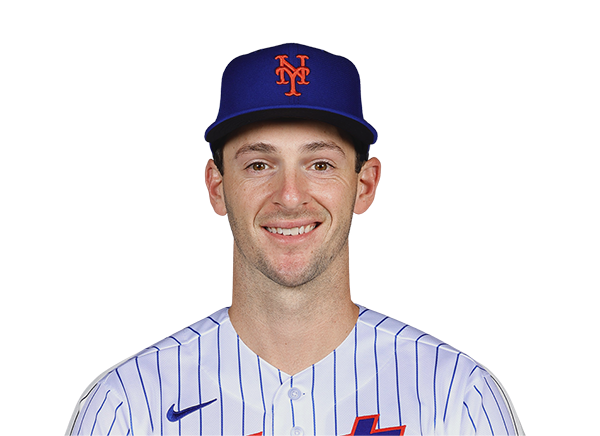 Zack Short | 0-2 | 2 | 0 | 0 | 0 | 0 | 0 | 2 | 10 | .171 | .311 | .229 |
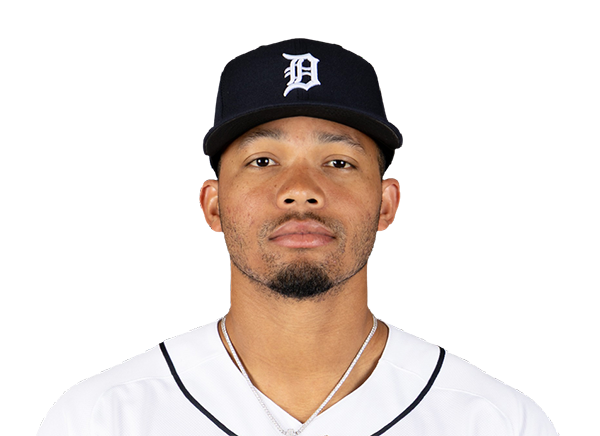 Wenceel Perez | 1-2 | 2 | 1 | 1 | 0 | 0 | 0 | 1 | 10 | .181 | .244 | .335 |
Minnesota Twins
| Player | IP | H | R | ER | BB | K | HR | PC-ST | ERA | PC |
|---|---|---|---|---|---|---|---|---|---|---|
 Mike Paredes | 3.0 | 1 | 1 | 1 | 2 | 4 | 0 | 58-33 | 4.35 | 58 |
 Taylor Rogers | 1.0 | 0 | 0 | 0 | 0 | 2 | 0 | 14-8 | 4.78 | 14 |
|
Andrew Morris | 1.0 | 2 | 2 | 1 | 1 | 3 | 0 | 39-25 | 5.28 | 39 |
 Travis Adams | 1.1 | 1 | 0 | 0 | 1 | 3 | 0 | 31-17 | 7.43 | 31 |
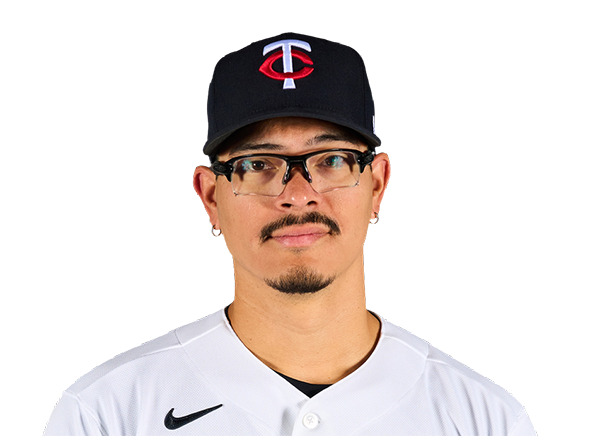 Anthony Banda | 1.2 | 0 | 0 | 0 | 1 | 1 | 0 | 30-19 | 4.66 | 30 |
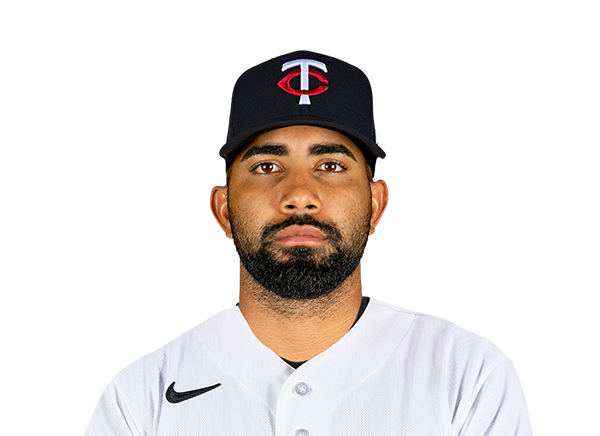 Yoendrys Gomez | 1.0 | 2 | 1 | 1 | 1 | 1 | 0 | 27-15 | 3.90 | 27 |
Detroit Tigers
| Player | IP | H | R | ER | BB | K | HR | PC-ST | ERA | PC |
|---|---|---|---|---|---|---|---|---|---|---|
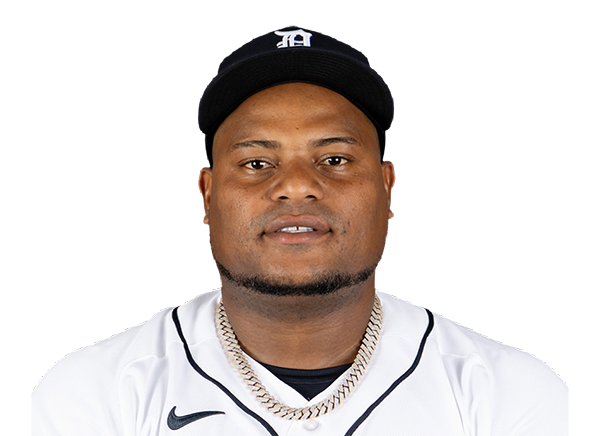 Framber Valdez | 5.0 | 6 | 4 | 4 | 2 | 2 | 2 | 75-45 | 4.40 | 75 |
 Brenan Hanifee | 1.0 | 1 | 0 | 0 | 0 | 0 | 0 | 16-10 | 3.29 | 16 |
 Ty Madden | 0.2 | 1 | 2 | 2 | 1 | 1 | 0 | 21-13 | 3.50 | 21 |
 Drew Sommers | 0.2 | 1 | 0 | 0 | 1 | 0 | 0 | 17-8 | 0.00 | 17 |
 Beau Brieske | 1.2 | 3 | 0 | 0 | 1 | 0 | 0 | 19-11 | 16.20 | 19 |
H2H / Season Series
DET11–0
MIN
DET4–6
MIN
DET10–4
MIN
MIN3–1
DET
MIN8–6
DET
MIN4–2
DET
MIN7–3
DET
MIN2–1
DET
DET0–3
MIN
Last 5 Games
| Date | Opponent | Result |
|---|---|---|
| Aug 21 |  @ SD | L2–6 |
| Aug 19 |  vs ATL | W6–4 |
| Aug 18 | vs ATL | W4–1 |
| Aug 17 | vs ATL | W4–2 |
| Aug 16 |  vs PHI | L5–7 |
| Date | Opponent | Result |
|---|---|---|
| Aug 22 |  @ KC | L1–3 |
| Aug 21 | @ KC | L2–5 |
| Aug 19 |  @ PIT | L3–4 |
| Aug 18 | @ PIT | L1–4 |
| Aug 17 | @ PIT | W8–5 |
Standings
American League
| Team | W | L | PCT | GB | DIFF | STRK |
|---|---|---|---|---|---|---|
1 Rays | 76 | 52 | .594 | - | +43 | L2 |
2 White Sox | 67 | 61 | .523 | 9 | +47 | W1 |
3 Astros | 65 | 64 | .504 | 11.5 | -42 | W1 |
4 Yankees | 73 | 56 | .566 | 3.5 | +95 | L1 |
5 Red Sox | 69 | 59 | .539 | 7 | +97 | W1 |
6 Rangers | 64 | 65 | .496 | 12.5 | -45 | W2 |
7 Blue Jays | 64 | 67 | .489 | 13.5 | -50 | W1 |
| 8Twins | 63 | 66 | .488 | 13.5 | -45 | L1 |
9 Guardians | 63 | 66 | .488 | 13.5 | -15 | W2 |
10 Orioles | 62 | 67 | .481 | 14.5 | -34 | W1 |
| 11Tigers | 61 | 67 | .477 | 15 | +79 | L3 |
12 Mariners | 61 | 68 | .473 | 15.5 | -45 | W1 |
| 13Royals | 56 | 74 | .431 | 21 | -97 | W6 |
14 Angels | 51 | 78 | .395 | 25.5 | -71 | L1 |
15 Athletics | 49 | 80 | .380 | 27.5 | -189 | L5 |
National League
| Team | W | L | PCT | GB | DIFF | STRK |
|---|---|---|---|---|---|---|
1 Brewers | 81 | 49 | .623 | - | +163 | W3 |
2 Dodgers | 78 | 51 | .605 | 2.5 | +146 | W4 |
| 3Braves | 75 | 55 | .577 | 6 | +108 | L2 |
4 Cubs | 74 | 55 | .574 | 6.5 | +99 | L2 |
| 5Phillies | 72 | 58 | .554 | 9 | +25 | W8 |
| 6Padres | 69 | 60 | .535 | 11.5 | +7 | W1 |
7 Diamondbacks | 68 | 61 | .527 | 12.5 | +13 | W2 |
8 Marlins | 66 | 64 | .508 | 15 | +17 | W2 |
9 Cardinals | 66 | 65 | .504 | 15.5 | 0 | L2 |
| 10Pirates | 63 | 67 | .485 | 18 | +30 | L1 |
11 Reds | 61 | 68 | .473 | 19.5 | -98 | L2 |
12 Nationals | 61 | 70 | .466 | 20.5 | +14 | L3 |
13 Mets | 58 | 71 | .450 | 22.5 | -44 | L1 |
14 Giants | 52 | 76 | .406 | 28 | -78 | L2 |
15 Rockies | 50 | 78 | .391 | 30 | -130 | L4 |
MIN
VS
DET
Pitchers
Mike Paredes
Taylor Rogers
Andrew Morris
Travis Adams
Anthony Banda
Yoendrys Gomez
Catchers
Alex Jackson
Infielders
Brooks Lee
Orlando Arcia
Royce Lewis
Luke Keaschall
Outfielders
Austin Martin
Byron Buxton
Ryan Kreidler
Kody Clemens
Designated Hitters
Josh Bell
Pitchers
Framber Valdez
Brenan Hanifee
Ty Madden
Drew Sommers
Beau Brieske
Catchers
Dillon Dingler
Infielders
Kevin McGonigle
Gleyber Torres
Spencer Torkelson
Zach McKinstry
Zack Short
Outfielders
Kerry Carpenter
Matt Vierling
Riley Greene
Wenceel Perez
Designated Hitters
Colt Keith
Jahmai Jones
Twins
VS
Tigers
Batting
129
Team Games Played
128
4342
At Bats
4322
1064
Hits
1047
566
Runs Batted In
552
147
Home Runs
152
74
Stolen Bases
36
.245
Batting Average
.242
594
Runs
579
210
Doubles
196
19
Triples
26
1753
Total Bases
1751
420
Walks
458
1042
Strikeouts
1094
.319
On Base Percentage
.319
.404
Slugging Percentage
.405
.723
OBP Pct + SLG Pct
.724
129
Games Played
128
129
Games Started
128
70
Hit By Pitch
48
0.0
Wins Above Replacement
0.0
0.0
Offensive Wins Above Replacement
0.0
31
Caught Stealing
18
1
Is Qualified
1
569.2
Runs Created
568.9
4.5
Runs Created Per 27 Outs
4.5
.086
Walks Per Plate Appearance
.094
0.40
Walk To Strikeout Ratio
0.42
.159
Isolated Power
.163
.265
Secondary Average
.273
3.86
Pitches Per Plate Appearance
3.92
376
Extra Base Hits
374
4876
Plate Appearances
4876
29.5
At Bats Per Home Run
28.4
7
Sacrifice Hit
6
36
Sacrifice Flies
37
Pitching
129
Team Games Played
128
43
Quality Starts
48
63
Wins
61
66
Losses
67
37
Saves
26
88
Holds
60
1100
Hits
982
586
Earned runs
448
148
Home Runs
130
470
Walks
395
1067
Strikeouts
1047
8.4
Strikeouts Per 9 Innings
8.3
149.9
Pitches Per Start
141.7
1.38
Walks Plus Hits Per Inning Pitched
1.21
4.63
Earned Run Average
3.56
66
Losses
67
1138.2
Innings pitched
1133.1
.488
Win Percentage
.477
51
Save Opportunities
54
.252
Opponent Batting Average
.231
.329
Opponent's On-base pct.
.303
.412
Opponent's Slugging pct.
.377
.742
Opponent's OPB Pct + SLG Pct
.680
4366
At Bats
4248
224
Doubles
192
16
Triples
18
55
Batters Hit
55
109
Stolen Bases
70
129
Games Played
128
1
Complete Games
0
3
Shutouts
14
34
Wild Pitches
28
611
Runs Batted In
477
6
Balks
3
1138.2
Innings pitched
1133.1
8.4
Strikeouts Per 9 Innings
8.3
19
Caught Stealing
25
129
Games Started
128
0.0
Wins Above Replacement
0.0
1
Is Qualified
1
639
Runs
500
586
Earned Runs
448
1800
Total Bases
1600
Fielding
129
Team Games Played
128
1139
Full Innings
1133
4457
Total Chances
4590
3416
Putouts
3400
982
Assists
1131
59
Errors
59
210
Double Plays
196
0.987
Fielding Percentage
0.987
34.8
Range Factor
36.0
0.0
Zone Rating
0.0
129
Games Played
128
0
Games Started
0
0.0
Defensive Wins Above Replacement
0.0
1
Qualified
1