

Twins vs Tigers Live Score (9 Sep, 2026)
Game Information
Stage
STD
Season
2026
First Pitch
Wed, Sep 9, 1:10 pm
Venue
Comerica Park
Location
Detroit, Michigan
Venue Type
Outdoor
Broadcast
MLB.TV
Attendance
18,788
Live Situation
3Balls
2Strikes
0Outs
—Pitcher
—At Bat
Pitch Sequence
1
STRIKE LOOKING
Four-seam FB
95 MPH
2
STRIKE SWINGING
Slider
83 MPH
3
STRIKE FOUL
Slider
83 MPH
4
BALL
Four-seam FB
95 MPH
5
BALL
Slider
84 MPH
6
STRIKE FOUL
Splitter
87 MPH
7
BALL
Four-seam FB
96 MPH
8
BALL IN PLAY
Four-seam FB
95 MPH
Injury Report
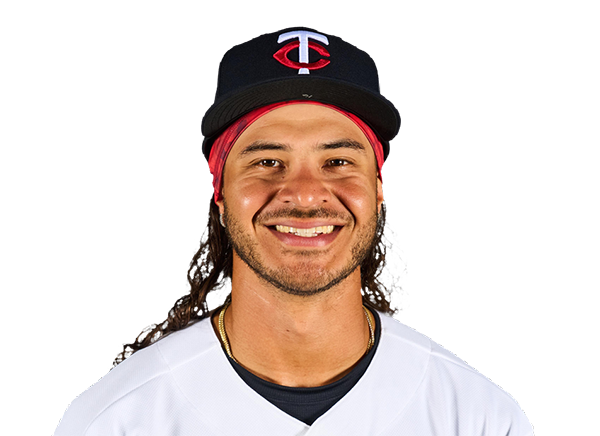


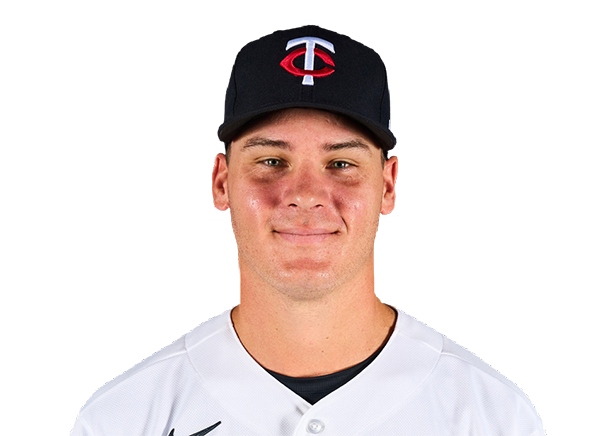

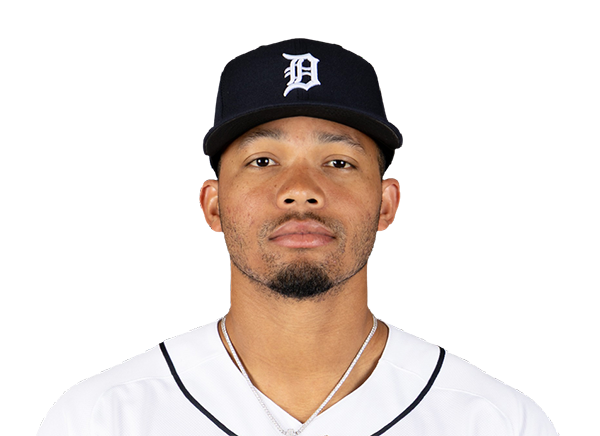


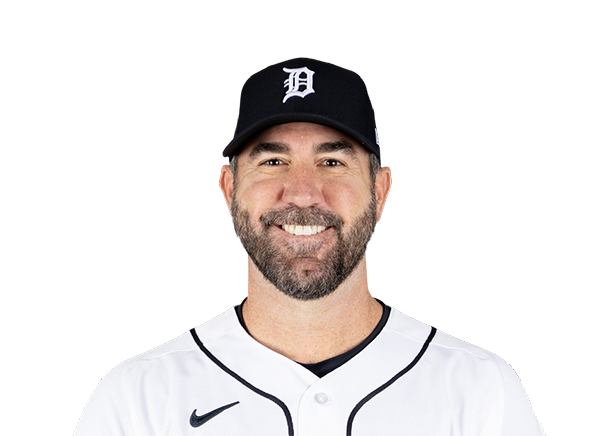
Team Stats
 MIN
DET


2
Runs
7
5
Hits
7
0
Errors
0
2
Home Runs
1
2
Walks
8
8
Strikeouts
10
Player Box Score
Minnesota Twins
| Player | H-AB | AB | R | H | RBI | HR | BB | K | #P | AVG | OBP | SLG |
|---|---|---|---|---|---|---|---|---|---|---|---|---|
 Luke Keaschall | 0-3 | 3 | 0 | 0 | 0 | 0 | 0 | 0 | 14 | .274 | .368 | .389 |
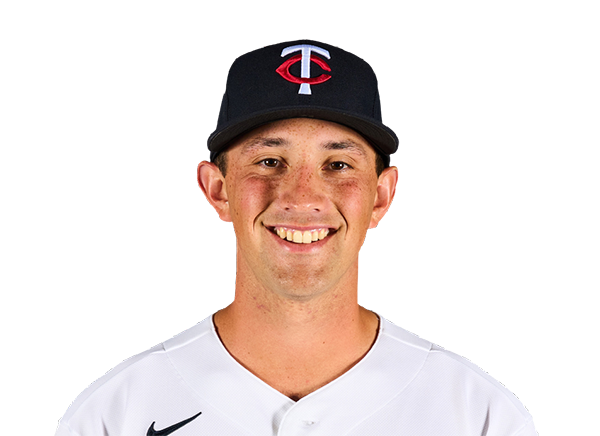 Brooks Lee | 0-4 | 4 | 0 | 0 | 0 | 0 | 0 | 1 | 26 | .248 | .297 | .435 |
 Kody Clemens | 1-4 | 4 | 1 | 1 | 1 | 1 | 0 | 1 | 12 | .238 | .300 | .473 |
 Josh Bell | 2-4 | 4 | 1 | 2 | 1 | 1 | 0 | 0 | 17 | .256 | .319 | .425 |
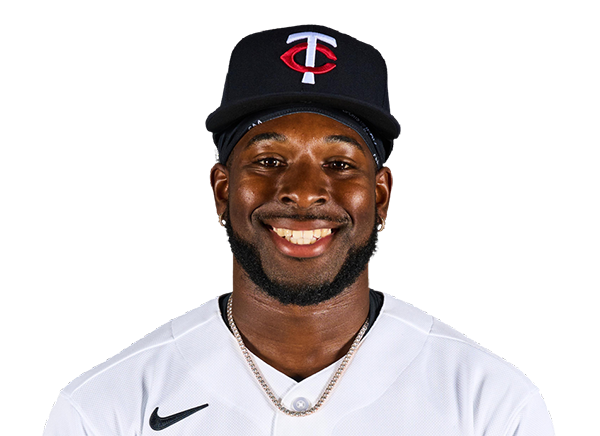 Kaelen Culpepper | 0-4 | 4 | 0 | 0 | 0 | 0 | 0 | 0 | 18 | .284 | .333 | .422 |
 Trevor Larnach | 1-3 | 3 | 0 | 1 | 0 | 0 | 1 | 1 | 24 | .264 | .347 | .422 |
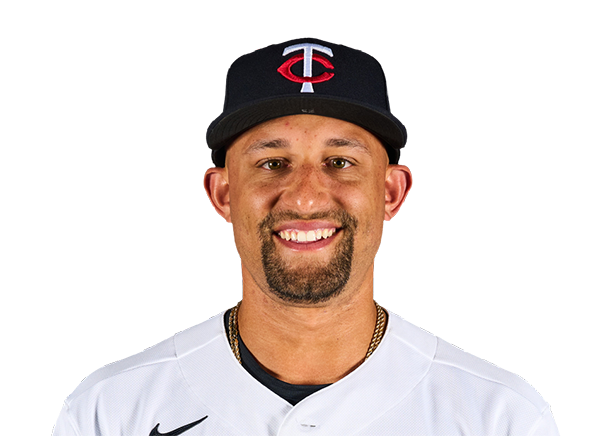 Royce Lewis | 0-3 | 3 | 0 | 0 | 0 | 0 | 0 | 2 | 17 | .230 | .296 | .392 |
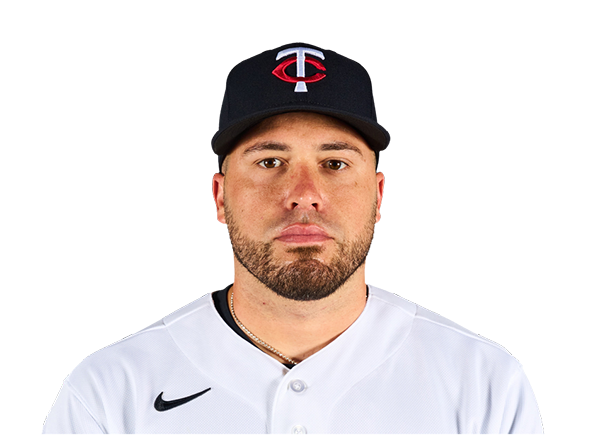 Victor Caratini | 1-3 | 3 | 0 | 1 | 0 | 0 | 0 | 1 | 15 | .223 | .316 | .324 |
 Walker Jenkins | 0-2 | 2 | 0 | 0 | 0 | 0 | 1 | 2 | 13 | .118 | .268 | .265 |
Detroit Tigers
| Player | H-AB | AB | R | H | RBI | HR | BB | K | #P | AVG | OBP | SLG |
|---|---|---|---|---|---|---|---|---|---|---|---|---|
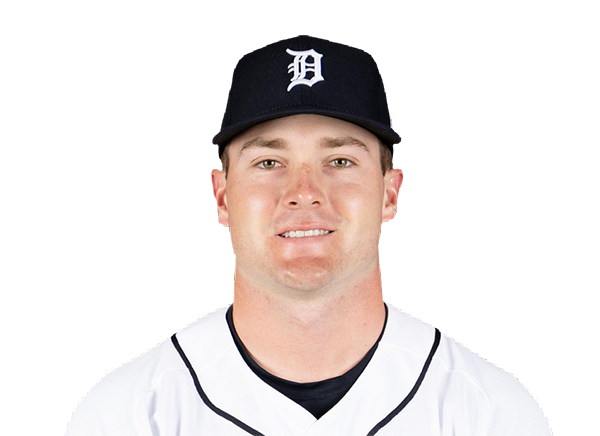 Kevin McGonigle | 1-4 | 4 | 1 | 1 | 0 | 0 | 1 | 2 | 27 | .273 | .373 | .420 |
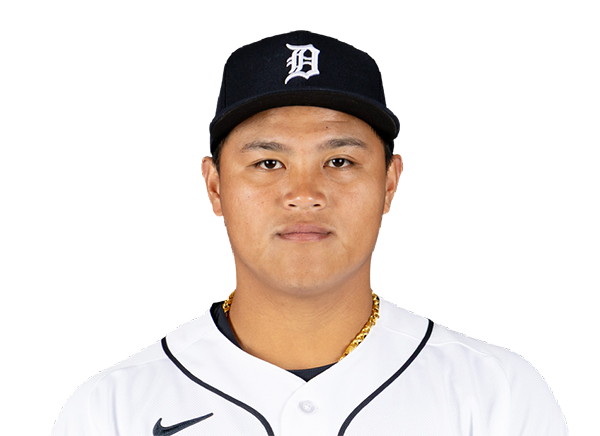 Hao-Yu Lee | 0-2 | 2 | 2 | 0 | 0 | 0 | 3 | 1 | 21 | .256 | .314 | .400 |
 Colt Keith | 1-3 | 3 | 1 | 1 | 2 | 1 | 0 | 1 | 12 | .257 | .319 | .404 |
 Spencer Torkelson | 1-1 | 1 | 1 | 1 | 0 | 0 | 0 | 0 | 7 | .220 | .311 | .407 |
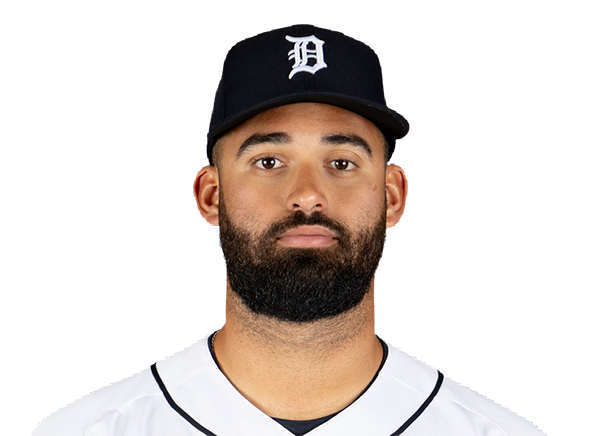 Riley Greene | 0-2 | 2 | 0 | 0 | 1 | 0 | 2 | 0 | 17 | .275 | .366 | .469 |
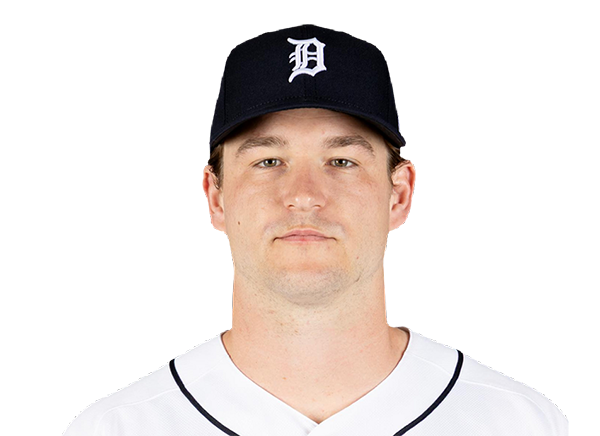 Dillon Dingler | 1-3 | 3 | 0 | 1 | 2 | 0 | 0 | 1 | 13 | .246 | .307 | .456 |
 Brett Callahan | 1-4 | 4 | 0 | 1 | 1 | 0 | 0 | 2 | 20 | .222 | .265 | .378 |
 Max Clark | 1-3 | 3 | 1 | 1 | 0 | 0 | 1 | 1 | 17 | .254 | .324 | .405 |
 Ben Malgeri | 0-4 | 4 | 0 | 0 | 0 | 0 | 0 | 1 | 11 | .235 | .339 | .357 |
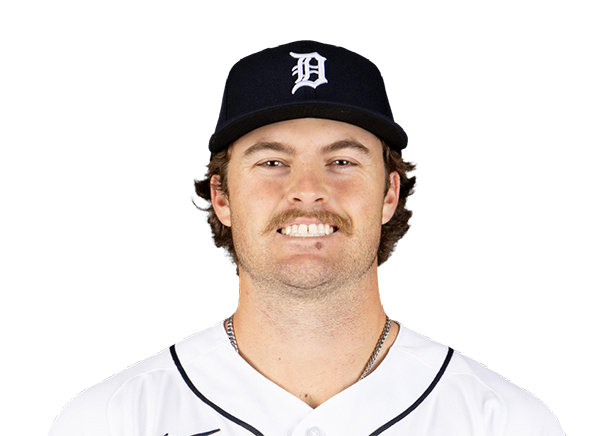 John Peck | 1-3 | 3 | 1 | 1 | 1 | 0 | 1 | 1 | 17 | .240 | .345 | .280 |
Minnesota Twins
| Player | IP | H | R | ER | BB | K | HR | PC-ST | ERA | PC |
|---|---|---|---|---|---|---|---|---|---|---|
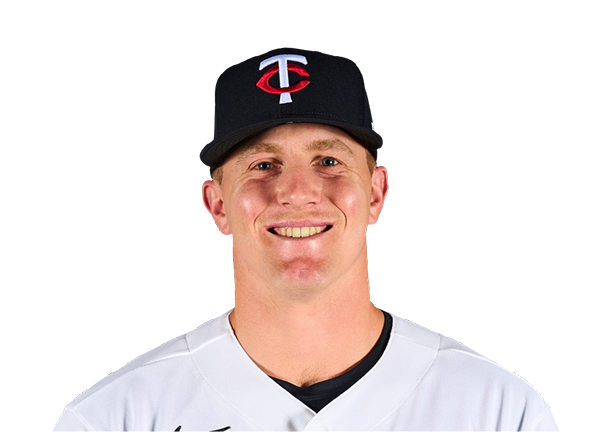 Zebby Matthews | 2.1 | 2 | 5 | 5 | 4 | 2 | 1 | 58-27 | 4.98 | 58 |
 Travis Adams | 2.2 | 1 | 0 | 0 | 2 | 3 | 0 | 42-26 | 5.21 | 42 |
 Taylor Rogers | 1.0 | 1 | 0 | 0 | 0 | 1 | 0 | 16-10 | 4.61 | 16 |
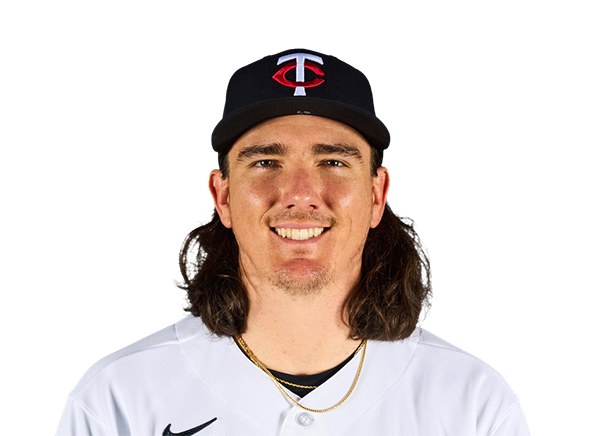 Kody Funderburk | 0.2 | 1 | 1 | 1 | 1 | 2 | 0 | 22-11 | 4.02 | 22 |
 Tommy Nance | 1.1 | 2 | 1 | 1 | 1 | 2 | 0 | 24-14 | 4.00 | 24 |
Detroit Tigers
| Player | IP | H | R | ER | BB | K | HR | PC-ST | ERA | PC |
|---|---|---|---|---|---|---|---|---|---|---|
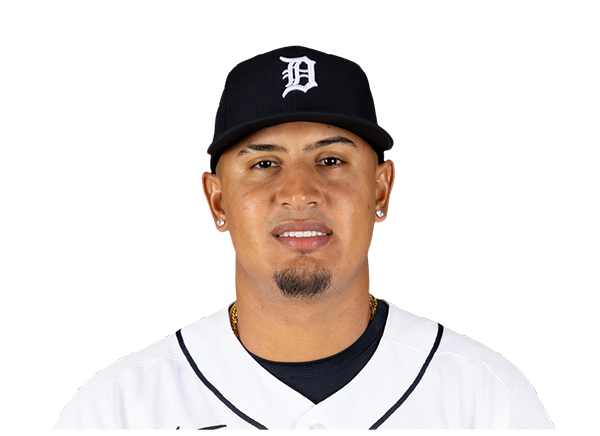 Keider Montero | 4.0 | 2 | 2 | 2 | 2 | 2 | 2 | 74-39 | 3.55 | 74 |
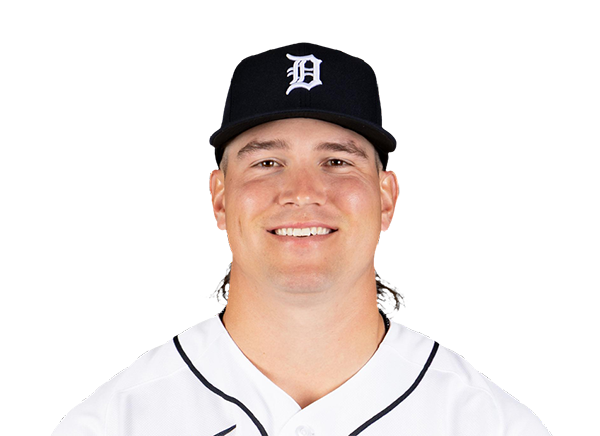 Tyler Holton | 2.0 | 0 | 0 | 0 | 0 | 2 | 0 | 31-20 | 2.74 | 31 |
 Tyler Kinley | 0.2 | 2 | 0 | 0 | 0 | 1 | 0 | 17-11 | 3.44 | 17 |
 Drew Sommers | 1.1 | 0 | 0 | 0 | 0 | 3 | 0 | 15-11 | 3.71 | 15 |
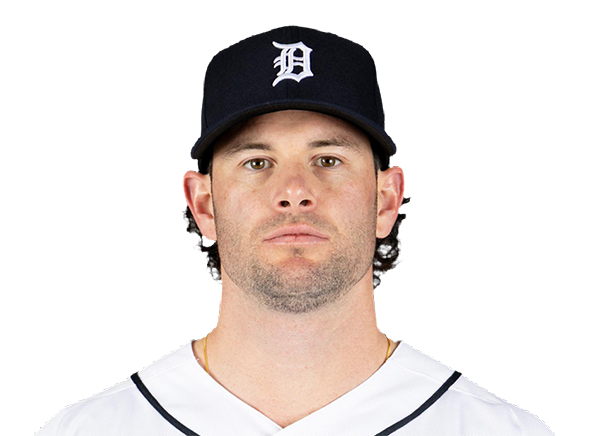 Kyle Finnegan | 1.0 | 1 | 0 | 0 | 0 | 0 | 0 | 19-13 | 3.79 | 19 |
H2H / Season Series
DET7–2
MIN
DET2–3
MIN
DET5–4
MIN
MIN6–11
DET
MIN15–2
DET
MIN11–1
DET
DET11–0
MIN
DET4–6
MIN
DET10–4
MIN
MIN3–1
DET
Last 5 Games
| Date | Opponent | Result |
|---|---|---|
| Sep 9 | @ DET | L2–7 |
| Sep 8 | @ DET | W3–2 |
| Sep 7 | @ DET | L4–5 |
| Sep 6 |  @ CHW | L1–10 |
| Sep 5 | @ CHW | W6–4 |
| Date | Opponent | Result |
|---|---|---|
| Sep 9 | vs MIN | W7–2 |
| Sep 8 | vs MIN | L2–3 |
| Sep 7 | vs MIN | W5–4 |
| Sep 6 |  @ CLE | L2–3 |
| Sep 5 | @ CLE | W6–0 |
Standings
American League
| Team | W | L | PCT | GB | DIFF | STRK |
|---|---|---|---|---|---|---|
1 Rays | 86 | 58 | .597 | - | +53 | W1 |
| 2White Sox | 75 | 69 | .521 | 11 | +43 | L1 |
3 Astros | 74 | 71 | .510 | 12.5 | -37 | W1 |
4 Yankees | 82 | 62 | .569 | 4 | +119 | W1 |
5 Red Sox | 80 | 66 | .548 | 7 | +84 | L1 |
| 6Guardians | 74 | 72 | .507 | 13 | -12 | W1 |
7 Blue Jays | 73 | 74 | .497 | 14.5 | -39 | L1 |
8 Rangers | 72 | 74 | .493 | 15 | -40 | L1 |
9 Orioles | 70 | 76 | .479 | 17 | -31 | L1 |
| 10Twins | 69 | 77 | .473 | 18 | -53 | L1 |
11 Mariners | 68 | 78 | .466 | 19 | -75 | W1 |
| 12Tigers | 67 | 79 | .459 | 20 | +55 | W1 |
13 Royals | 64 | 82 | .438 | 23 | -91 | L2 |
14 Athletics | 59 | 88 | .401 | 28.5 | -187 | W1 |
15 Angels | 55 | 90 | .379 | 31.5 | -75 | W1 |
National League
| Team | W | L | PCT | GB | DIFF | STRK |
|---|---|---|---|---|---|---|
1 Brewers | 90 | 56 | .616 | - | +170 | W2 |
2 Dodgers | 88 | 57 | .607 | 1.5 | +156 | W6 |
3 Braves | 85 | 60 | .586 | 4.5 | +113 | L2 |
4 Phillies | 81 | 64 | .559 | 8.5 | +34 | L1 |
5 Cubs | 81 | 65 | .555 | 9 | +130 | L3 |
6 Diamondbacks | 78 | 68 | .534 | 12 | +2 | W4 |
7 Padres | 78 | 68 | .534 | 12 | +17 | W4 |
8 Pirates | 72 | 73 | .497 | 17.5 | +32 | W2 |
9 Marlins | 72 | 74 | .493 | 18 | +8 | L2 |
10 Cardinals | 72 | 75 | .490 | 18.5 | -12 | L3 |
11 Reds | 69 | 76 | .476 | 20.5 | -109 | L2 |
12 Mets | 67 | 78 | .462 | 22.5 | -41 | W3 |
13 Nationals | 67 | 81 | .453 | 24 | 0 | L7 |
14 Giants | 62 | 85 | .422 | 28.5 | -72 | W3 |
15 Rockies | 55 | 89 | .382 | 34 | -142 | L2 |
MIN
VS
DET
Pitchers
Zebby Matthews
Catchers
Victor Caratini
Infielders
Brooks Lee
Kody Clemens
Kaelen Culpepper
Royce Lewis
Outfielders
Luke Keaschall
Trevor Larnach
Walker Jenkins
Designated Hitters
Josh Bell
Pitchers
Keider Montero
Catchers
Dillon Dingler
Infielders
Kevin McGonigle
Hao-Yu Lee
Colt Keith
John Peck
Outfielders
Brett Callahan
Max Clark
Ben Malgeri
Designated Hitters
Riley Greene
Twins
VS
Tigers
Batting
146
Team Games Played
146
4917
At Bats
4921
1203
Hits
1170
645
Runs Batted In
611
172
Home Runs
164
83
Stolen Bases
48
.245
Batting Average
.238
675
Runs
641
239
Doubles
225
20
Triples
29
1998
Total Bases
1945
471
Walks
506
1157
Strikeouts
1275
.319
On Base Percentage
.314
.406
Slugging Percentage
.395
.725
OBP Pct + SLG Pct
.709
146
Games Played
146
146
Games Started
146
83
Hit By Pitch
59
0.0
Wins Above Replacement
0.0
0.0
Offensive Wins Above Replacement
0.0
33
Caught Stealing
21
1
Is Qualified
1
646.2
Runs Created
622.3
4.5
Runs Created Per 27 Outs
4.3
.085
Walks Per Plate Appearance
.091
0.41
Walk To Strikeout Ratio
0.40
.162
Isolated Power
.157
.268
Secondary Average
.266
3.86
Pitches Per Plate Appearance
3.92
431
Extra Base Hits
418
5522
Plate Appearances
5539
28.6
At Bats Per Home Run
30.0
8
Sacrifice Hit
8
42
Sacrifice Flies
40
Pitching
146
Team Games Played
146
46
Quality Starts
52
69
Wins
67
77
Losses
79
40
Saves
28
95
Holds
70
1240
Hits
1122
667
Earned runs
527
169
Home Runs
151
531
Walks
458
1224
Strikeouts
1171
8.6
Strikeouts Per 9 Innings
8.1
149.5
Pitches Per Start
142.4
1.38
Walks Plus Hits Per Inning Pitched
1.22
4.67
Earned Run Average
3.67
77
Losses
79
1286.2
Innings pitched
1294.0
.473
Win Percentage
.459
56
Save Opportunities
59
.251
Opponent Batting Average
.232
.329
Opponent's On-base pct.
.306
.414
Opponent's Slugging pct.
.380
.742
Opponent's OPB Pct + SLG Pct
.686
4943
At Bats
4834
259
Doubles
225
19
Triples
19
63
Batters Hit
71
119
Stolen Bases
83
146
Games Played
146
1
Complete Games
0
3
Shutouts
15
41
Wild Pitches
34
695
Runs Batted In
559
6
Balks
3
1286.2
Innings pitched
1294.0
8.6
Strikeouts Per 9 Innings
8.1
21
Caught Stealing
30
146
Games Started
146
0.0
Wins Above Replacement
0.0
1
Is Qualified
1
728
Runs
586
667
Earned Runs
527
2044
Total Bases
1838
Fielding
146
Team Games Played
146
1287
Full Innings
1294
5043
Total Chances
5255
3860
Putouts
3882
1116
Assists
1307
67
Errors
66
239
Double Plays
225
0.987
Fielding Percentage
0.987
34.8
Range Factor
36.1
0.0
Zone Rating
0.0
146
Games Played
146
0
Games Started
0
0.0
Defensive Wins Above Replacement
0.0
1
Qualified
1