

White Sox vs Astros Live Score (3 Sep, 2026)
Game Information
Stage
STD
Season
2026
First Pitch
Thu, Sep 3, 2:10 pm
Venue
Daikin Park
Location
Houston, Texas
Venue Type
Indoor
Broadcast
ESPN Unlmtd
Attendance
24,155
Live Situation
0Balls
3Strikes
0Outs
—Pitcher
—At Bat
Pitch Sequence
1
STRIKE FOUL
Four-seam FB
95 MPH
2
STRIKE LOOKING
Four-seam FB
95 MPH
3
STRIKE FOUL
Four-seam FB
97 MPH
4
STRIKE FOUL
Four-seam FB
97 MPH
5
STRIKE SWINGING
Changeup
86 MPH
Injury Report
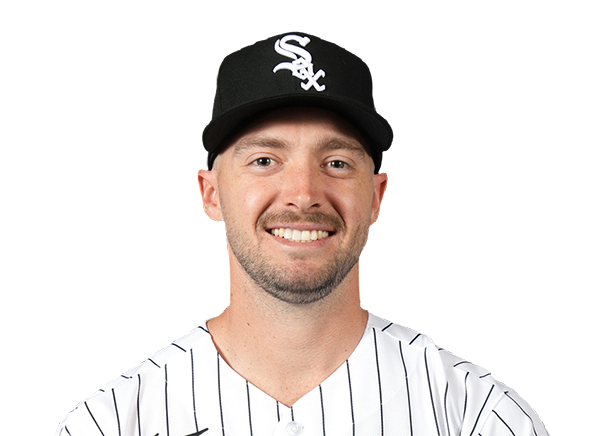
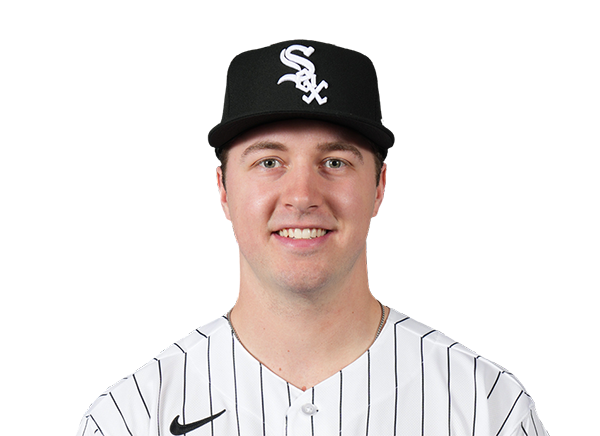
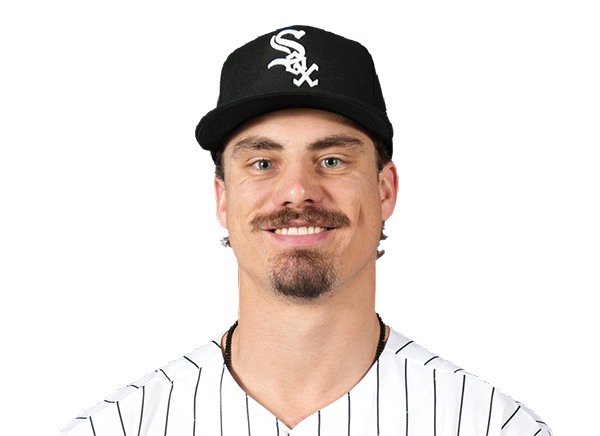


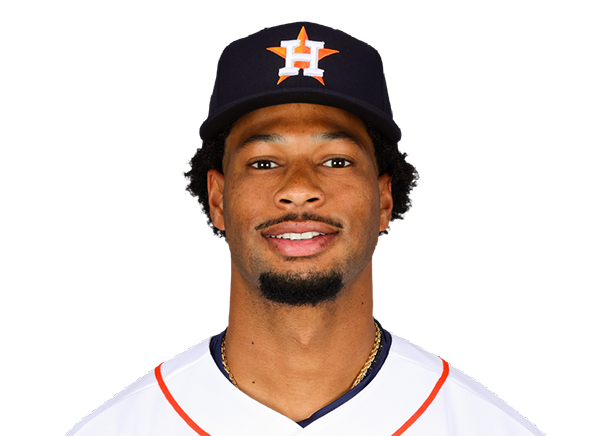

Team Stats
 CHW
HOU


2
Runs
6
7
Hits
8
0
Errors
0
0
Home Runs
1
2
Walks
3
10
Strikeouts
5
Player Box Score
Chicago White Sox
| Player | H-AB | AB | R | H | RBI | HR | BB | K | #P | AVG | OBP | SLG |
|---|---|---|---|---|---|---|---|---|---|---|---|---|
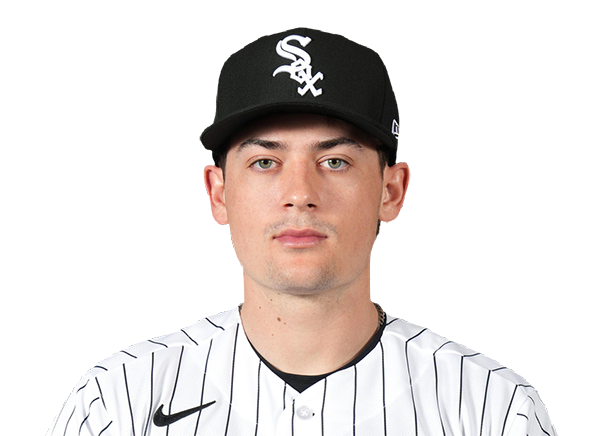 Sam Antonacci | 1-4 | 4 | 0 | 1 | 1 | 0 | 0 | 1 | 14 | .265 | .364 | .386 |
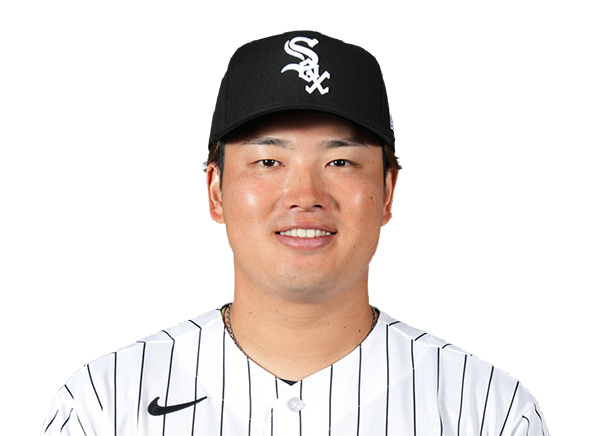 Munetaka Murakami | 0-4 | 4 | 0 | 0 | 0 | 0 | 0 | 3 | 16 | .213 | .354 | .481 |
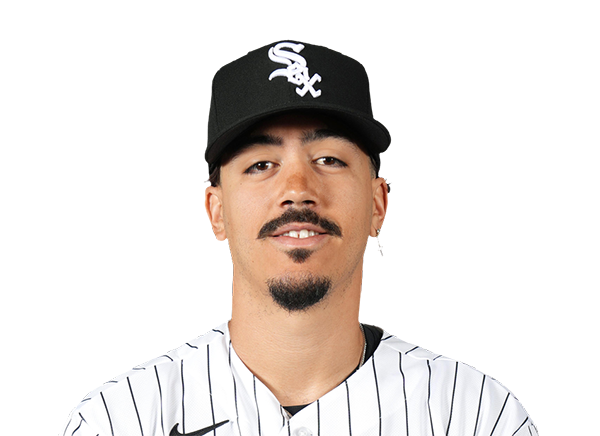 Miguel Vargas | 2-4 | 4 | 0 | 2 | 0 | 0 | 0 | 0 | 13 | .251 | .363 | .484 |
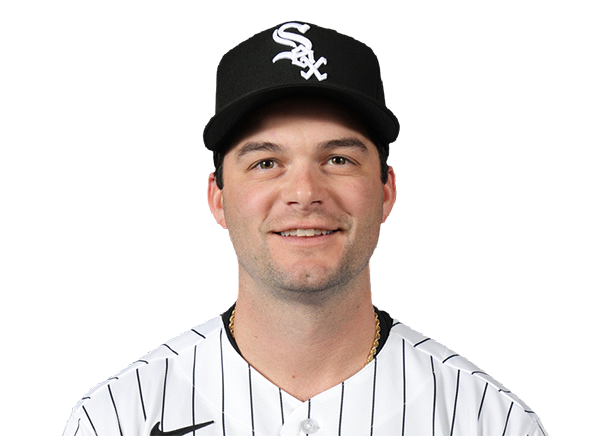 Andrew Benintendi | 0-3 | 3 | 0 | 0 | 0 | 0 | 1 | 1 | 20 | .243 | .303 | .420 |
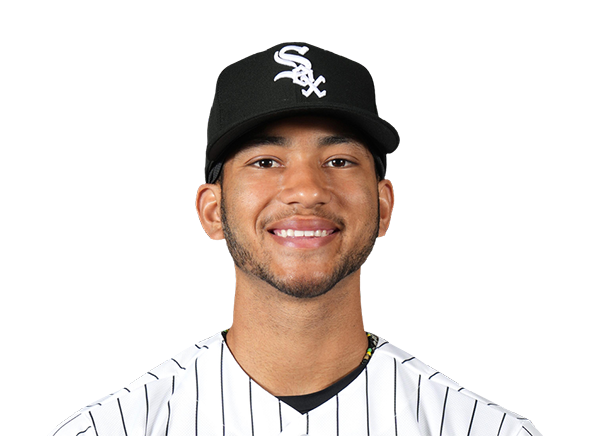 Braden Montgomery | 1-3 | 3 | 0 | 1 | 0 | 0 | 1 | 1 | 15 | .224 | .315 | .351 |
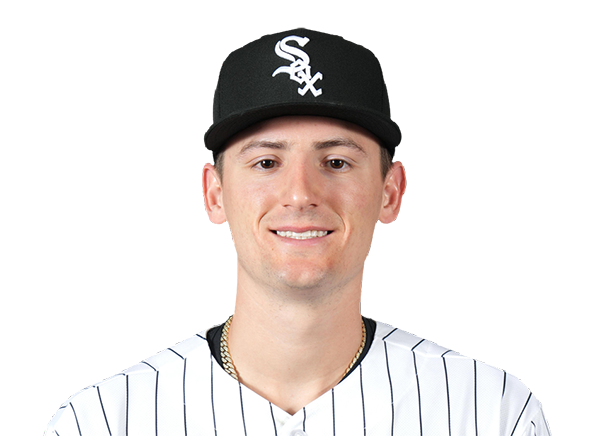 Colson Montgomery | 0-4 | 4 | 1 | 0 | 0 | 0 | 0 | 1 | 13 | .213 | .294 | .432 |
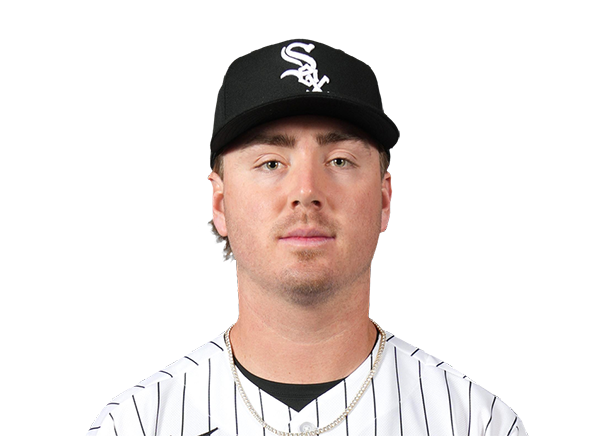 Chase Meidroth | 2-4 | 4 | 0 | 2 | 0 | 0 | 0 | 2 | 15 | .273 | .346 | .400 |
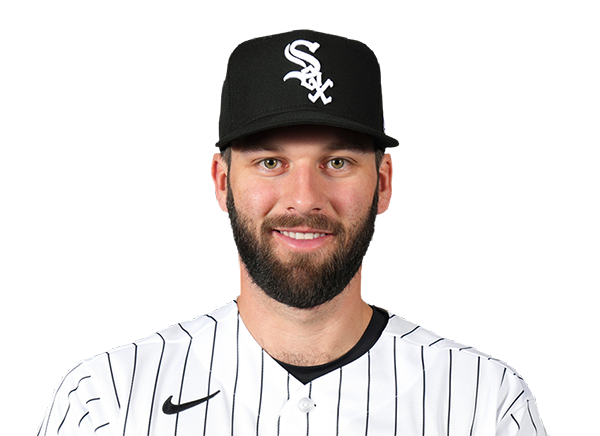 Tristan Peters | 0-2 | 2 | 1 | 0 | 0 | 0 | 0 | 0 | 6 | .278 | .344 | .466 |
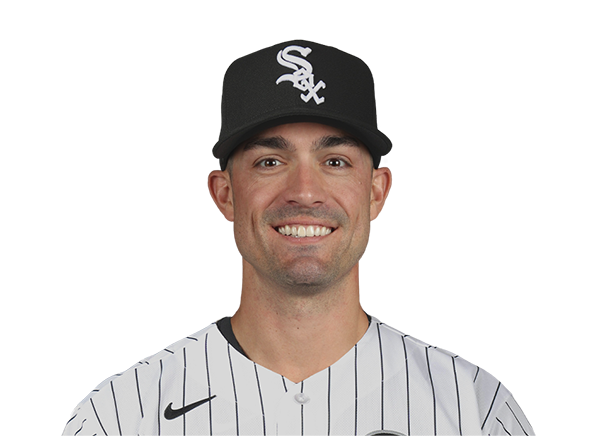 Randal Grichuk | 0-2 | 2 | 0 | 0 | 0 | 0 | 0 | 1 | 10 | .268 | .294 | .536 |
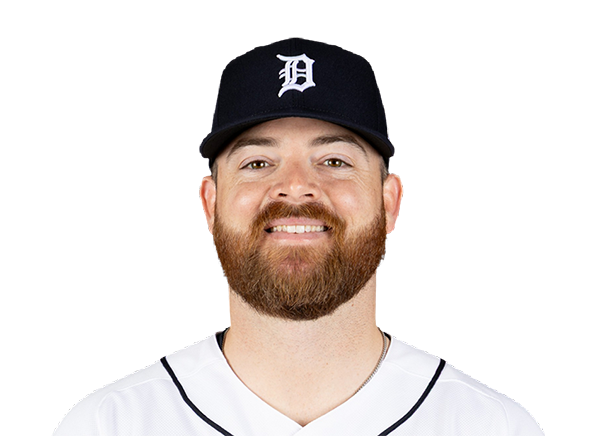 Jake Rogers | 1-3 | 3 | 0 | 1 | 1 | 0 | 0 | 0 | 9 | .172 | .278 | .306 |
Houston Astros
| Player | H-AB | AB | R | H | RBI | HR | BB | K | #P | AVG | OBP | SLG |
|---|---|---|---|---|---|---|---|---|---|---|---|---|
 Jeremy Pena | 0-4 | 4 | 0 | 0 | 0 | 0 | 0 | 1 | 15 | .278 | .332 | .469 |
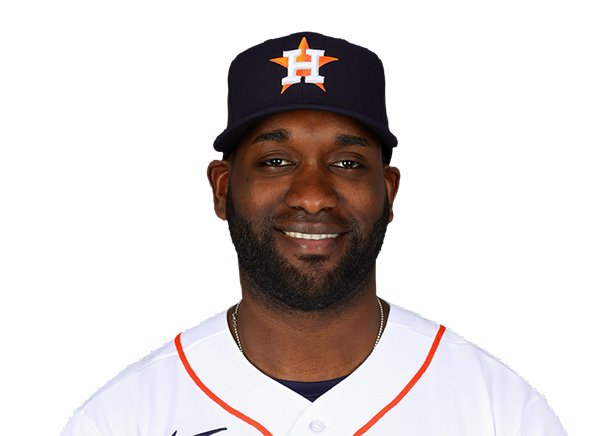 Yordan Alvarez | 0-2 | 2 | 1 | 0 | 0 | 0 | 1 | 1 | 10 | .316 | .433 | .602 |
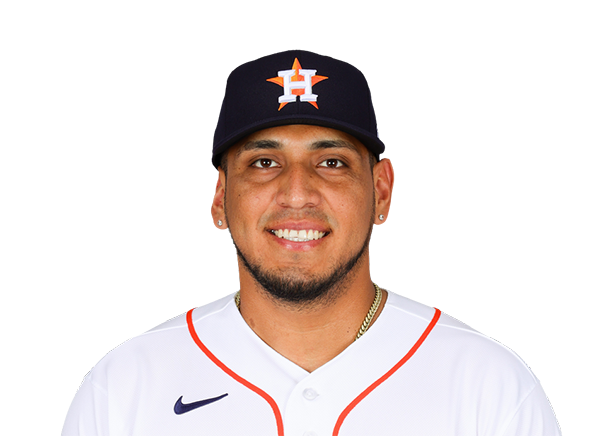 Isaac Paredes | 1-3 | 3 | 2 | 1 | 1 | 0 | 1 | 1 | 24 | .257 | .357 | .422 |
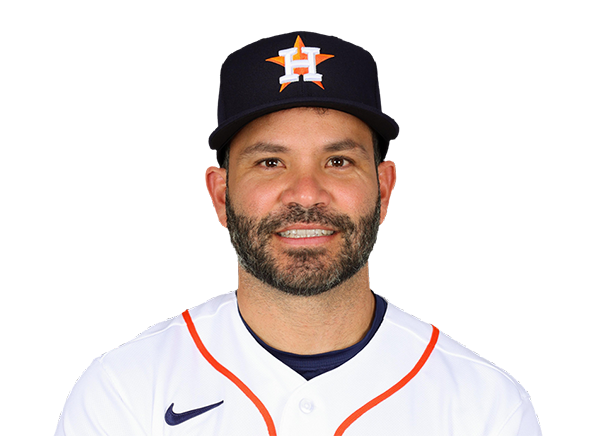 Jose Altuve | 1-4 | 4 | 1 | 1 | 2 | 1 | 0 | 2 | 11 | .244 | .309 | .397 |
 Nick Allen | 0-0 | 0 | 0 | 0 | 0 | 0 | 0 | 0 | 0 | .275 | .319 | .359 |
 Daulton Varsho | 1-4 | 4 | 1 | 1 | 2 | 0 | 0 | 0 | 12 | .229 | .293 | .363 |
 Christian Walker | 2-4 | 4 | 0 | 2 | 1 | 0 | 0 | 0 | 14 | .228 | .302 | .426 |
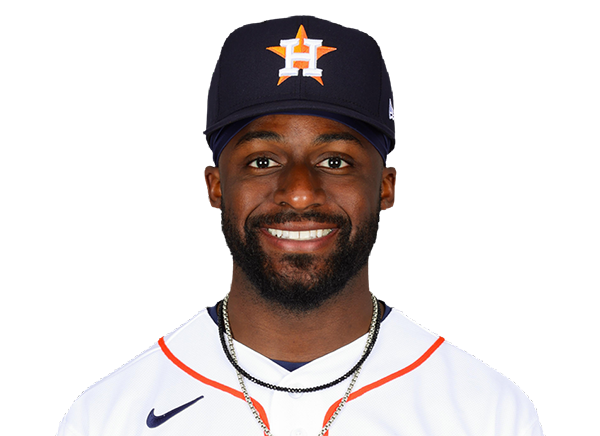 Taylor Trammell | 1-3 | 3 | 0 | 1 | 0 | 0 | 1 | 0 | 13 | .209 | .295 | .365 |
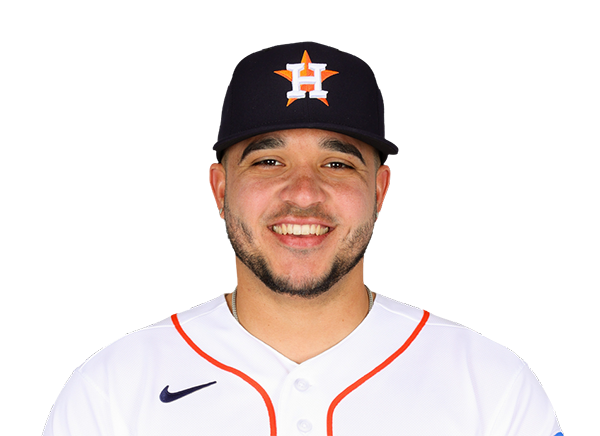 Yainer Diaz | 1-4 | 4 | 0 | 1 | 0 | 0 | 0 | 0 | 9 | .257 | .287 | .414 |
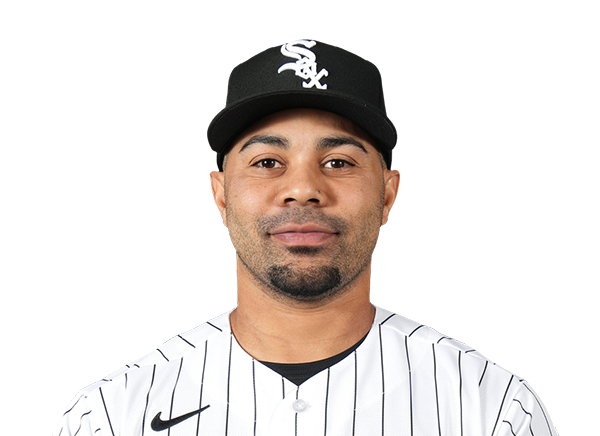 LaMonte Wade Jr. | 1-2 | 2 | 1 | 1 | 0 | 0 | 0 | 0 | 7 | .208 | .323 | .340 |
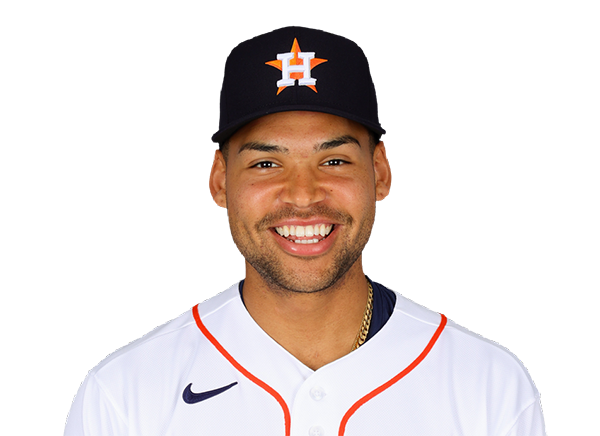 Cam Smith | 0-2 | 2 | 0 | 0 | 0 | 0 | 0 | 0 | 9 | .212 | .278 | .386 |
Chicago White Sox
| Player | IP | H | R | ER | BB | K | HR | PC-ST | ERA | PC |
|---|---|---|---|---|---|---|---|---|---|---|
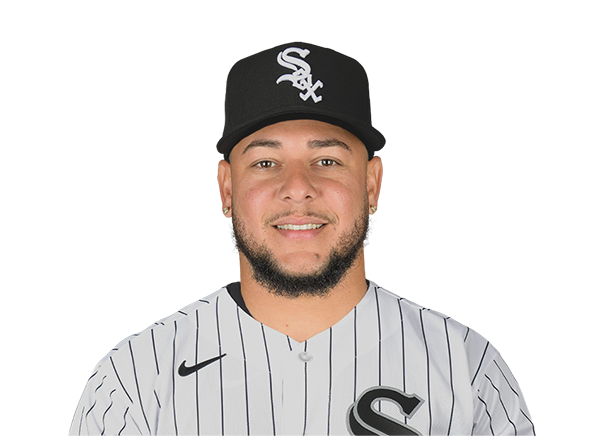 Luis Castillo | 4.0 | 6 | 6 | 6 | 2 | 3 | 1 | 78-48 | 5.57 | 78 |
 Tyler Schweitzer | 2.0 | 1 | 0 | 0 | 1 | 0 | 0 | 22-13 | 3.41 | 22 |
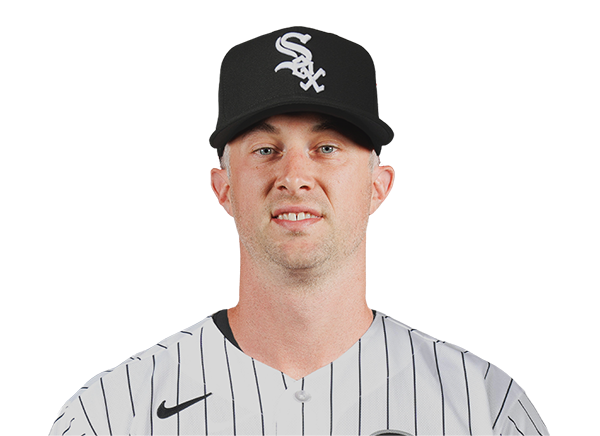 Trevor Richards | 1.0 | 0 | 0 | 0 | 0 | 2 | 0 | 7-7 | 3.48 | 7 |
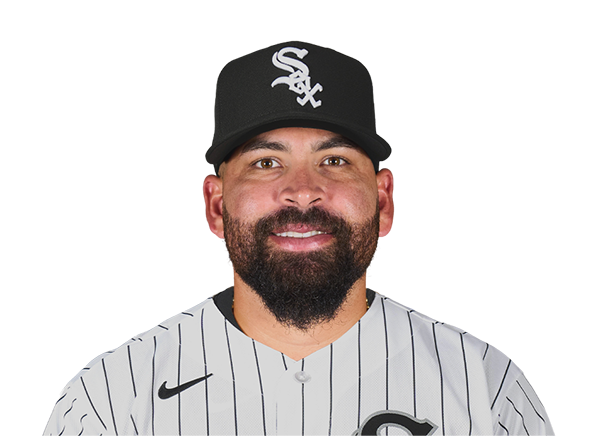 Jose Urquidy | 1.0 | 1 | 0 | 0 | 0 | 0 | 0 | 17-10 | 5.40 | 17 |
Houston Astros
| Player | IP | H | R | ER | BB | K | HR | PC-ST | ERA | PC |
|---|---|---|---|---|---|---|---|---|---|---|
 Hunter Brown | 6.0 | 6 | 2 | 2 | 2 | 7 | 0 | 101-65 | 3.31 | 101 |
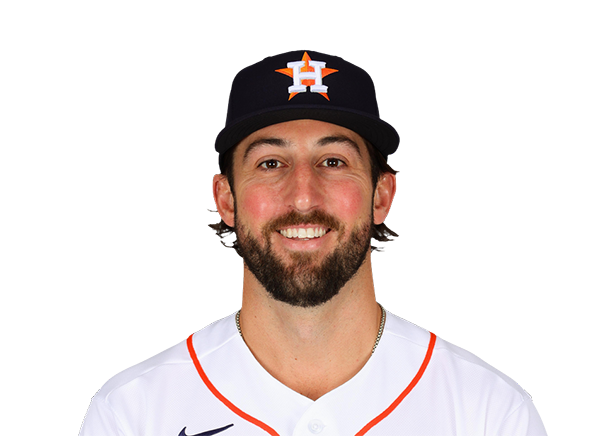 Bennett Sousa | 1.0 | 0 | 0 | 0 | 0 | 1 | 0 | 11-9 | 6.23 | 11 |
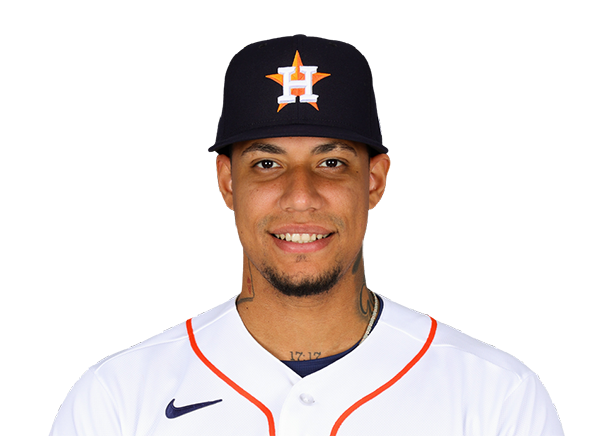 Bryan Abreu | 1.0 | 0 | 0 | 0 | 0 | 1 | 0 | 9-7 | 3.86 | 9 |
 AJ Blubaugh | 1.0 | 1 | 0 | 0 | 0 | 1 | 0 | 10-10 | 3.02 | 10 |
H2H / Season Series
HOU6–2
CHW
HOU2–0
CHW
HOU1–5
CHW
HOU6–3
CHW
CHW12–3
HOU
CHW1–4
HOU
CHW5–9
HOU
Last 5 Games
| Date | Opponent | Result |
|---|---|---|
| Sep 2 | @ HOU | L0–2 |
| Sep 1 | @ HOU | W5–1 |
| Aug 31 | @ HOU | L3–6 |
| Aug 30 |  @ MIN | L1–5 |
| Aug 29 | @ MIN | W3–2 |
| Date | Opponent | Result |
|---|---|---|
| Sep 3 | vs CHW | W6–2 |
| Sep 2 | vs CHW | W2–0 |
| Sep 1 | vs CHW | L1–5 |
| Aug 31 | vs CHW | W6–3 |
| Aug 30 |  @ NYM | W6–3 |
Standings
American League
| Team | W | L | PCT | GB | DIFF | STRK |
|---|---|---|---|---|---|---|
1 Rays | 83 | 56 | .597 | - | +51 | L1 |
| 2White Sox | 73 | 66 | .525 | 10 | +43 | L1 |
| 3Astros | 71 | 69 | .507 | 12.5 | -42 | W1 |
4 Yankees | 80 | 60 | .571 | 3.5 | +115 | W2 |
5 Red Sox | 75 | 65 | .536 | 8.5 | +77 | L2 |
6 Guardians | 70 | 69 | .504 | 13 | -8 | L1 |
7 Rangers | 69 | 71 | .493 | 14.5 | -48 | L1 |
8 Blue Jays | 69 | 71 | .493 | 14.5 | -44 | W1 |
9 Orioles | 69 | 71 | .493 | 14.5 | -20 | L2 |
| 10Twins | 67 | 73 | .479 | 16.5 | -38 | L1 |
11 Mariners | 66 | 74 | .471 | 17.5 | -65 | W2 |
12 Tigers | 64 | 75 | .460 | 19 | +47 | W1 |
13 Royals | 62 | 78 | .443 | 21.5 | -89 | L3 |
14 Athletics | 54 | 86 | .386 | 29.5 | -194 | W1 |
15 Angels | 53 | 87 | .379 | 30.5 | -80 | L2 |
National League
| Team | W | L | PCT | GB | DIFF | STRK |
|---|---|---|---|---|---|---|
1 Brewers | 87 | 53 | .621 | - | +172 | W2 |
2 Braves | 83 | 57 | .593 | 4 | +118 | W1 |
3 Dodgers | 82 | 57 | .590 | 4.5 | +146 | L2 |
4 Phillies | 79 | 61 | .564 | 8 | +36 | L1 |
5 Cubs | 78 | 62 | .557 | 9 | +132 | L2 |
6 Diamondbacks | 74 | 67 | .525 | 13.5 | -1 | W1 |
7 Padres | 73 | 67 | .521 | 14 | +10 | L2 |
8 Marlins | 71 | 69 | .507 | 16 | +18 | W2 |
9 Cardinals | 70 | 70 | .500 | 17 | -8 | W2 |
10 Pirates | 68 | 72 | .486 | 19 | +26 | L1 |
11 Reds | 67 | 73 | .479 | 20 | -108 | W2 |
12 Nationals | 67 | 75 | .472 | 21 | +14 | L1 |
| 13Mets | 63 | 77 | .450 | 24 | -50 | W1 |
14 Giants | 58 | 82 | .414 | 29 | -70 | W1 |
15 Rockies | 54 | 86 | .386 | 33 | -140 | W2 |
CHW
VS
HOU
Pitchers
Luis Castillo
Catchers
Jake Rogers
Infielders
Munetaka Murakami
Miguel Vargas
Colson Montgomery
Chase Meidroth
Outfielders
Sam Antonacci
Braden Montgomery
Tristan Peters
Designated Hitters
Andrew Benintendi
Pitchers
Hunter Brown
Catchers
Yainer Diaz
Infielders
Jeremy Pena
Isaac Paredes
Jose Altuve
Christian Walker
Outfielders
Daulton Varsho
Taylor Trammell
LaMonte Wade Jr.
Designated Hitters
Yordan Alvarez
White Sox
VS
Astros
Batting
140
Team Games Played
141
4703
At Bats
4734
1112
Hits
1137
631
Runs Batted In
608
181
Home Runs
185
77
Stolen Bases
43
.236
Batting Average
.240
662
Runs
639
220
Doubles
207
14
Triples
17
1903
Total Bases
1933
503
Walks
470
1272
Strikeouts
1152
.319
On Base Percentage
.315
.405
Slugging Percentage
.408
.723
OBP Pct + SLG Pct
.724
140
Games Played
141
140
Games Started
141
79
Hit By Pitch
67
0.0
Wins Above Replacement
0.0
0.0
Offensive Wins Above Replacement
0.0
33
Caught Stealing
19
1
Is Qualified
1
626.5
Runs Created
614.0
4.5
Runs Created Per 27 Outs
4.4
.094
Walks Per Plate Appearance
.088
0.40
Walk To Strikeout Ratio
0.41
.168
Isolated Power
.168
.284
Secondary Average
.272
3.87
Pitches Per Plate Appearance
3.88
415
Extra Base Hits
409
5343
Plate Appearances
5325
26.0
At Bats Per Home Run
25.6
26
Sacrifice Hit
17
30
Sacrifice Flies
35
Pitching
140
Team Games Played
141
32
Quality Starts
39
73
Wins
72
67
Losses
69
37
Saves
44
56
Holds
73
1126
Hits
1119
574
Earned runs
634
158
Home Runs
180
508
Walks
581
1167
Strikeouts
1235
8.4
Strikeouts Per 9 Innings
8.9
150.9
Pitches Per Start
152.3
1.31
Walks Plus Hits Per Inning Pitched
1.36
4.14
Earned Run Average
4.56
67
Losses
69
1247.0
Innings pitched
1251.1
.521
Win Percentage
.511
63
Save Opportunities
53
.240
Opponent Batting Average
.238
.323
Opponent's On-base pct.
.331
.397
Opponent's Slugging pct.
.403
.719
Opponent's OPB Pct + SLG Pct
.733
4688
At Bats
4693
217
Doubles
186
21
Triples
22
81
Batters Hit
82
107
Stolen Bases
114
140
Games Played
141
0
Complete Games
0
9
Shutouts
9
63
Wild Pitches
45
600
Runs Batted In
646
9
Balks
6
1247.0
Innings pitched
1251.1
8.4
Strikeouts Per 9 Innings
8.9
38
Caught Stealing
36
140
Games Started
141
0.0
Wins Above Replacement
0.0
1
Is Qualified
1
623
Runs
677
574
Earned Runs
634
1859
Total Bases
1889
Fielding
140
Team Games Played
141
1247
Full Innings
1251
4948
Total Chances
4859
3741
Putouts
3754
1136
Assists
1041
71
Errors
64
220
Double Plays
207
0.986
Fielding Percentage
0.987
35.2
Range Factor
34.5
0.0
Zone Rating
0.0
140
Games Played
141
0
Games Started
0
0.0
Defensive Wins Above Replacement
0.0
1
Qualified
1