

White Sox vs Guardians Live Score (5 Oct, 2026)
Game Information
Stage
QTR
Season
2026
First Pitch
Mon, Oct 5, 5:00 pm
Venue
Progressive Field
Location
Cleveland, Ohio
Venue Type
Outdoor
Broadcast
TBS
Attendance
32,050
Live Situation
0Balls
1Strikes
0Outs
—Pitcher
—At Bat
Pitch Sequence
1
STRIKE FOUL
Curve
83 MPH
2
BALL IN PLAY
Curve
83 MPH
Injury Report


Team Stats
 CHW
CLE


4
Runs
3
6
Hits
4
1
Errors
1
0
Home Runs
0
4
Walks
3
13
Strikeouts
9
Player Box Score
Chicago White Sox
| Player | H-AB | AB | R | H | RBI | HR | BB | K | #P | AVG | OBP | SLG |
|---|---|---|---|---|---|---|---|---|---|---|---|---|
 Sam Antonacci | 0-4 | 4 | 0 | 0 | 0 | 0 | 0 | 1 | 23 | .167 | .286 | .250 |
 Kyle Teel | 1-4 | 4 | 1 | 1 | 0 | 0 | 0 | 2 | 16 | .235 | .278 | .235 |
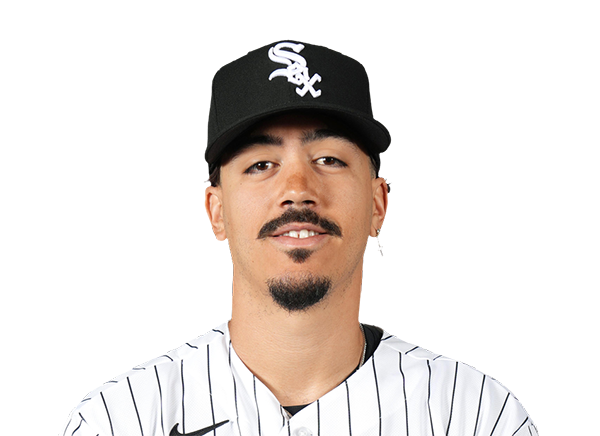 Miguel Vargas | 1-2 | 2 | 1 | 1 | 0 | 0 | 2 | 0 | 22 | .154 | .389 | .154 |
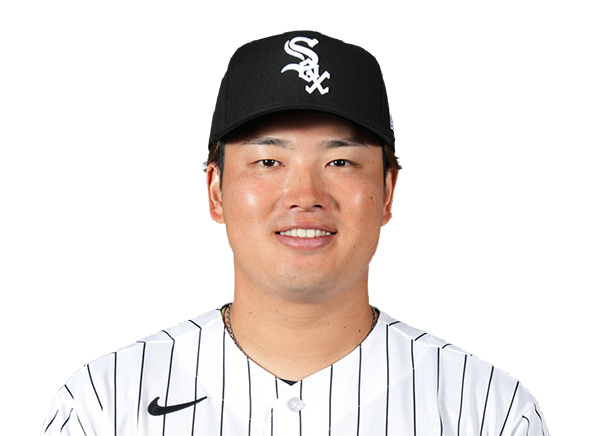 Munetaka Murakami | 1-4 | 4 | 0 | 1 | 1 | 0 | 0 | 1 | 12 | .250 | .278 | .438 |
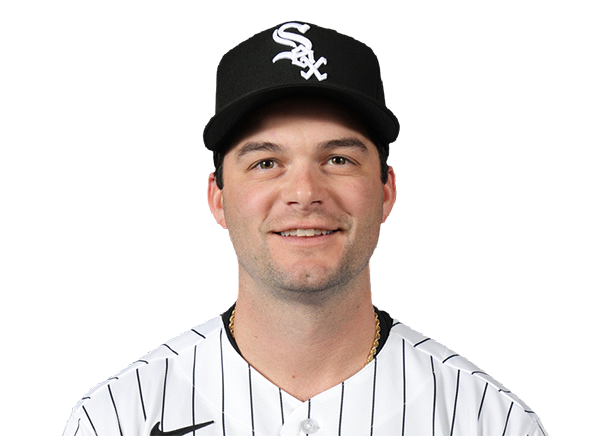 Andrew Benintendi | 0-2 | 2 | 0 | 0 | 0 | 0 | 0 | 2 | 8 | .200 | .429 | .200 |
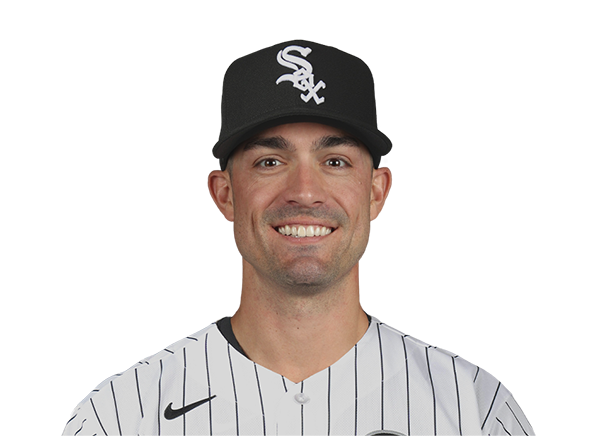 Randal Grichuk | 0-1 | 1 | 1 | 0 | 0 | 0 | 1 | 1 | 9 | .333 | .429 | .333 |
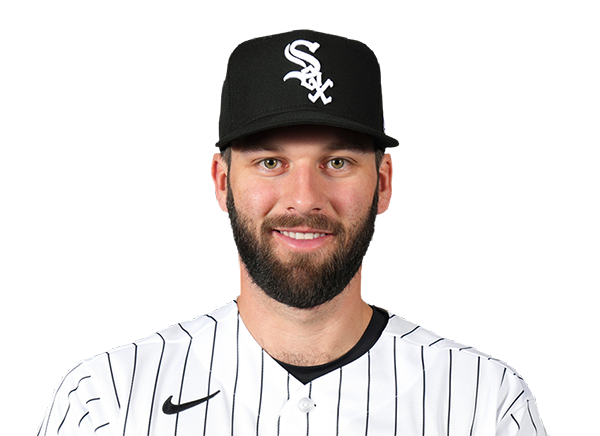 Tristan Peters | 0-2 | 2 | 0 | 0 | 0 | 0 | 0 | 1 | 7 | .273 | .333 | .273 |
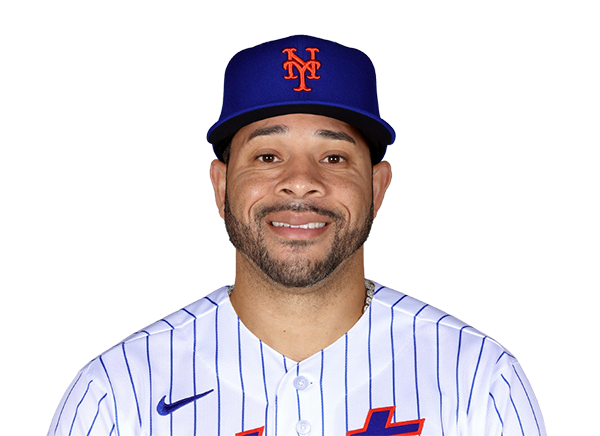 Tommy Pham | 0-1 | 1 | 0 | 0 | 0 | 0 | 0 | 0 | 5 | .000 | .250 | .000 |
 Brenton Doyle | 0-1 | 1 | 0 | 0 | 0 | 0 | 0 | 0 | 4 | .167 | .167 | .167 |
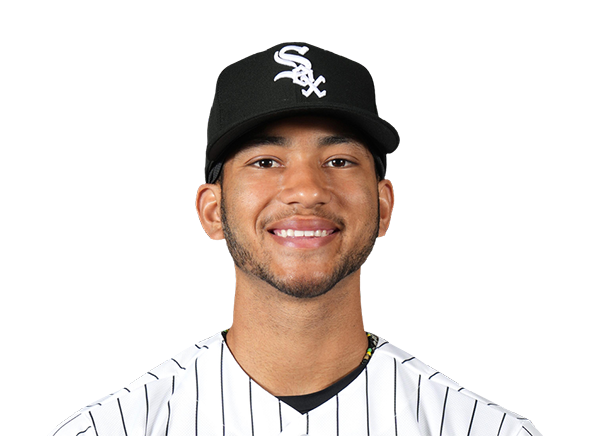 Braden Montgomery | 1-4 | 4 | 1 | 1 | 2 | 0 | 0 | 2 | 14 | .200 | .200 | .267 |
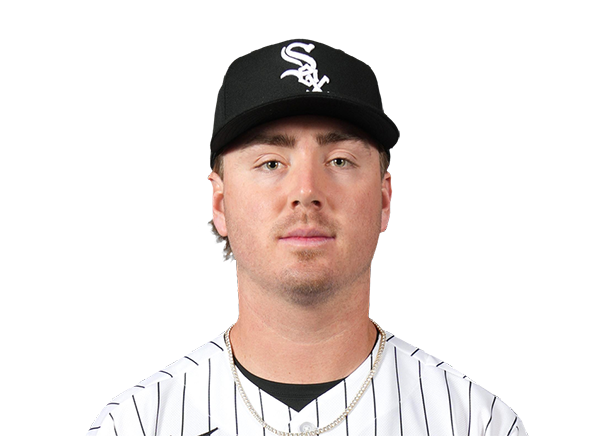 Chase Meidroth | 2-4 | 4 | 0 | 2 | 1 | 0 | 0 | 1 | 10 | .400 | .438 | .600 |
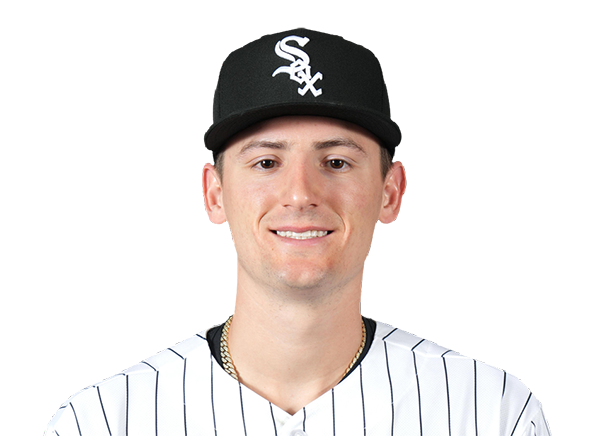 Colson Montgomery | 0-3 | 3 | 0 | 0 | 0 | 0 | 1 | 2 | 17 | .250 | .400 | .583 |
Cleveland Guardians
| Player | H-AB | AB | R | H | RBI | HR | BB | K | #P | AVG | OBP | SLG |
|---|---|---|---|---|---|---|---|---|---|---|---|---|
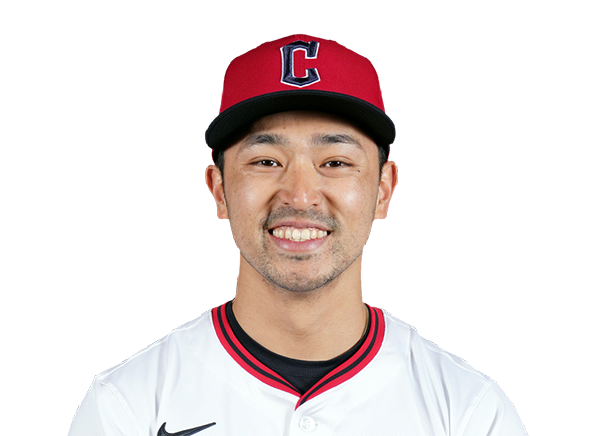 Steven Kwan | 1-4 | 4 | 1 | 1 | 0 | 0 | 0 | 0 | 18 | .143 | .250 | .143 |
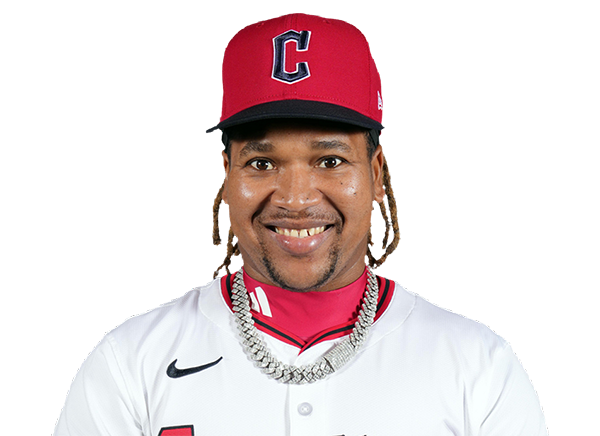 Jose Ramirez | 0-3 | 3 | 1 | 0 | 0 | 0 | 1 | 2 | 22 | .000 | .250 | .000 |
 Chase DeLauter | 2-4 | 4 | 1 | 2 | 0 | 0 | 0 | 0 | 22 | .250 | .250 | .250 |
 Jo Adell | 1-3 | 3 | 0 | 1 | 1 | 0 | 1 | 2 | 13 | .143 | .250 | .429 |
 Nathaniel Lowe | 0-4 | 4 | 0 | 0 | 1 | 0 | 0 | 1 | 11 | .167 | .286 | .333 |
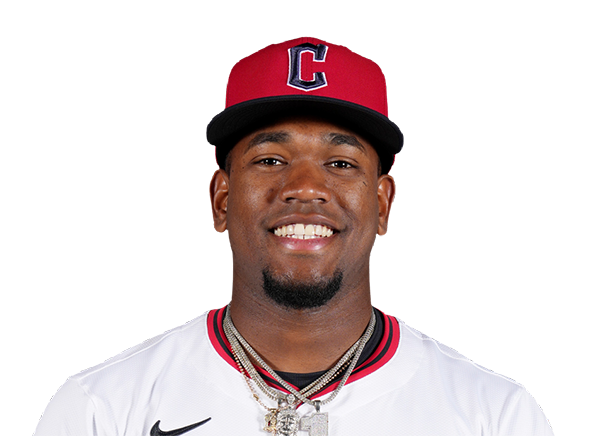 Angel Martinez | 0-4 | 4 | 0 | 0 | 0 | 0 | 0 | 2 | 16 | .000 | .000 | .000 |
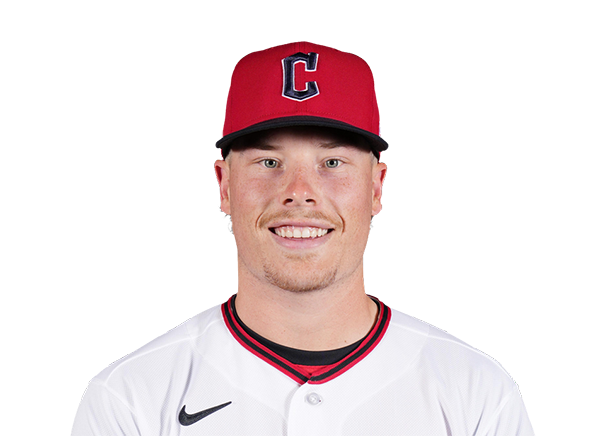 Travis Bazzana | 0-3 | 3 | 0 | 0 | 0 | 0 | 1 | 1 | 19 | .143 | .250 | .286 |
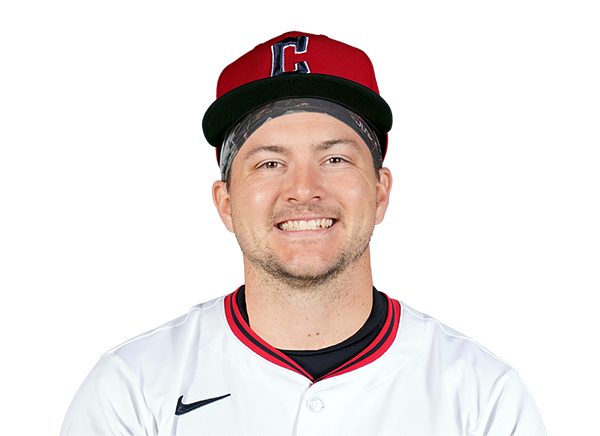 Patrick Bailey | 0-4 | 4 | 0 | 0 | 0 | 0 | 0 | 1 | 11 | .200 | .200 | .200 |
 Brayan Rocchio | 0-3 | 3 | 0 | 0 | 0 | 0 | 0 | 0 | 15 | .000 | .167 | .000 |
Chicago White Sox
| Player | IP | H | R | ER | BB | K | HR | PC-ST | ERA | PC |
|---|---|---|---|---|---|---|---|---|---|---|
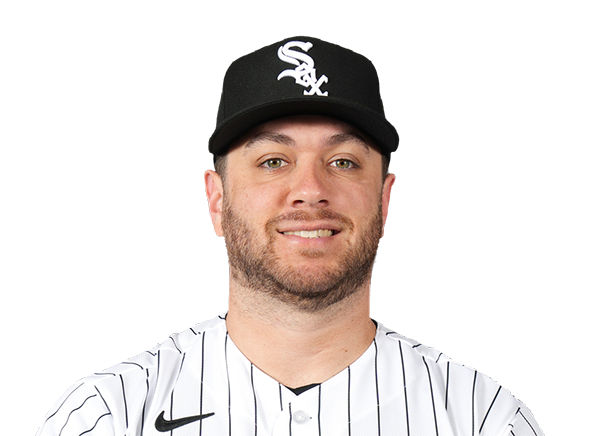 Anthony Kay | 0.1 | 1 | 2 | 1 | 1 | 0 | 0 | 17-8 | 3.86 | 17 |
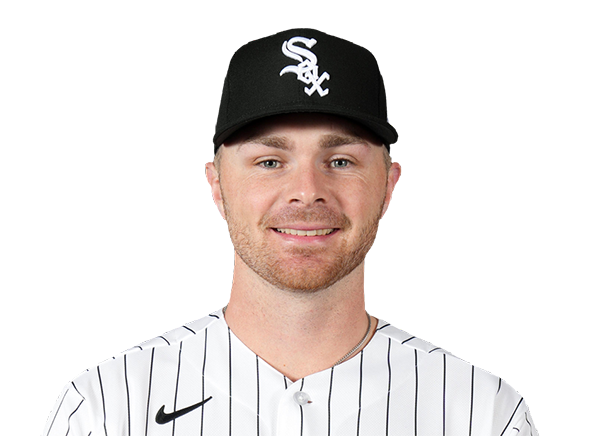 Sean Newcomb | 2.0 | 1 | 0 | 0 | 1 | 3 | 0 | 40-24 | 6.00 | 40 |
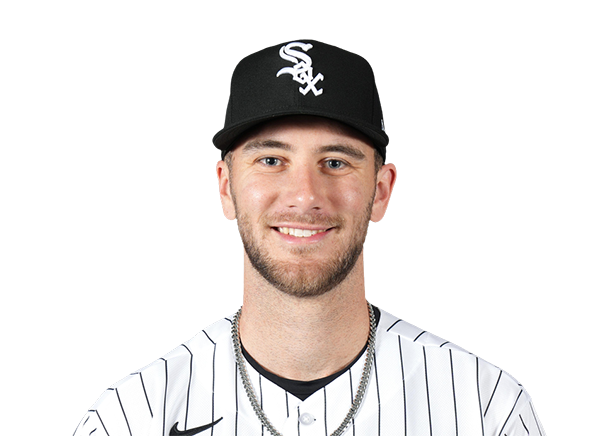 Sean Burke | 5.1 | 1 | 1 | 1 | 1 | 6 | 0 | 83-53 | 3.86 | 83 |
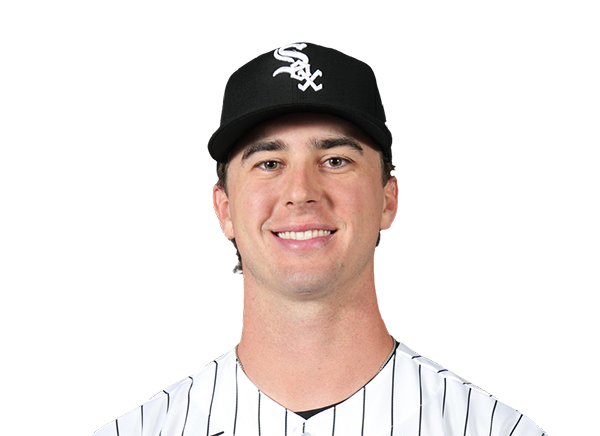 Grant Taylor | 1.1 | 1 | 0 | 0 | 0 | 0 | 0 | 7-7 | 0.00 | 7 |
Cleveland Guardians
| Player | IP | H | R | ER | BB | K | HR | PC-ST | ERA | PC |
|---|---|---|---|---|---|---|---|---|---|---|
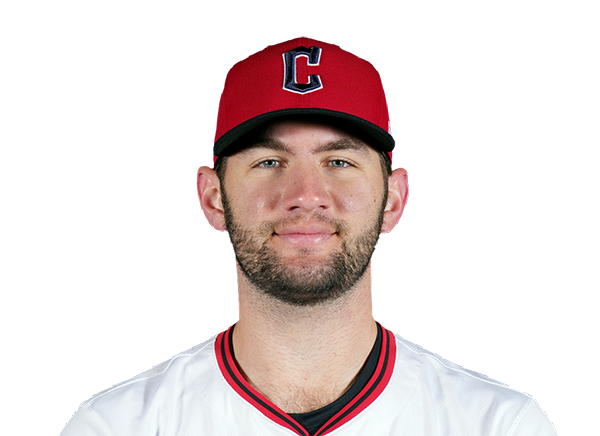 Gavin Williams | 5.0 | 4 | 2 | 2 | 3 | 11 | 0 | 98-59 | 3.60 | 98 |
 Erik Sabrowski | 0.2 | 1 | 2 | 2 | 1 | 0 | 0 | 11-4 | 11.57 | 11 |
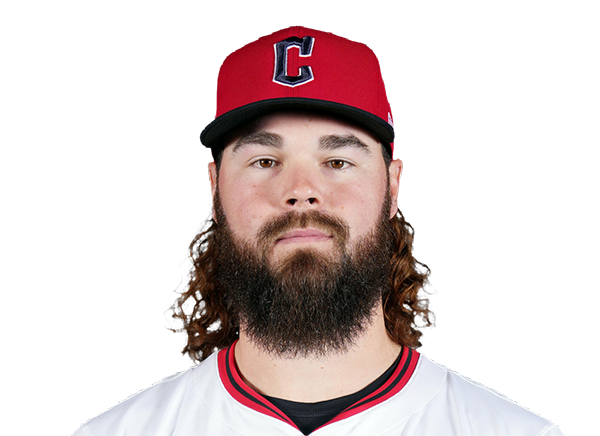 Hunter Gaddis | 1.0 | 1 | 0 | 0 | 0 | 1 | 0 | 17-10 | 0.00 | 17 |
 Shawn Armstrong | 1.1 | 0 | 0 | 0 | 0 | 1 | 0 | 16-12 | 0.00 | 16 |
 Cade Smith | 1.0 | 0 | 0 | 0 | 0 | 0 | 0 | 5-5 | 0.00 | 5 |
H2H / Season Series
CLE3–4
CHW
CLE0–3
CHW
CLE6–3
CHW
CLE7–6
CHW
CLE3–7
CHW
CHW5–3
CLE
CHW6–3
CLE
CHW2–8
CLE
CLE6–7
CHW
CLE1–3
CHW
Last 5 Games
| Date | Opponent | Result |
|---|---|---|
| Oct 5 | @ CLE | W4–3 |
| Oct 3 | @ CLE | W3–0 |
| Sep 30 |  @ HOU | W7–3 |
| Sep 29 | @ HOU | W6–3 |
| Date | Opponent | Result |
|---|---|---|
| Oct 5 | vs CHW | L3–4 |
| Oct 3 | vs CHW | L0–3 |
Standings
American League
| Team | W | L | PCT | GB | DIFF | STRK |
|---|---|---|---|---|---|---|
1 Rays | 98 | 64 | .605 | - | +86 | L1 |
| 2Guardians | 85 | 77 | .525 | 13 | +11 | L1 |
| 3Astros | 81 | 81 | .500 | 17 | -32 | W2 |
4 Yankees | 93 | 68 | .578 | 4.5 | +138 | W1 |
5 Red Sox | 87 | 75 | .537 | 11 | +78 | L1 |
| 6White Sox | 84 | 78 | .519 | 14 | +56 | W1 |
7 Rangers | 80 | 82 | .494 | 18 | -46 | L1 |
8 Orioles | 79 | 82 | .491 | 18.5 | -21 | L1 |
9 Blue Jays | 79 | 83 | .488 | 19 | -46 | W1 |
10 Twins | 77 | 85 | .475 | 21 | -58 | W1 |
11 Tigers | 76 | 86 | .469 | 22 | +71 | L1 |
12 Mariners | 76 | 86 | .469 | 22 | -58 | W2 |
13 Royals | 69 | 93 | .426 | 29 | -120 | W1 |
14 Athletics | 64 | 98 | .395 | 34 | -238 | L2 |
15 Angels | 62 | 100 | .383 | 36 | -97 | L2 |
National League
| Team | W | L | PCT | GB | DIFF | STRK |
|---|---|---|---|---|---|---|
1 Brewers | 103 | 59 | .636 | - | +214 | W5 |
2 Dodgers | 100 | 62 | .617 | 3 | +201 | W3 |
3 Braves | 94 | 68 | .580 | 9 | +116 | L1 |
4 Padres | 91 | 71 | .562 | 12 | +41 | W2 |
5 Cubs | 89 | 73 | .549 | 14 | +147 | W1 |
6 Phillies | 88 | 74 | .543 | 15 | +15 | W1 |
7 Diamondbacks | 86 | 76 | .531 | 17 | +9 | L2 |
8 Pirates | 82 | 80 | .506 | 21 | +28 | W1 |
9 Marlins | 80 | 82 | .494 | 23 | +3 | W1 |
10 Cardinals | 77 | 85 | .475 | 26 | -29 | L4 |
11 Nationals | 77 | 85 | .475 | 26 | +6 | W1 |
12 Reds | 75 | 87 | .463 | 28 | -160 | L1 |
13 Mets | 74 | 88 | .457 | 29 | -32 | L1 |
14 Giants | 65 | 97 | .401 | 38 | -91 | L5 |
15 Rockies | 58 | 104 | .358 | 45 | -192 | L1 |
CHW
VS
CLE
Pitchers
Anthony Kay
Catchers
Kyle Teel
Infielders
Miguel Vargas
Munetaka Murakami
Chase Meidroth
Colson Montgomery
Outfielders
Sam Antonacci
Tristan Peters
Braden Montgomery
Designated Hitters
Andrew Benintendi
Pitchers
Gavin Williams
Catchers
Patrick Bailey
Infielders
Jose Ramirez
Nathaniel Lowe
Travis Bazzana
Brayan Rocchio
Outfielders
Steven Kwan
Chase DeLauter
Angel Martinez
Designated Hitters
Jo Adell
White Sox
VS
Guardians
Batting
4
Team Games Played
2
132
At Bats
61
31
Hits
7
18
Runs Batted In
2
3
Home Runs
0
3
Stolen Bases
0
.235
Batting Average
.115
20
Runs
3
3
Doubles
2
0
Triples
1
43
Total Bases
11
16
Walks
8
44
Strikeouts
21
.325
On Base Percentage
.217
.326
Slugging Percentage
.180
.650
OBP Pct + SLG Pct
.398
4
Games Played
2
4
Games Started
2
2
Hit By Pitch
0
0.0
Wins Above Replacement
0.0
0.0
Offensive Wins Above Replacement
0.0
0
Caught Stealing
0
1
Is Qualified
1
13.8
Runs Created
1.4
3.4
Runs Created Per 27 Outs
0.7
.105
Walks Per Plate Appearance
.116
0.36
Walk To Strikeout Ratio
0.38
.091
Isolated Power
.066
.235
Secondary Average
.197
4.05
Pitches Per Plate Appearance
4.13
6
Extra Base Hits
3
152
Plate Appearances
69
44.0
At Bats Per Home Run
0.0
1
Sacrifice Hit
0
1
Sacrifice Flies
0
Pitching
4
Team Games Played
2
0
Quality Starts
0
4
Wins
0
0
Losses
2
2
Saves
0
3
Holds
0
18
Hits
12
7
Earned runs
7
4
Home Runs
1
11
Walks
8
43
Strikeouts
23
10.8
Strikeouts Per 9 Innings
11.5
147.3
Pitches Per Start
148.0
0.81
Walks Plus Hits Per Inning Pitched
1.11
1.75
Earned Run Average
3.50
0
Losses
2
36.0
Innings pitched
18.0
1.000
Win Percentage
.000
2
Save Opportunities
1
.143
Opponent Batting Average
.194
.223
Opponent's On-base pct.
.286
.270
Opponent's Slugging pct.
.274
.493
Opponent's OPB Pct + SLG Pct
.560
126
At Bats
62
2
Doubles
2
1
Triples
0
2
Batters Hit
0
0
Stolen Bases
0
4
Games Played
2
0
Complete Games
0
1
Shutouts
0
0
Wild Pitches
1
7
Runs Batted In
7
0
Balks
0
36.0
Innings pitched
18.0
10.8
Strikeouts Per 9 Innings
11.5
0
Caught Stealing
0
4
Games Started
2
0.0
Wins Above Replacement
0.0
1
Is Qualified
1
9
Runs
7
7
Earned Runs
7
34
Total Bases
17
Fielding
4
Team Games Played
2
324
Full Innings
162
135
Total Chances
71
108
Putouts
54
25
Assists
16
2
Errors
1
2
Double Plays
12
0.985
Fielding Percentage
0.986
3.7
Range Factor
3.9
0.0
Zone Rating
0.0
4
Games Played
2
0
Games Started
0
0.0
Defensive Wins Above Replacement
0.0
1
Qualified
1