

White Sox vs Rays Live Score (2 Aug, 2026)
Game Information
Stage
Standard
Season
2026
First Pitch
Sun, Aug 2, 1:40 pm
Venue
Tropicana Field
Location
St. Petersburg, Florida
Attendance
23,559
Live Situation
0Balls
0Strikes
0Outs
—Pitcher
—At Bat
Pitch Sequence
1
BALL IN PLAY
Slider
87 MPH
Injury Report
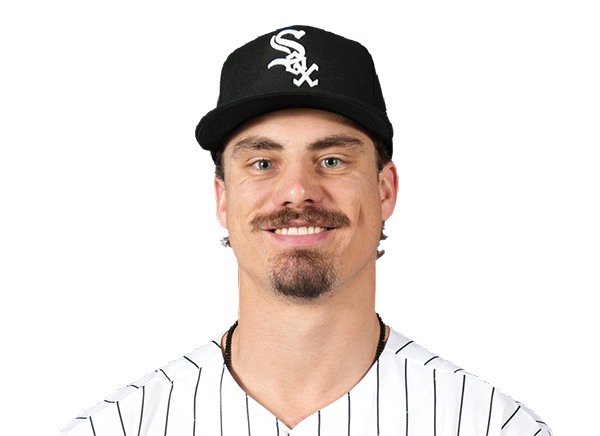

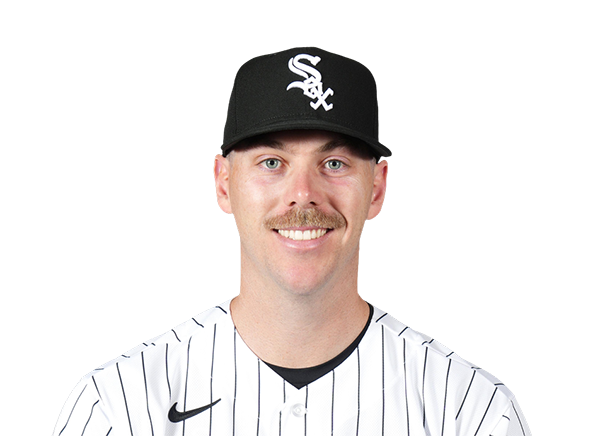
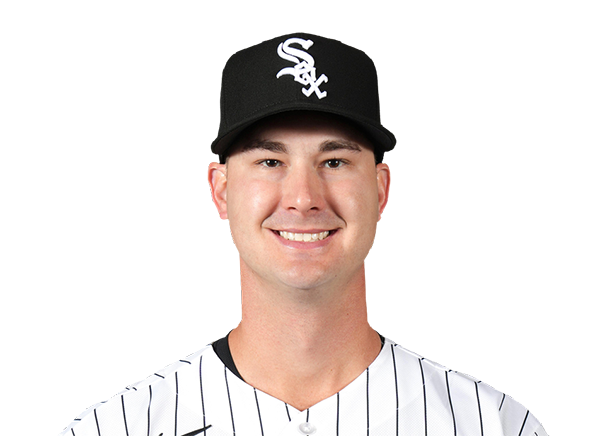
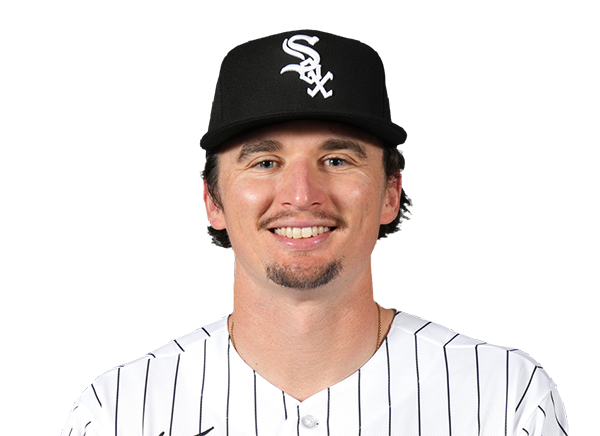


Team Stats
 CHW
TB


9
Runs
1
9
Hits
11
2
Errors
2
3
Home Runs
1
2
Walks
1
12
Strikeouts
5
Player Box Score
Chicago White Sox
| Player | H-AB | AB | R | H | RBI | HR | BB | K | #P | AVG | OBP | SLG |
|---|---|---|---|---|---|---|---|---|---|---|---|---|
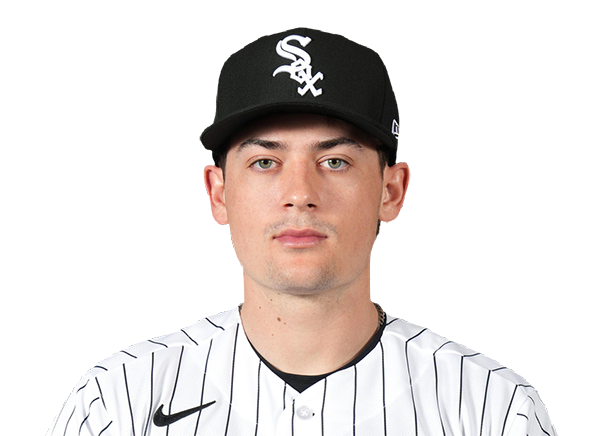 Sam Antonacci | 0-5 | 5 | 1 | 0 | 0 | 0 | 0 | 0 | 24 | .274 | .364 | .407 |
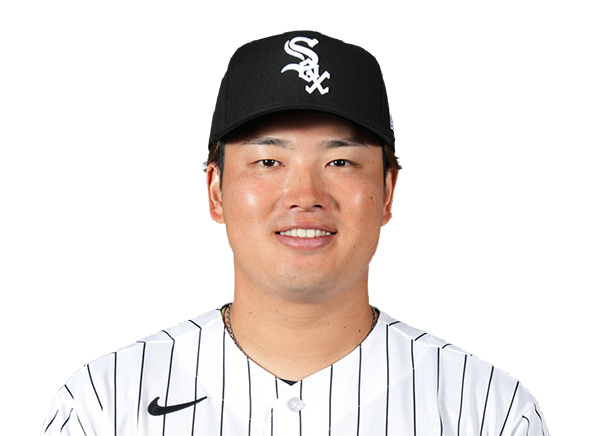 Munetaka Murakami | 1-5 | 5 | 0 | 1 | 0 | 0 | 0 | 2 | 28 | .244 | .378 | .546 |
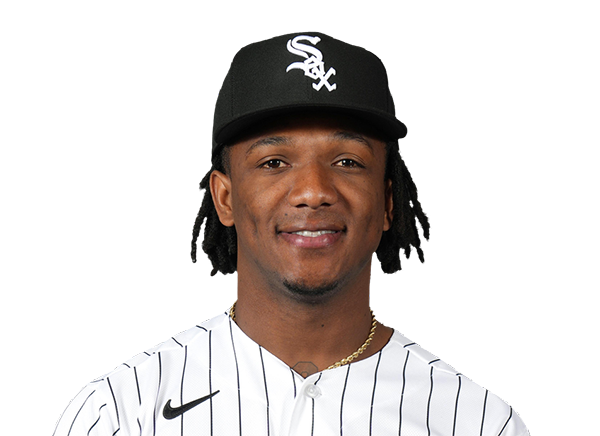 Luisangel Acuna | 0-0 | 0 | 1 | 0 | 0 | 0 | 0 | 0 | 0 | .241 | .273 | .277 |
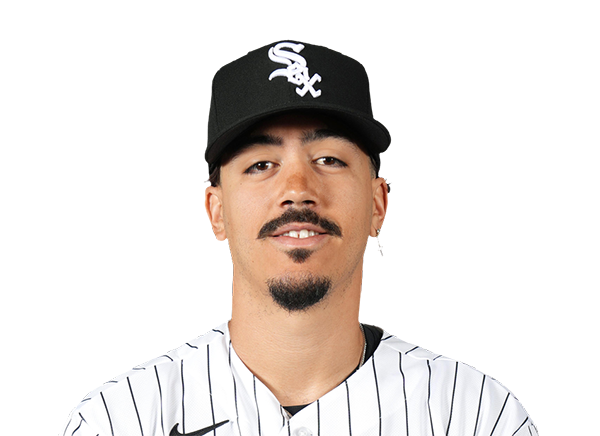 Miguel Vargas | 1-5 | 5 | 1 | 1 | 2 | 1 | 0 | 1 | 16 | .237 | .342 | .479 |
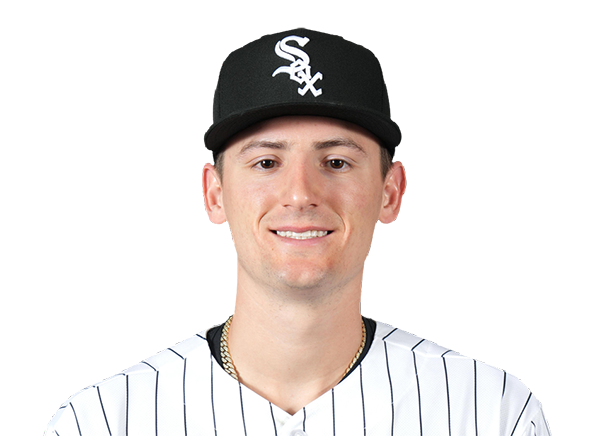 Colson Montgomery | 1-5 | 5 | 1 | 1 | 0 | 0 | 0 | 4 | 18 | .215 | .294 | .449 |
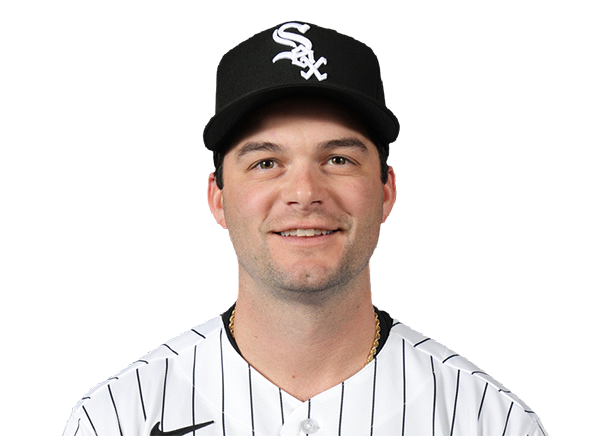 Andrew Benintendi | 1-4 | 4 | 1 | 1 | 1 | 1 | 0 | 0 | 10 | .246 | .308 | .433 |
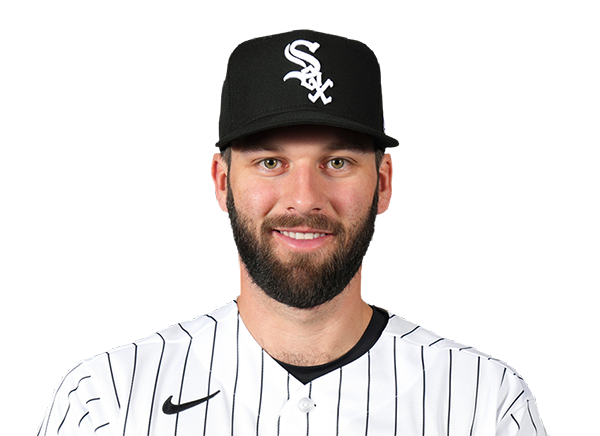 Tristan Peters | 1-3 | 3 | 1 | 1 | 0 | 0 | 1 | 1 | 22 | .267 | .325 | .417 |
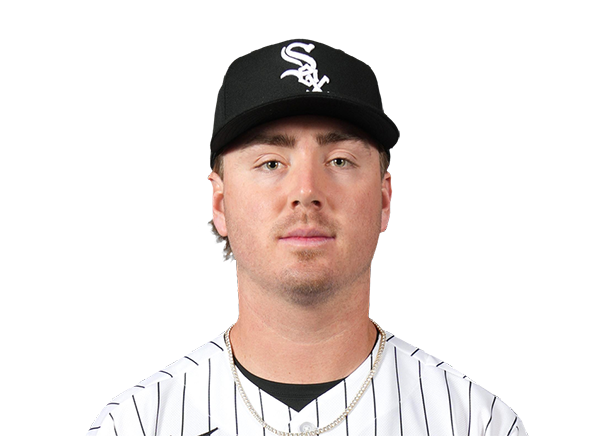 Chase Meidroth | 2-3 | 3 | 2 | 2 | 0 | 0 | 1 | 0 | 13 | .273 | .348 | .391 |
 Everson Pereira | 2-4 | 4 | 1 | 2 | 4 | 1 | 0 | 1 | 13 | .225 | .284 | .438 |
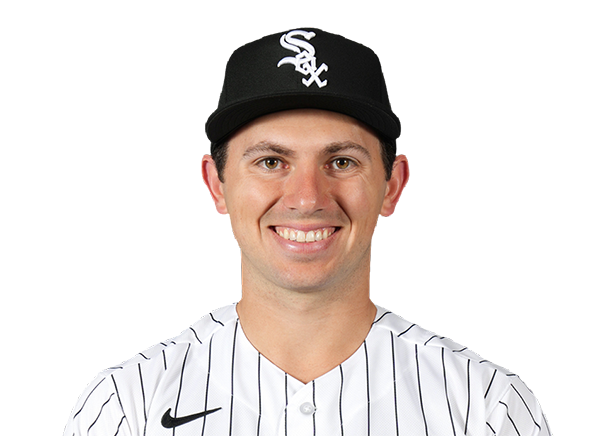 Drew Romo | 0-4 | 4 | 0 | 0 | 0 | 0 | 0 | 3 | 12 | .134 | .220 | .284 |
Tampa Bay Rays
| Player | H-AB | AB | R | H | RBI | HR | BB | K | #P | AVG | OBP | SLG |
|---|---|---|---|---|---|---|---|---|---|---|---|---|
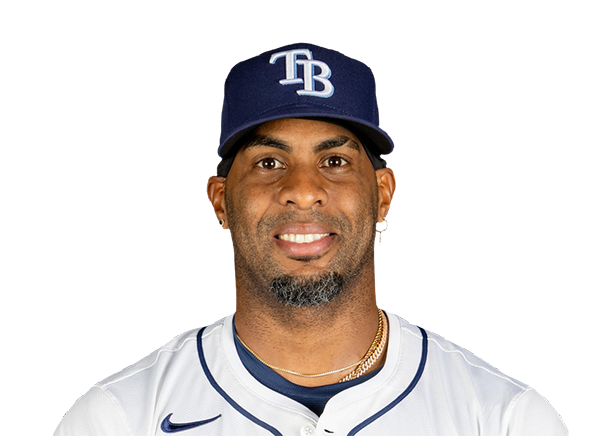 Yandy Diaz | 0-4 | 4 | 0 | 0 | 0 | 0 | 0 | 1 | 21 | .301 | .375 | .460 |
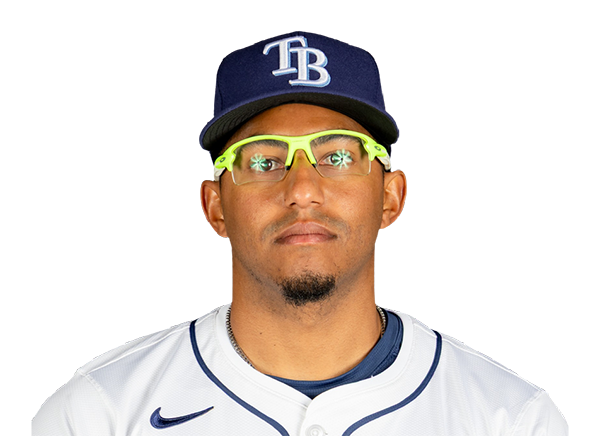 Richie Palacios | 0-1 | 1 | 0 | 0 | 0 | 0 | 0 | 1 | 4 | .225 | .319 | .330 |
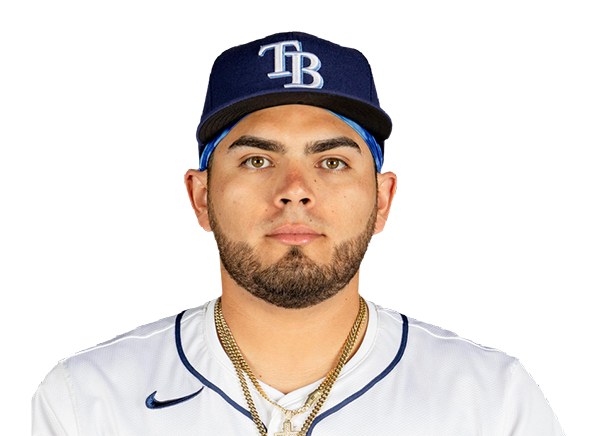 Jonathan Aranda | 1-5 | 5 | 0 | 1 | 0 | 0 | 0 | 1 | 11 | .280 | .371 | .430 |
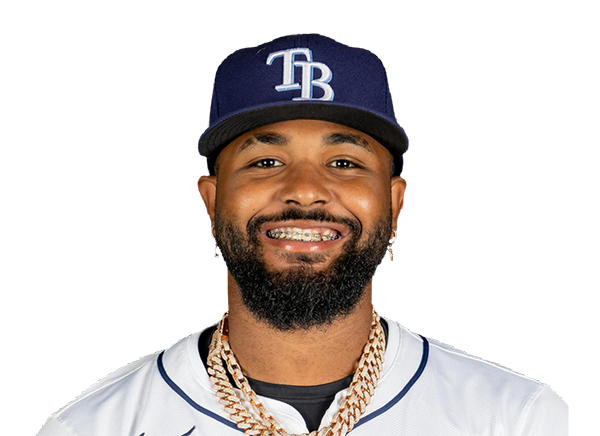 Junior Caminero | 2-4 | 4 | 0 | 2 | 0 | 0 | 0 | 0 | 11 | .282 | .373 | .544 |
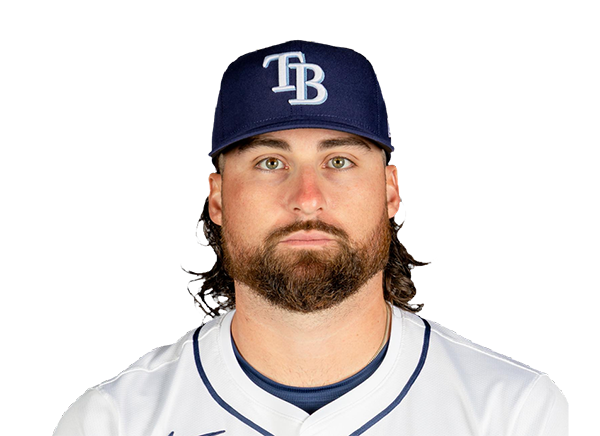 Ryan Vilade | 2-4 | 4 | 0 | 2 | 0 | 0 | 0 | 0 | 14 | .257 | .317 | .473 |
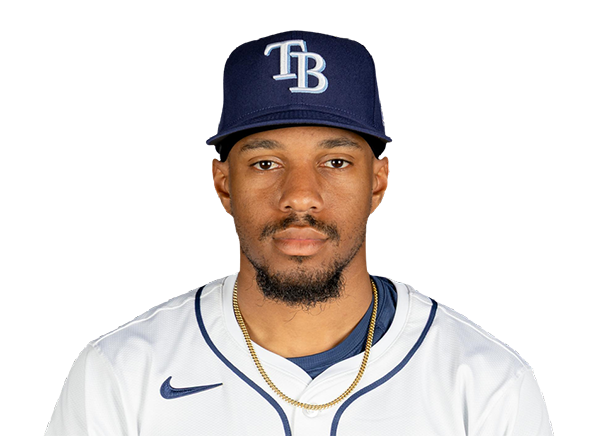 Chandler Simpson | 3-3 | 3 | 0 | 3 | 0 | 0 | 0 | 0 | 9 | .296 | .328 | .356 |
 Jonny DeLuca | 1-4 | 4 | 0 | 1 | 0 | 0 | 0 | 0 | 9 | .263 | .297 | .435 |
 Ben Williamson | 1-4 | 4 | 1 | 1 | 1 | 1 | 0 | 0 | 10 | .248 | .311 | .335 |
 Cedric Mullins | 0-4 | 4 | 0 | 0 | 0 | 0 | 0 | 2 | 21 | .201 | .276 | .355 |
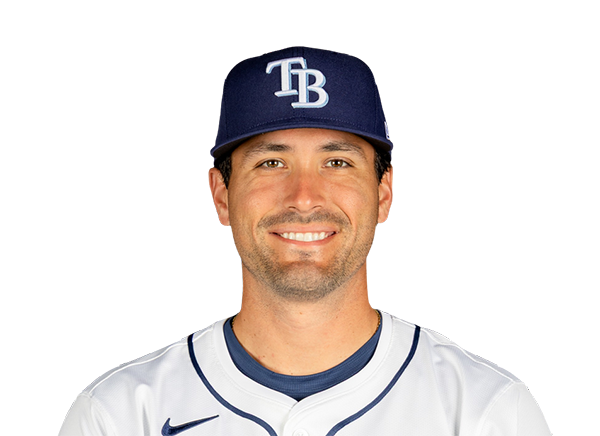 Nick Fortes | 1-3 | 3 | 0 | 1 | 0 | 0 | 1 | 0 | 15 | .278 | .319 | .386 |
Chicago White Sox
| Player | IP | H | R | ER | BB | K | HR | PC-ST | ERA | PC |
|---|---|---|---|---|---|---|---|---|---|---|
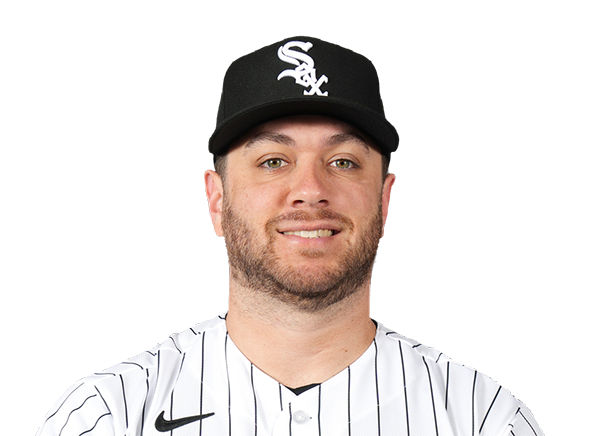 Anthony Kay | 6.1 | 7 | 0 | 0 | 1 | 3 | 0 | 89-60 | 4.01 | 89 |
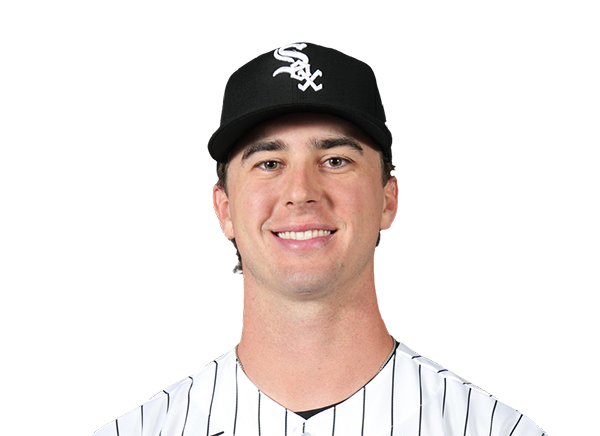 Grant Taylor | 1.2 | 2 | 0 | 0 | 0 | 1 | 0 | 22-16 | 2.40 | 22 |
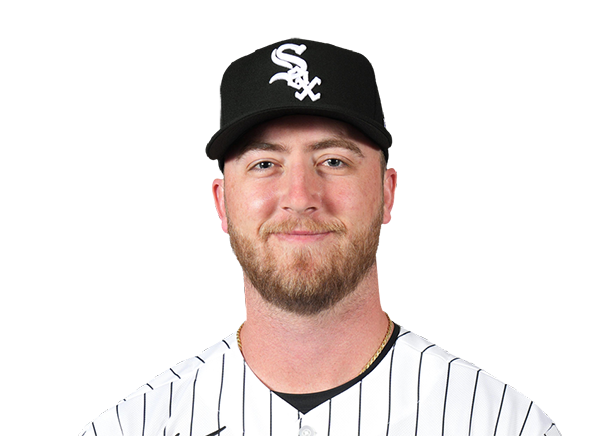 Duncan Davitt | 1.0 | 2 | 1 | 1 | 0 | 1 | 1 | 14-9 | 4.50 | 14 |
Tampa Bay Rays
| Player | IP | H | R | ER | BB | K | HR | PC-ST | ERA | PC |
|---|---|---|---|---|---|---|---|---|---|---|
 Griffin Jax | 5.0 | 4 | 3 | 1 | 0 | 8 | 1 | 82-59 | 3.63 | 82 |
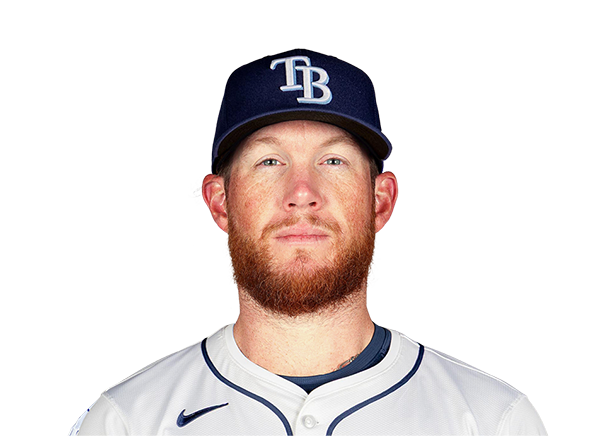 Craig Kimbrel | 1.0 | 1 | 2 | 2 | 2 | 1 | 0 | 22-12 | 4.81 | 22 |
 Steven Matz | 1.0 | 0 | 0 | 0 | 0 | 0 | 0 | 13-8 | 5.97 | 13 |
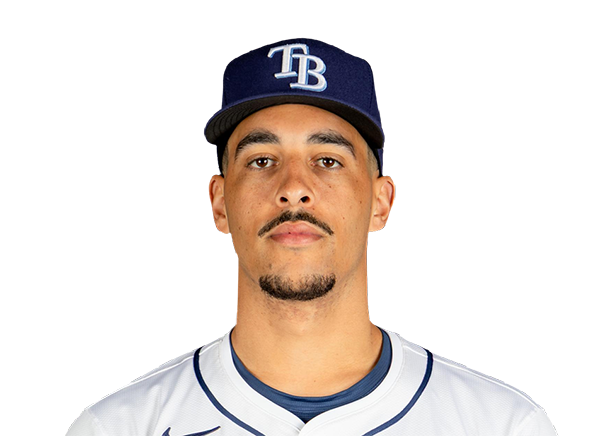 Alexander Cook | 1.2 | 3 | 3 | 3 | 0 | 2 | 1 | 34-22 | 7.36 | 34 |
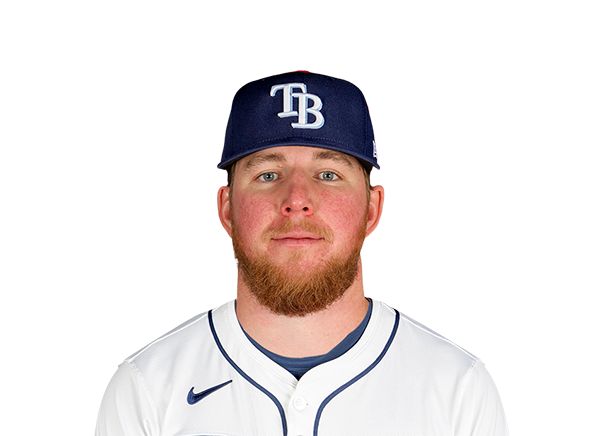 Chris Roycroft | 0.1 | 1 | 1 | 1 | 0 | 1 | 1 | 5-4 | 8.24 | 5 |
H2H / Season Series
TB1–9
CHW
TB1–0
CHW
TB1–6
CHW
CHW3–5
TB
CHW3–8
TB
CHW5–8
TB
Last 5 Games
| Date | Opponent | Result |
|---|---|---|
| Aug 22 |  vs NYM | L5–10 |
| Aug 21 | vs NYM | W6–4 |
| Aug 20 |  vs ATL | L0–2 |
| Aug 19 |  @ CHC | W3–0 |
| Aug 18 | @ CHC | L3–4 |
| Date | Opponent | Result |
|---|---|---|
| Aug 22 |  @ BAL | L2–3 |
| Aug 21 | @ BAL | L3–5 |
| Aug 20 |  vs TOR | L1–5 |
| Aug 19 | vs TOR | W7–6 |
| Aug 18 | vs TOR | L5–10 |
Standings
American League
| Team | W | L | PCT | GB | DIFF | STRK |
|---|---|---|---|---|---|---|
| 1Rays | 76 | 53 | .589 | - | +42 | L3 |
| 2White Sox | 67 | 62 | .519 | 9 | +42 | L1 |
3 Astros | 65 | 65 | .500 | 11.5 | -43 | L1 |
4 Yankees | 73 | 56 | .566 | 3 | +95 | L1 |
5 Red Sox | 70 | 59 | .543 | 6 | +98 | W2 |
6 Rangers | 64 | 66 | .492 | 12.5 | -48 | L1 |
7 Guardians | 64 | 66 | .492 | 12.5 | -14 | W3 |
| 8Blue Jays | 64 | 67 | .489 | 13 | -50 | W1 |
9 Twins | 63 | 67 | .485 | 13.5 | -47 | L2 |
| 10Orioles | 63 | 67 | .485 | 13.5 | -33 | W2 |
11 Mariners | 62 | 68 | .477 | 14.5 | -44 | W2 |
12 Tigers | 61 | 68 | .473 | 15 | +77 | L4 |
13 Royals | 57 | 74 | .435 | 20 | -95 | W7 |
14 Angels | 52 | 78 | .400 | 24.5 | -68 | W1 |
15 Athletics | 50 | 80 | .385 | 26.5 | -188 | W1 |
National League
| Team | W | L | PCT | GB | DIFF | STRK |
|---|---|---|---|---|---|---|
1 Brewers | 81 | 49 | .623 | - | +163 | W3 |
2 Dodgers | 79 | 51 | .608 | 2 | +147 | W5 |
| 3Braves | 75 | 55 | .577 | 6 | +108 | L2 |
| 4Cubs | 74 | 56 | .569 | 7 | +98 | L3 |
5 Phillies | 72 | 58 | .554 | 9 | +25 | W8 |
6 Padres | 70 | 60 | .538 | 11 | +9 | W2 |
7 Diamondbacks | 68 | 62 | .523 | 13 | +7 | L1 |
8 Marlins | 66 | 64 | .508 | 15 | +17 | W2 |
9 Cardinals | 66 | 65 | .504 | 15.5 | 0 | L2 |
10 Pirates | 63 | 68 | .481 | 18.5 | +29 | L2 |
11 Reds | 62 | 68 | .477 | 19 | -92 | W1 |
12 Nationals | 61 | 70 | .466 | 20.5 | +14 | L3 |
| 13Mets | 59 | 71 | .454 | 22 | -39 | W1 |
14 Giants | 52 | 77 | .403 | 28.5 | -79 | L3 |
15 Rockies | 50 | 79 | .388 | 30.5 | -131 | L5 |
CHW
VS
TB
Pitchers
Anthony Kay
Grant Taylor
Duncan Davitt
Catchers
Drew Romo
Infielders
Munetaka Murakami
Luisangel Acuna
Miguel Vargas
Colson Montgomery
Chase Meidroth
Outfielders
Sam Antonacci
Tristan Peters
Everson Pereira
Designated Hitters
Andrew Benintendi
Pitchers
Griffin Jax
Craig Kimbrel
Steven Matz
Alexander Cook
Chris Roycroft
Catchers
Nick Fortes
Infielders
Jonathan Aranda
Junior Caminero
Ryan Vilade
Ben Williamson
Outfielders
Chandler Simpson
Jonny DeLuca
Cedric Mullins
Designated Hitters
Yandy Diaz
Other Players
Richie Palacios
White Sox
VS
Rays
Batting
111
Team Games Played
111
3721
At Bats
3695
886
Hits
952
507
Runs Batted In
460
146
Home Runs
111
64
Stolen Bases
104
.238
Batting Average
.258
531
Runs
484
171
Doubles
160
11
Triples
17
1517
Total Bases
1479
372
Walks
362
1002
Strikeouts
800
.316
On Base Percentage
.328
.408
Slugging Percentage
.400
.723
OBP Pct + SLG Pct
.729
111
Games Played
111
111
Games Started
111
62
Hit By Pitch
42
0.0
Wins Above Replacement
0.0
0.0
Offensive Wins Above Replacement
0.0
29
Caught Stealing
37
1
Is Qualified
1
492.9
Runs Created
492.6
4.5
Runs Created Per 27 Outs
4.6
.088
Walks Per Plate Appearance
.087
0.37
Walk To Strikeout Ratio
0.45
.170
Isolated Power
.143
.279
Secondary Average
.259
3.85
Pitches Per Plate Appearance
3.80
328
Extra Base Hits
288
4208
Plate Appearances
4160
25.5
At Bats Per Home Run
33.3
24
Sacrifice Hit
29
27
Sacrifice Flies
29
Pitching
111
Team Games Played
111
28
Quality Starts
34
59
Wins
65
52
Losses
46
28
Saves
44
40
Holds
86
873
Hits
841
439
Earned runs
407
117
Home Runs
137
402
Walks
293
946
Strikeouts
904
8.6
Strikeouts Per 9 Innings
8.2
150.5
Pitches Per Start
139.2
1.29
Walks Plus Hits Per Inning Pitched
1.15
4.00
Earned Run Average
3.71
52
Losses
46
988.0
Innings pitched
987.0
.532
Win Percentage
.586
48
Save Opportunities
58
.236
Opponent Batting Average
.228
.320
Opponent's On-base pct.
.289
.385
Opponent's Slugging pct.
.390
.705
Opponent's OPB Pct + SLG Pct
.680
3694
At Bats
3691
164
Doubles
170
17
Triples
9
67
Batters Hit
40
90
Stolen Bases
96
111
Games Played
111
0
Complete Games
0
7
Shutouts
10
43
Wild Pitches
31
456
Runs Batted In
432
7
Balks
3
988.0
Innings pitched
987.0
8.6
Strikeouts Per 9 Innings
8.2
28
Caught Stealing
26
111
Games Started
111
0.0
Wins Above Replacement
0.0
1
Is Qualified
1
476
Runs
453
439
Earned Runs
407
1422
Total Bases
1440
Fielding
111
Team Games Played
111
988
Full Innings
987
3936
Total Chances
3901
2964
Putouts
2961
911
Assists
873
61
Errors
67
171
Double Plays
160
0.985
Fielding Percentage
0.983
35.3
Range Factor
35.0
0.0
Zone Rating
0.0
111
Games Played
111
0
Games Started
0
0.0
Defensive Wins Above Replacement
0.0
1
Qualified
1