

White Sox vs Red Sox Live Score (4 Aug, 2026)
Game Information
Stage
Standard
Season
2026
First Pitch
Tue, Aug 4, 7:10 pm
Venue
Fenway Park
Location
Boston, Massachusetts
Attendance
37,669
Live Situation
0Balls
0Strikes
0Outs
—Pitcher
—At Bat
Pitch Sequence
1
BALL IN PLAY
Sinker
95 MPH
Injury Report


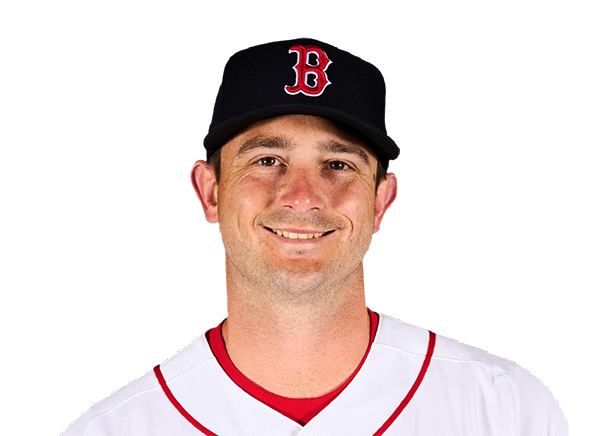
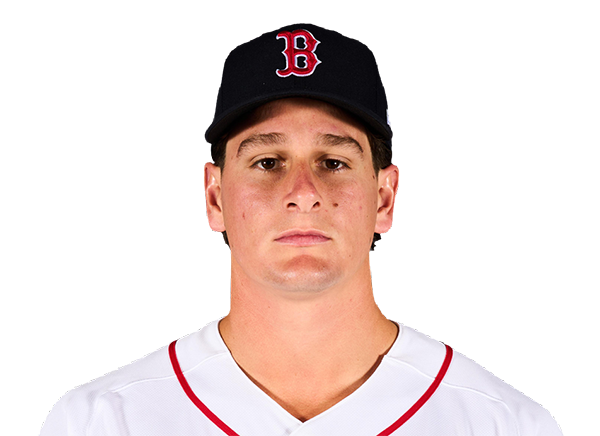
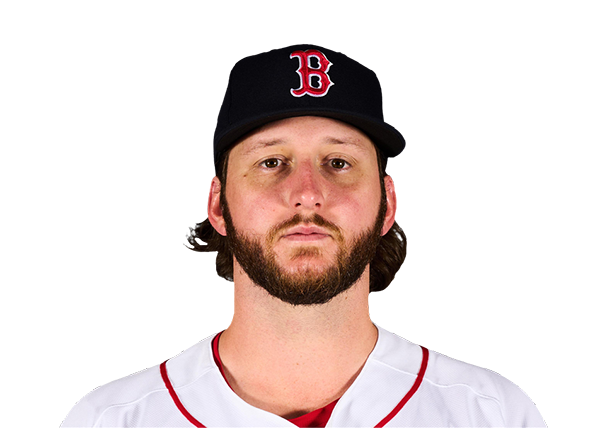
Team Stats
 CHW
BOS


2
Runs
14
6
Hits
15
1
Errors
0
0
Home Runs
4
5
Walks
3
8
Strikeouts
2
Player Box Score
Chicago White Sox
| Player | H-AB | AB | R | H | RBI | HR | BB | K | #P | AVG | OBP | SLG |
|---|---|---|---|---|---|---|---|---|---|---|---|---|
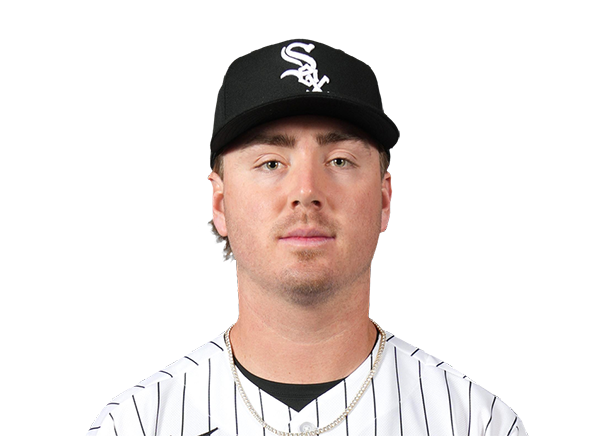 Chase Meidroth | 1-3 | 3 | 1 | 1 | 0 | 0 | 1 | 1 | 16 | .273 | .349 | .391 |
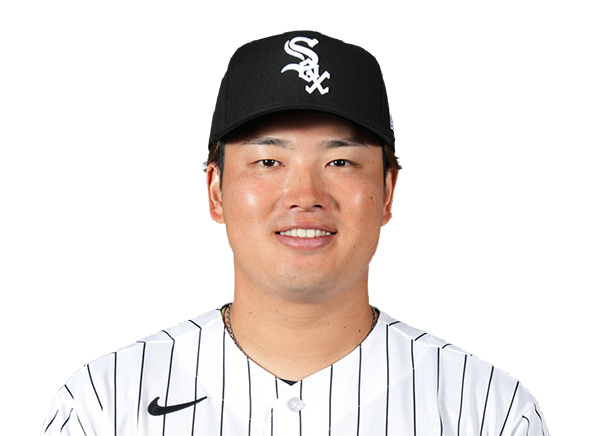 Munetaka Murakami | 1-4 | 4 | 0 | 1 | 0 | 0 | 0 | 3 | 14 | .244 | .376 | .542 |
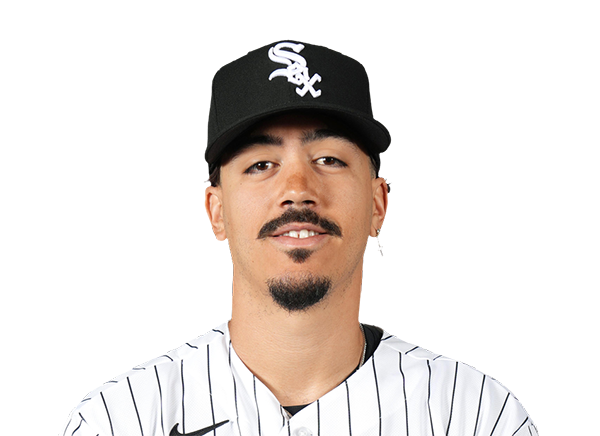 Miguel Vargas | 0-2 | 2 | 0 | 0 | 1 | 0 | 1 | 2 | 19 | .236 | .341 | .477 |
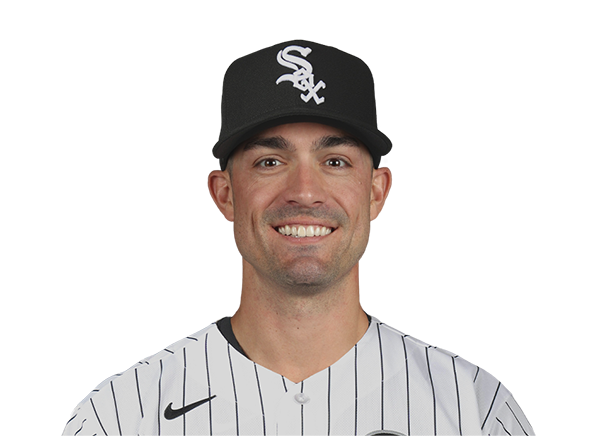 Randal Grichuk | 1-4 | 4 | 0 | 1 | 0 | 0 | 0 | 0 | 13 | .275 | .312 | .565 |
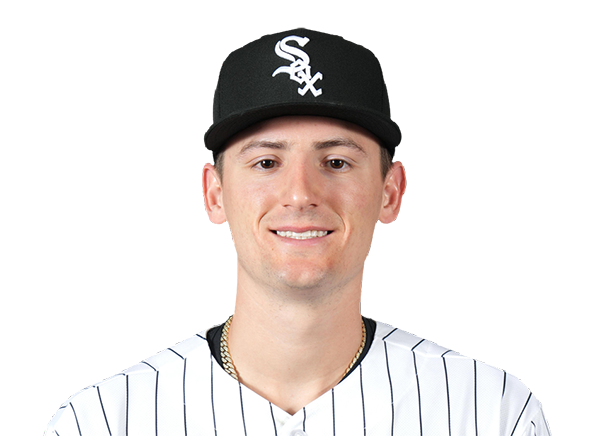 Colson Montgomery | 1-3 | 3 | 1 | 1 | 0 | 0 | 1 | 0 | 12 | .216 | .296 | .449 |
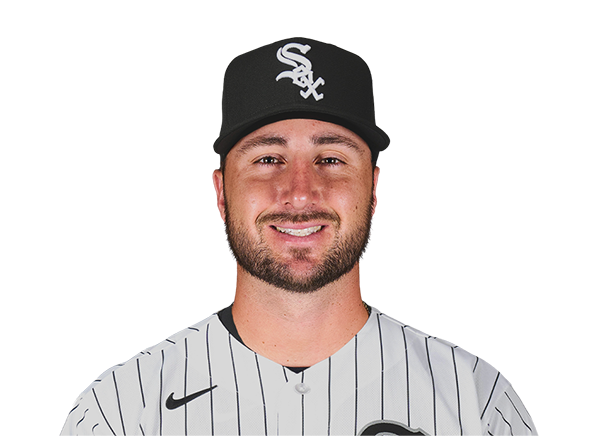 Joey Bart | 0-3 | 3 | 0 | 0 | 0 | 0 | 1 | 1 | 16 | .000 | .250 | .000 |
 Brenton Doyle | 1-2 | 2 | 0 | 1 | 0 | 0 | 0 | 0 | 9 | .500 | .500 | .500 |
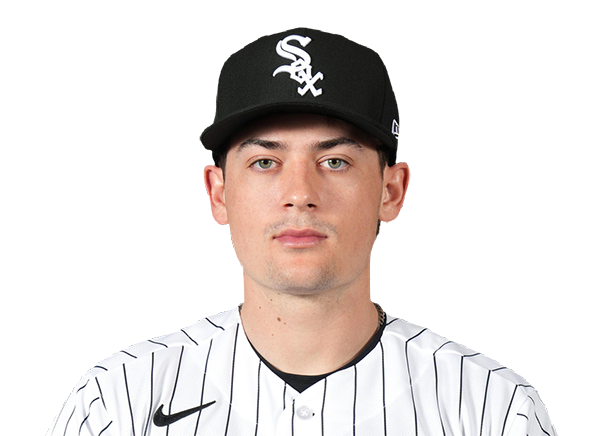 Sam Antonacci | 0-2 | 2 | 0 | 0 | 0 | 0 | 0 | 0 | 6 | .273 | .362 | .404 |
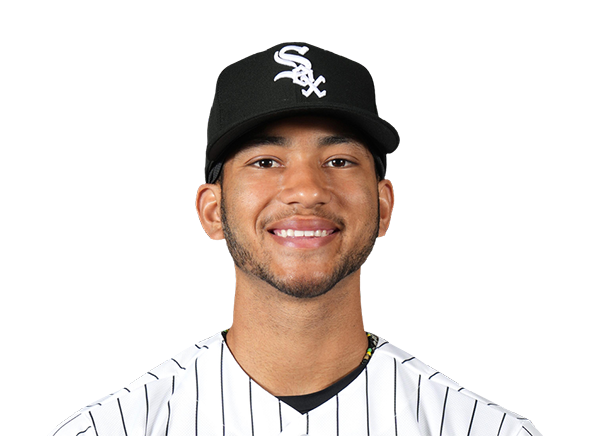 Braden Montgomery | 0-3 | 3 | 0 | 0 | 1 | 0 | 1 | 0 | 13 | .235 | .313 | .377 |
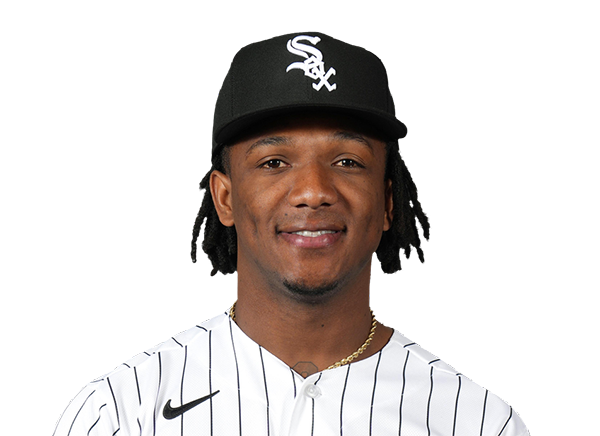 Luisangel Acuna | 1-2 | 2 | 0 | 1 | 0 | 0 | 0 | 0 | 12 | .244 | .275 | .280 |
 Tristan Peters | 0-2 | 2 | 0 | 0 | 0 | 0 | 0 | 1 | 5 | .265 | .323 | .414 |
Boston Red Sox
| Player | H-AB | AB | R | H | RBI | HR | BB | K | #P | AVG | OBP | SLG |
|---|---|---|---|---|---|---|---|---|---|---|---|---|
 Nick Sogard | 2-4 | 4 | 2 | 2 | 0 | 0 | 1 | 0 | 21 | .259 | .375 | .352 |
 Ceddanne Rafaela | 1-3 | 3 | 2 | 1 | 2 | 0 | 0 | 0 | 10 | .289 | .330 | .478 |
 Eli White | 0-1 | 1 | 0 | 0 | 0 | 0 | 0 | 0 | 1 | .000 | .000 | .000 |
 Wilyer Abreu | 2-4 | 4 | 2 | 2 | 2 | 2 | 1 | 0 | 13 | .251 | .324 | .452 |
 Willson Contreras | 2-4 | 4 | 2 | 2 | 2 | 0 | 0 | 1 | 13 | .286 | .393 | .539 |
 Anthony Seigler | 0-1 | 1 | 0 | 0 | 0 | 0 | 0 | 0 | 5 | .235 | .303 | .387 |
 Masataka Yoshida | 2-4 | 4 | 1 | 2 | 1 | 0 | 0 | 0 | 14 | .268 | .344 | .394 |
 Caleb Durbin | 2-3 | 3 | 2 | 2 | 4 | 1 | 1 | 0 | 14 | .247 | .318 | .405 |
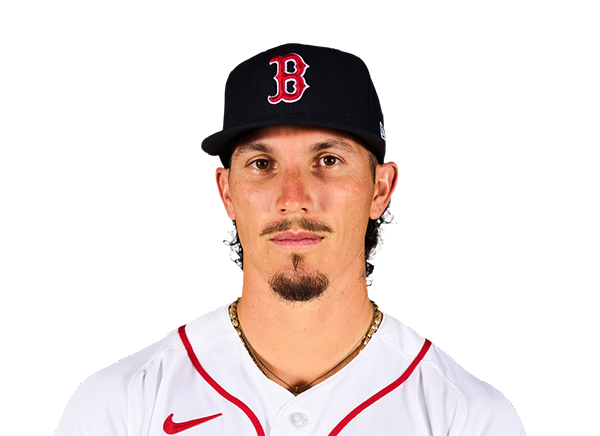 Jarren Duran | 2-4 | 4 | 2 | 2 | 1 | 1 | 0 | 1 | 17 | .203 | .259 | .354 |
 Andruw Monasterio | 2-4 | 4 | 1 | 2 | 2 | 0 | 0 | 0 | 17 | .263 | .321 | .454 |
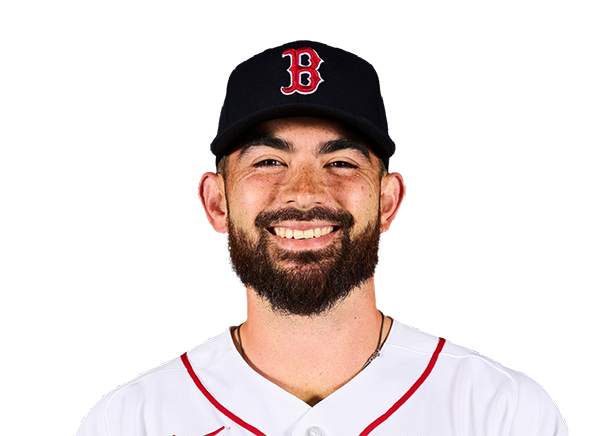 Connor Wong | 0-4 | 4 | 0 | 0 | 0 | 0 | 0 | 0 | 16 | .248 | .337 | .352 |
Chicago White Sox
| Player | IP | H | R | ER | BB | K | HR | PC-ST | ERA | PC |
|---|---|---|---|---|---|---|---|---|---|---|
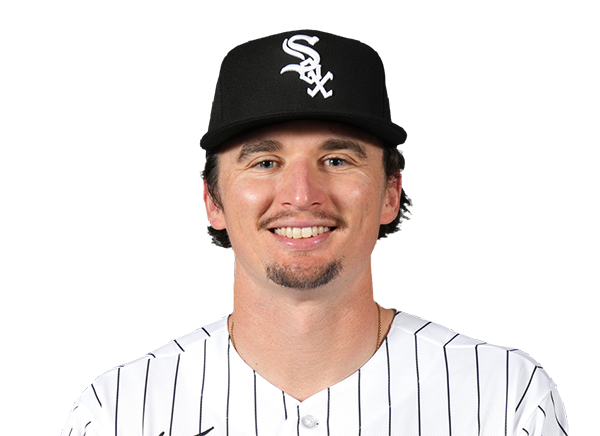 Davis Martin | 5.0 | 10 | 9 | 9 | 2 | 1 | 3 | 91-59 | 4.13 | 91 |
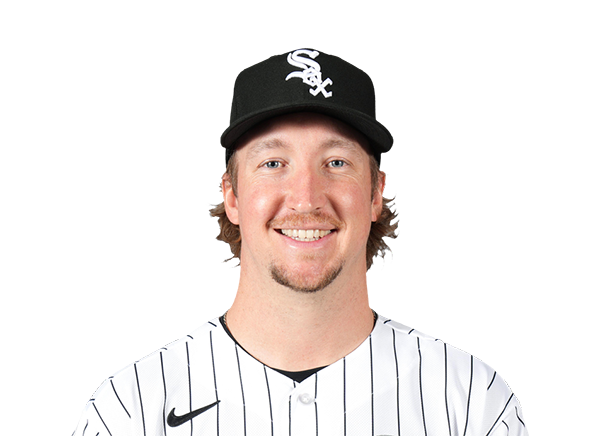 Erick Fedde | 3.0 | 5 | 5 | 4 | 1 | 1 | 1 | 50-34 | 4.36 | 50 |
Boston Red Sox
| Player | IP | H | R | ER | BB | K | HR | PC-ST | ERA | PC |
|---|---|---|---|---|---|---|---|---|---|---|
 Patrick Sandoval | 5.0 | 6 | 2 | 2 | 4 | 5 | 0 | 89-50 | 3.38 | 89 |
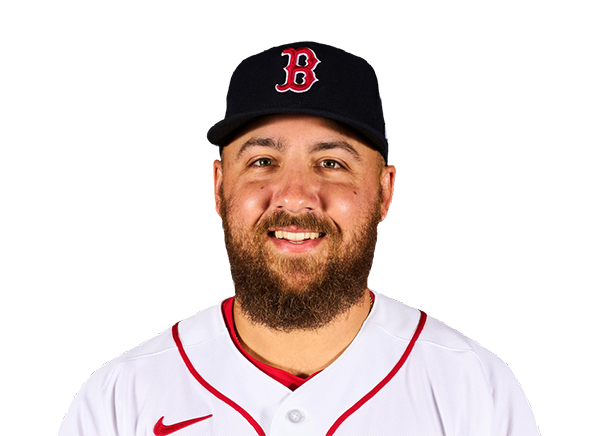 Greg Weissert | 0.2 | 0 | 0 | 0 | 1 | 0 | 0 | 14-8 | 3.86 | 14 |
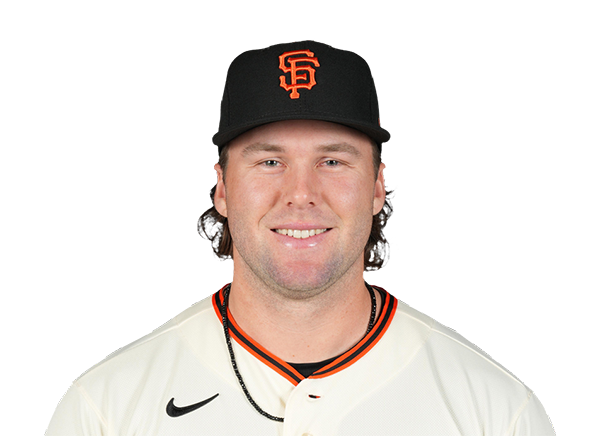 Erik Miller | 0.1 | 0 | 0 | 0 | 0 | 1 | 0 | 4-3 | 2.73 | 4 |
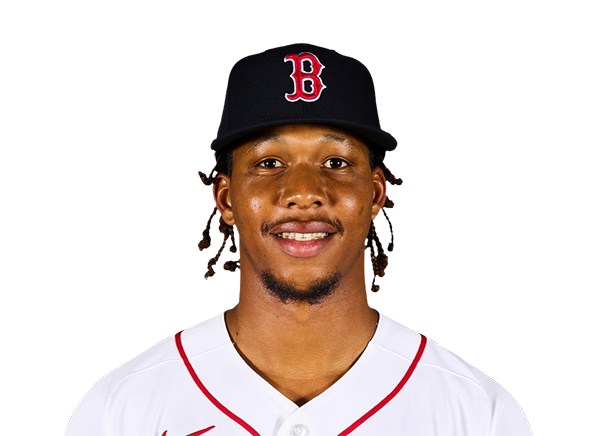 Brayan Bello | 3.0 | 0 | 0 | 0 | 0 | 2 | 0 | 28-19 | 5.10 | 28 |
H2H / Season Series
BOS12–11
CHW
BOS4–0
CHW
BOS14–2
CHW
CHW1–2
BOS
CHW0–5
BOS
CHW1–8
BOS
Last 5 Games
| Date | Opponent | Result |
|---|---|---|
| Aug 21 |  vs NYM | W6–4 |
| Aug 20 |  vs ATL | L0–2 |
| Aug 19 |  @ CHC | W3–0 |
| Aug 18 | @ CHC | L3–4 |
| Aug 17 | @ CHC | L5–7 |
| Date | Opponent | Result |
|---|---|---|
| Aug 21 |  vs SF | W6–4 |
| Aug 19 |  vs ARI | L6–7 |
| Aug 18 | vs ARI | W9–4 |
| Aug 17 | vs ARI | W11–1 |
| Aug 16 |  @ PIT | L3–8 |
Standings
American League
| Team | W | L | PCT | GB | DIFF | STRK |
|---|---|---|---|---|---|---|
1 Rays | 76 | 52 | .594 | - | +43 | L2 |
| 2White Sox | 67 | 61 | .523 | 9 | +47 | W1 |
3 Astros | 65 | 64 | .504 | 11.5 | -42 | W1 |
4 Yankees | 73 | 56 | .566 | 3.5 | +95 | L1 |
| 5Red Sox | 69 | 59 | .539 | 7 | +97 | W1 |
6 Rangers | 64 | 65 | .496 | 12.5 | -45 | W2 |
7 Blue Jays | 64 | 67 | .489 | 13.5 | -50 | W1 |
8 Twins | 63 | 66 | .488 | 13.5 | -45 | L1 |
9 Guardians | 63 | 66 | .488 | 13.5 | -15 | W2 |
10 Orioles | 62 | 67 | .481 | 14.5 | -34 | W1 |
11 Tigers | 61 | 67 | .477 | 15 | +79 | L3 |
12 Mariners | 61 | 68 | .473 | 15.5 | -45 | W1 |
13 Royals | 56 | 74 | .431 | 21 | -97 | W6 |
14 Angels | 51 | 78 | .395 | 25.5 | -71 | L1 |
15 Athletics | 49 | 80 | .380 | 27.5 | -189 | L5 |
National League
| Team | W | L | PCT | GB | DIFF | STRK |
|---|---|---|---|---|---|---|
1 Brewers | 81 | 49 | .623 | - | +163 | W3 |
2 Dodgers | 78 | 51 | .605 | 2.5 | +146 | W4 |
| 3Braves | 75 | 55 | .577 | 6 | +108 | L2 |
| 4Cubs | 74 | 55 | .574 | 6.5 | +99 | L2 |
5 Phillies | 72 | 58 | .554 | 9 | +25 | W8 |
6 Padres | 69 | 60 | .535 | 11.5 | +7 | W1 |
| 7Diamondbacks | 68 | 61 | .527 | 12.5 | +13 | W2 |
8 Marlins | 66 | 64 | .508 | 15 | +17 | W2 |
9 Cardinals | 66 | 65 | .504 | 15.5 | 0 | L2 |
| 10Pirates | 63 | 67 | .485 | 18 | +30 | L1 |
11 Reds | 61 | 68 | .473 | 19.5 | -98 | L2 |
12 Nationals | 61 | 70 | .466 | 20.5 | +14 | L3 |
| 13Mets | 58 | 71 | .450 | 22.5 | -44 | L1 |
| 14Giants | 52 | 76 | .406 | 28 | -78 | L2 |
15 Rockies | 50 | 78 | .391 | 30 | -130 | L4 |
CHW
VS
BOS
Pitchers
Davis Martin
Catchers
Joey Bart
Infielders
Chase Meidroth
Munetaka Murakami
Miguel Vargas
Luisangel Acuna
Outfielders
Randal Grichuk
Brenton Doyle
Braden Montgomery
Designated Hitters
Colson Montgomery
Pitchers
Patrick Sandoval
Catchers
Connor Wong
Infielders
Nick Sogard
Willson Contreras
Caleb Durbin
Andruw Monasterio
Outfielders
Ceddanne Rafaela
Wilyer Abreu
Jarren Duran
Designated Hitters
Masataka Yoshida
White Sox
VS
Red Sox
Batting
112
Team Games Played
112
3751
At Bats
3736
892
Hits
918
509
Runs Batted In
466
146
Home Runs
115
64
Stolen Bases
83
.238
Batting Average
.246
533
Runs
488
172
Doubles
195
11
Triples
18
1524
Total Bases
1494
377
Walks
339
1010
Strikeouts
918
.316
On Base Percentage
.317
.406
Slugging Percentage
.400
.722
OBP Pct + SLG Pct
.717
112
Games Played
112
112
Games Started
112
62
Hit By Pitch
67
0.0
Wins Above Replacement
0.0
0.0
Offensive Wins Above Replacement
0.0
29
Caught Stealing
30
1
Is Qualified
1
495.1
Runs Created
482.0
4.5
Runs Created Per 27 Outs
4.4
.089
Walks Per Plate Appearance
.081
0.37
Walk To Strikeout Ratio
0.37
.168
Isolated Power
.154
.278
Secondary Average
.259
3.85
Pitches Per Plate Appearance
3.81
329
Extra Base Hits
328
4244
Plate Appearances
4200
25.7
At Bats Per Home Run
32.5
24
Sacrifice Hit
25
28
Sacrifice Flies
31
Pitching
112
Team Games Played
112
28
Quality Starts
46
59
Wins
61
53
Losses
51
28
Saves
33
40
Holds
71
888
Hits
904
452
Earned runs
389
121
Home Runs
111
405
Walks
316
948
Strikeouts
951
8.6
Strikeouts Per 9 Innings
8.6
150.5
Pitches Per Start
139.4
1.30
Walks Plus Hits Per Inning Pitched
1.23
4.08
Earned Run Average
3.52
53
Losses
51
996.0
Innings pitched
994.1
.527
Win Percentage
.545
48
Save Opportunities
43
.238
Opponent Batting Average
.241
.322
Opponent's On-base pct.
.305
.389
Opponent's Slugging pct.
.379
.711
Opponent's OPB Pct + SLG Pct
.684
3730
At Bats
3756
167
Doubles
174
17
Triples
7
68
Batters Hit
41
92
Stolen Bases
72
112
Games Played
112
0
Complete Games
0
7
Shutouts
10
43
Wild Pitches
23
470
Runs Batted In
402
7
Balks
2
996.0
Innings pitched
994.1
8.6
Strikeouts Per 9 Innings
8.6
28
Caught Stealing
15
112
Games Started
112
0.0
Wins Above Replacement
0.0
1
Is Qualified
1
490
Runs
416
452
Earned Runs
389
1452
Total Bases
1425
Fielding
112
Team Games Played
112
996
Full Innings
994
3973
Total Chances
4007
2988
Putouts
2983
923
Assists
972
62
Errors
52
172
Double Plays
195
0.984
Fielding Percentage
0.987
35.3
Range Factor
35.8
0.0
Zone Rating
0.0
112
Games Played
112
0
Games Started
0
0.0
Defensive Wins Above Replacement
0.0
1
Qualified
1