

White Sox vs Red Sox Live Score (5 Aug, 2026)
Game Information
Stage
Standard
Season
2026
First Pitch
Wed, Aug 5, 7:10 pm
Venue
Fenway Park
Location
Boston, Massachusetts
Attendance
37,517
Live Situation
1Balls
3Strikes
0Outs
—Pitcher
—At Bat
Pitch Sequence
1
STRIKE LOOKING
Four-seam FB
95 MPH
2
BALL
Four-seam FB
95 MPH
3
STRIKE SWINGING
Changeup
85 MPH
4
STRIKE SWINGING
Changeup
85 MPH
Injury Report

Team Stats
 CHW
BOS


0
Runs
4
4
Hits
7
1
Errors
1
0
Home Runs
1
3
Walks
4
14
Strikeouts
8
Player Box Score
Chicago White Sox
| Player | H-AB | AB | R | H | RBI | HR | BB | K | #P | AVG | OBP | SLG |
|---|---|---|---|---|---|---|---|---|---|---|---|---|
 Sam Antonacci | 1-3 | 3 | 0 | 1 | 0 | 0 | 0 | 0 | 9 | .273 | .363 | .404 |
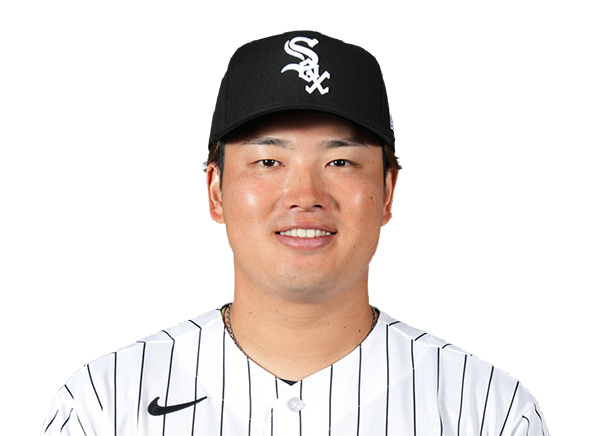 Munetaka Murakami | 0-3 | 3 | 0 | 0 | 0 | 0 | 1 | 1 | 14 | .241 | .375 | .536 |
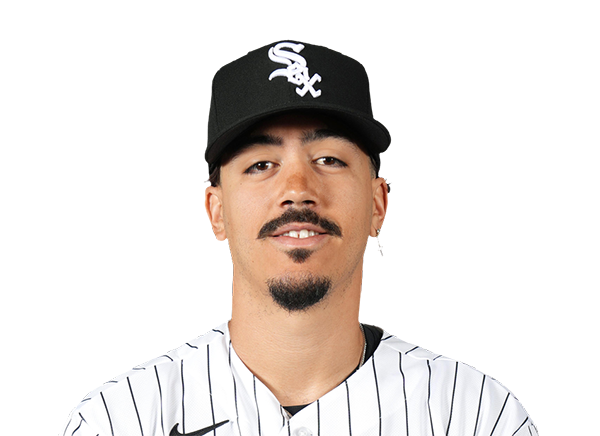 Miguel Vargas | 2-3 | 3 | 0 | 2 | 0 | 0 | 1 | 1 | 14 | .239 | .344 | .478 |
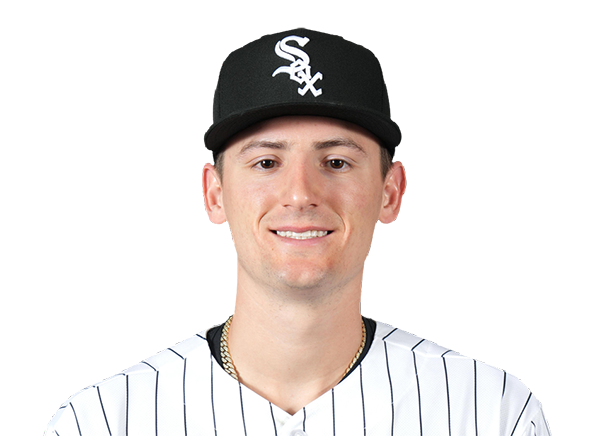 Colson Montgomery | 0-3 | 3 | 0 | 0 | 0 | 0 | 1 | 2 | 21 | .214 | .296 | .445 |
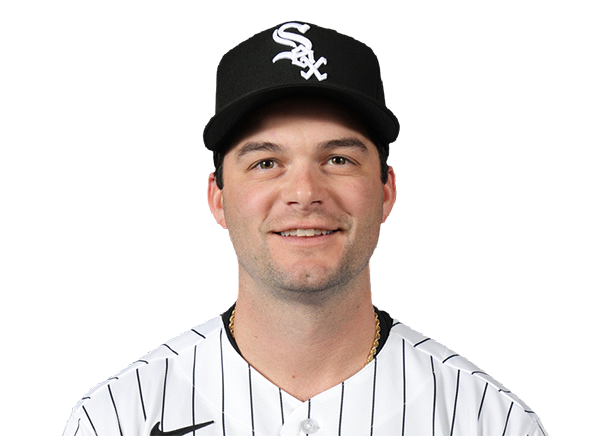 Andrew Benintendi | 1-3 | 3 | 0 | 1 | 0 | 0 | 0 | 1 | 10 | .247 | .308 | .435 |
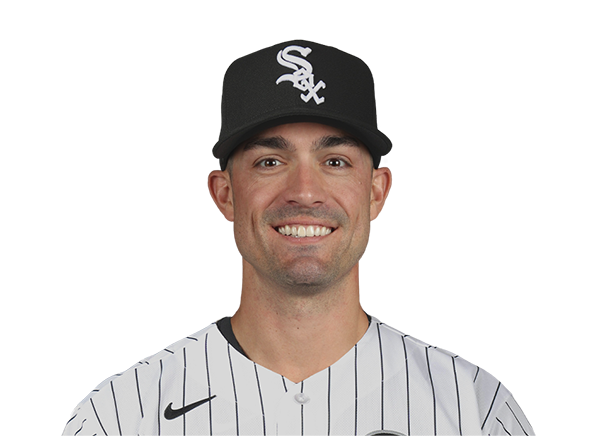 Randal Grichuk | 0-1 | 1 | 0 | 0 | 0 | 0 | 0 | 1 | 4 | .273 | .309 | .561 |
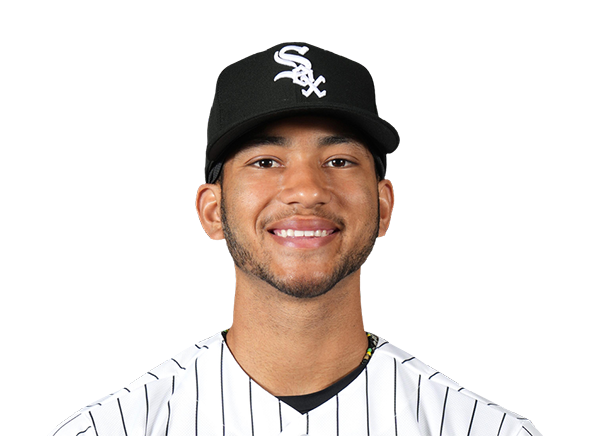 Braden Montgomery | 0-4 | 4 | 0 | 0 | 0 | 0 | 0 | 3 | 11 | .229 | .306 | .367 |
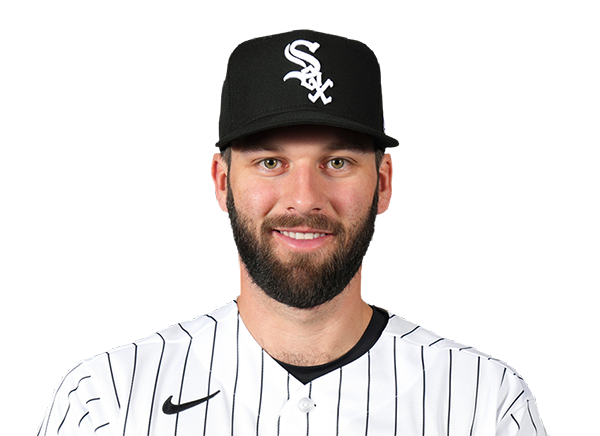 Tristan Peters | 0-3 | 3 | 0 | 0 | 0 | 0 | 0 | 1 | 10 | .262 | .320 | .410 |
 Brenton Doyle | 0-1 | 1 | 0 | 0 | 0 | 0 | 0 | 1 | 4 | .333 | .333 | .333 |
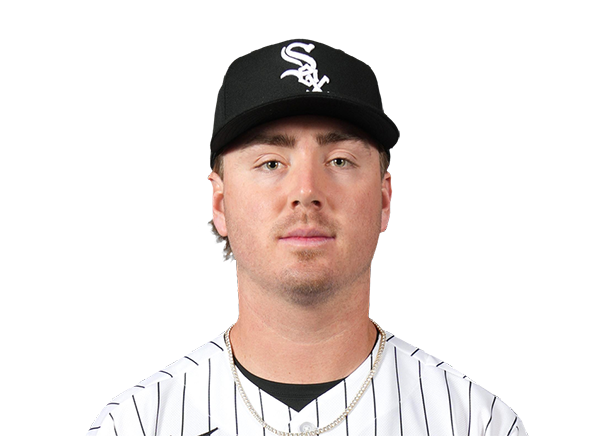 Chase Meidroth | 0-3 | 3 | 0 | 0 | 0 | 0 | 0 | 2 | 11 | .271 | .347 | .388 |
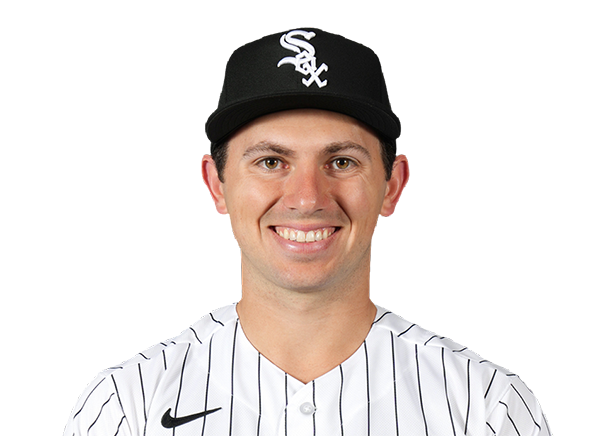 Drew Romo | 0-2 | 2 | 0 | 0 | 0 | 0 | 0 | 0 | 5 | .132 | .217 | .279 |
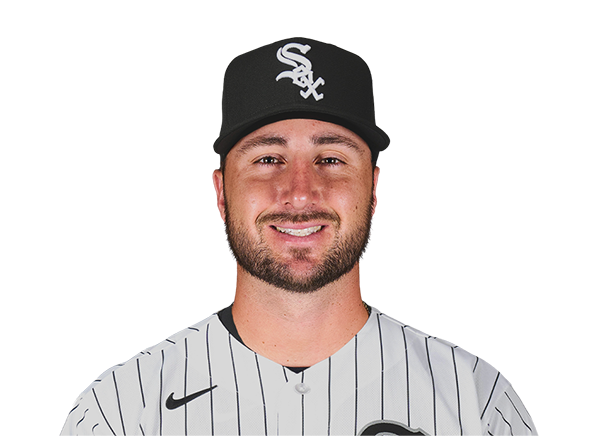 Joey Bart | 0-1 | 1 | 0 | 0 | 0 | 0 | 0 | 1 | 3 | .000 | .200 | .000 |
Boston Red Sox
| Player | H-AB | AB | R | H | RBI | HR | BB | K | #P | AVG | OBP | SLG |
|---|---|---|---|---|---|---|---|---|---|---|---|---|
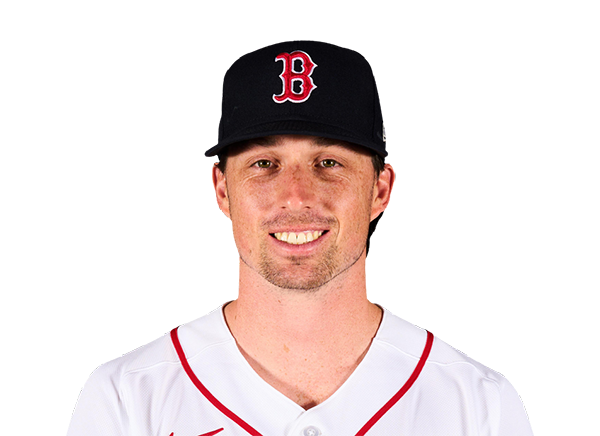 Nick Sogard | 0-3 | 3 | 0 | 0 | 0 | 0 | 1 | 2 | 17 | .246 | .368 | .333 |
 Ceddanne Rafaela | 0-3 | 3 | 0 | 0 | 0 | 0 | 1 | 1 | 25 | .287 | .329 | .475 |
 Wilyer Abreu | 2-3 | 3 | 3 | 2 | 1 | 1 | 1 | 0 | 23 | .254 | .327 | .460 |
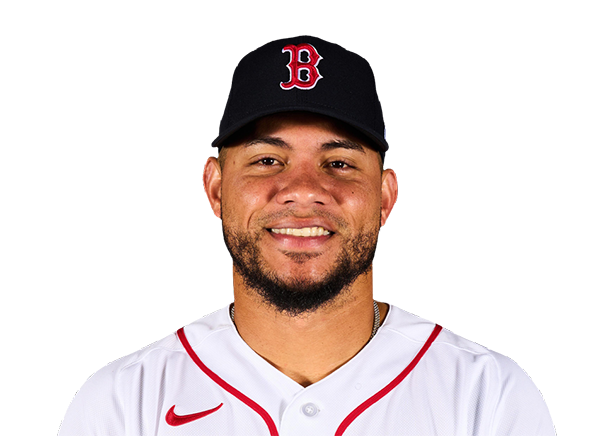 Willson Contreras | 1-1 | 1 | 0 | 1 | 1 | 0 | 1 | 0 | 11 | .288 | .395 | .540 |
 Anthony Seigler | 0-2 | 2 | 0 | 0 | 0 | 0 | 0 | 2 | 10 | .231 | .299 | .380 |
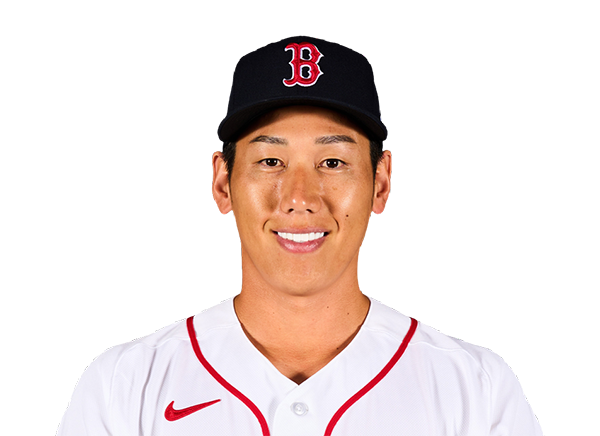 Masataka Yoshida | 0-3 | 3 | 0 | 0 | 0 | 0 | 0 | 0 | 8 | .265 | .340 | .389 |
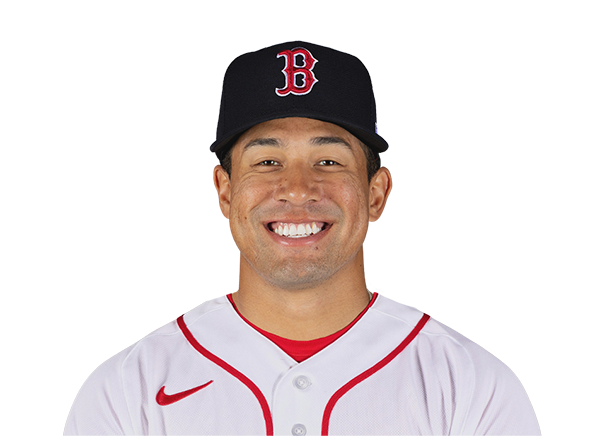 Jahmai Jones | 0-1 | 1 | 0 | 0 | 0 | 0 | 0 | 1 | 7 | .357 | .438 | .929 |
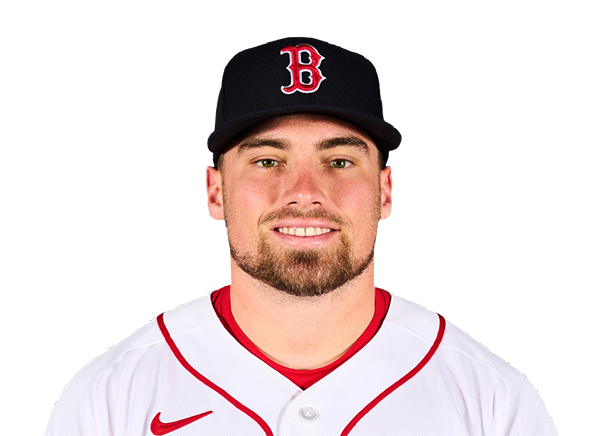 Caleb Durbin | 1-4 | 4 | 0 | 1 | 1 | 0 | 0 | 0 | 13 | .247 | .317 | .403 |
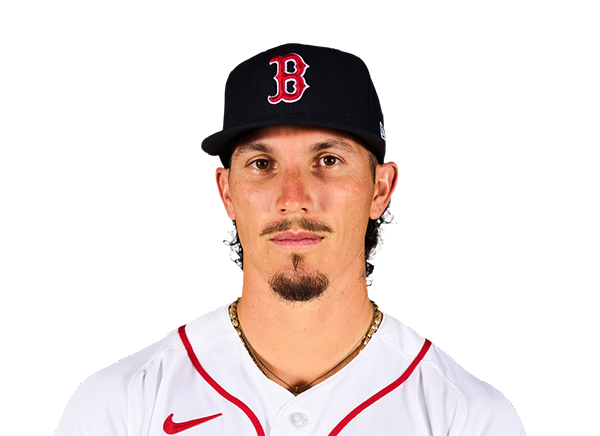 Jarren Duran | 2-3 | 3 | 1 | 2 | 0 | 0 | 0 | 0 | 10 | .206 | .262 | .359 |
 Andruw Monasterio | 1-2 | 2 | 0 | 1 | 1 | 0 | 0 | 0 | 17 | .266 | .322 | .454 |
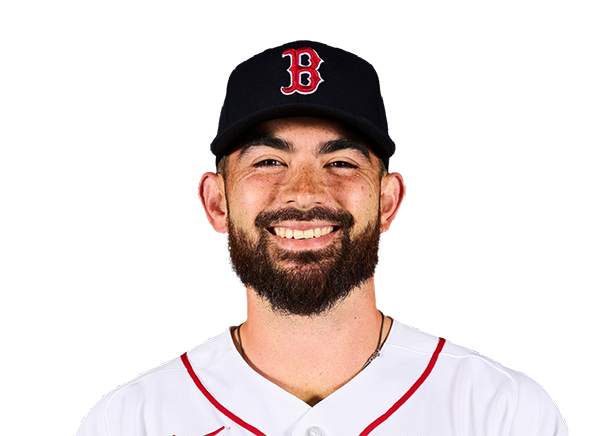 Connor Wong | 0-3 | 3 | 0 | 0 | 0 | 0 | 0 | 2 | 14 | .243 | .331 | .345 |
Chicago White Sox
| Player | IP | H | R | ER | BB | K | HR | PC-ST | ERA | PC |
|---|---|---|---|---|---|---|---|---|---|---|
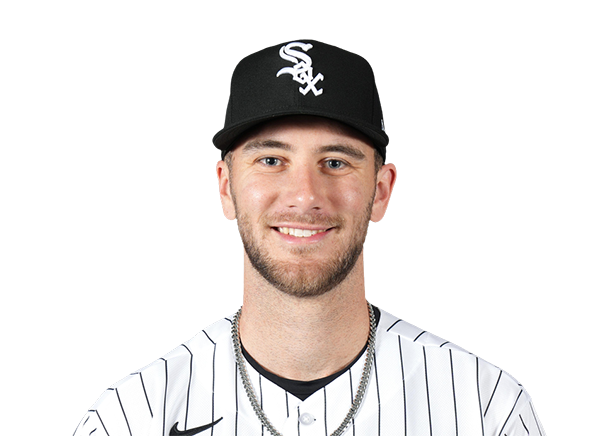 Sean Burke | 4.1 | 5 | 2 | 2 | 2 | 4 | 1 | 91-56 | 3.08 | 91 |
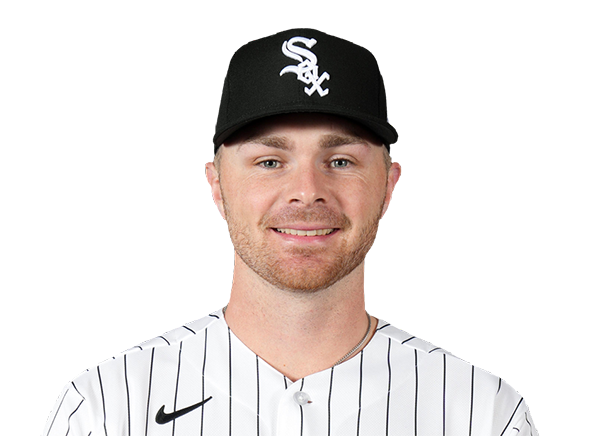 Sean Newcomb | 1.2 | 1 | 1 | 0 | 0 | 1 | 0 | 18-13 | 2.79 | 18 |
 Huascar Brazoban | 1.0 | 0 | 0 | 0 | 1 | 1 | 0 | 19-11 | 2.52 | 19 |
 Chris Murphy | 1.0 | 1 | 1 | 1 | 1 | 2 | 0 | 27-17 | 4.40 | 27 |
Boston Red Sox
| Player | IP | H | R | ER | BB | K | HR | PC-ST | ERA | PC |
|---|---|---|---|---|---|---|---|---|---|---|
 Sonny Gray | 6.0 | 3 | 0 | 0 | 2 | 8 | 0 | 83-53 | 2.78 | 83 |
 Tyron Guerrero | 1.0 | 0 | 0 | 0 | 0 | 1 | 0 | 7-6 | 2.25 | 7 |
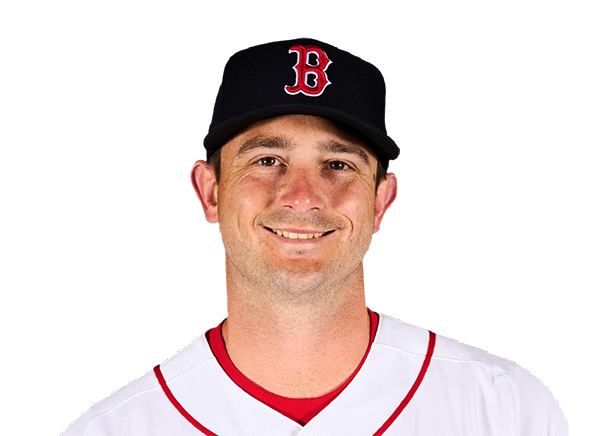 Garrett Whitlock | 1.0 | 1 | 0 | 0 | 0 | 2 | 0 | 11-10 | 1.93 | 11 |
 Jovani Moran | 1.0 | 0 | 0 | 0 | 1 | 3 | 0 | 15-9 | 2.74 | 15 |
H2H / Season Series
BOS12–11
CHW
BOS4–0
CHW
BOS14–2
CHW
CHW1–2
BOS
CHW0–5
BOS
CHW1–8
BOS
Last 5 Games
| Date | Opponent | Result |
|---|---|---|
| Aug 21 |  vs NYM | W6–4 |
| Aug 20 |  vs ATL | L0–2 |
| Aug 19 |  @ CHC | W3–0 |
| Aug 18 | @ CHC | L3–4 |
| Aug 17 | @ CHC | L5–7 |
| Date | Opponent | Result |
|---|---|---|
| Aug 21 |  vs SF | W6–4 |
| Aug 19 |  vs ARI | L6–7 |
| Aug 18 | vs ARI | W9–4 |
| Aug 17 | vs ARI | W11–1 |
| Aug 16 |  @ PIT | L3–8 |
Standings
American League
| Team | W | L | PCT | GB | DIFF | STRK |
|---|---|---|---|---|---|---|
1 Rays | 76 | 52 | .594 | - | +43 | L2 |
| 2White Sox | 67 | 61 | .523 | 9 | +47 | W1 |
3 Astros | 65 | 64 | .504 | 11.5 | -42 | W1 |
4 Yankees | 73 | 56 | .566 | 3.5 | +95 | L1 |
| 5Red Sox | 69 | 59 | .539 | 7 | +97 | W1 |
6 Rangers | 64 | 65 | .496 | 12.5 | -45 | W2 |
7 Blue Jays | 64 | 67 | .489 | 13.5 | -50 | W1 |
8 Twins | 63 | 66 | .488 | 13.5 | -45 | L1 |
9 Guardians | 63 | 66 | .488 | 13.5 | -15 | W2 |
10 Orioles | 62 | 67 | .481 | 14.5 | -34 | W1 |
11 Tigers | 61 | 67 | .477 | 15 | +79 | L3 |
12 Mariners | 61 | 68 | .473 | 15.5 | -45 | W1 |
13 Royals | 56 | 74 | .431 | 21 | -97 | W6 |
14 Angels | 51 | 78 | .395 | 25.5 | -71 | L1 |
15 Athletics | 49 | 80 | .380 | 27.5 | -189 | L5 |
National League
| Team | W | L | PCT | GB | DIFF | STRK |
|---|---|---|---|---|---|---|
1 Brewers | 81 | 49 | .623 | - | +163 | W3 |
2 Dodgers | 78 | 51 | .605 | 2.5 | +146 | W4 |
| 3Braves | 75 | 55 | .577 | 6 | +108 | L2 |
| 4Cubs | 74 | 55 | .574 | 6.5 | +99 | L2 |
5 Phillies | 71 | 58 | .550 | 9.5 | +16 | W7 |
6 Padres | 69 | 60 | .535 | 11.5 | +7 | W1 |
| 7Diamondbacks | 68 | 61 | .527 | 12.5 | +13 | W2 |
8 Marlins | 66 | 64 | .508 | 15 | +17 | W2 |
9 Cardinals | 66 | 64 | .508 | 15 | +9 | L1 |
| 10Pirates | 63 | 67 | .485 | 18 | +30 | L1 |
11 Reds | 61 | 68 | .473 | 19.5 | -98 | L2 |
12 Nationals | 61 | 70 | .466 | 20.5 | +14 | L3 |
| 13Mets | 58 | 71 | .450 | 22.5 | -44 | L1 |
| 14Giants | 52 | 76 | .406 | 28 | -78 | L2 |
15 Rockies | 50 | 78 | .391 | 30 | -130 | L4 |
CHW
VS
BOS
Pitchers
Sean Burke
Catchers
Drew Romo
Infielders
Munetaka Murakami
Miguel Vargas
Colson Montgomery
Chase Meidroth
Outfielders
Sam Antonacci
Braden Montgomery
Tristan Peters
Designated Hitters
Andrew Benintendi
Pitchers
Sonny Gray
Catchers
Connor Wong
Infielders
Nick Sogard
Willson Contreras
Caleb Durbin
Andruw Monasterio
Outfielders
Ceddanne Rafaela
Wilyer Abreu
Jarren Duran
Designated Hitters
Masataka Yoshida
White Sox
VS
Red Sox
Batting
113
Team Games Played
113
3781
At Bats
3764
896
Hits
925
509
Runs Batted In
470
146
Home Runs
116
64
Stolen Bases
86
.237
Batting Average
.246
533
Runs
492
173
Doubles
196
11
Triples
18
1529
Total Bases
1505
380
Walks
343
1024
Strikeouts
926
.315
On Base Percentage
.317
.404
Slugging Percentage
.400
.719
OBP Pct + SLG Pct
.717
113
Games Played
113
113
Games Started
113
63
Hit By Pitch
67
0.0
Wins Above Replacement
0.0
0.0
Offensive Wins Above Replacement
0.0
29
Caught Stealing
31
1
Is Qualified
1
495.6
Runs Created
486.3
4.4
Runs Created Per 27 Outs
4.4
.089
Walks Per Plate Appearance
.081
0.37
Walk To Strikeout Ratio
0.37
.167
Isolated Power
.154
.277
Secondary Average
.260
3.84
Pitches Per Plate Appearance
3.82
330
Extra Base Hits
330
4278
Plate Appearances
4233
25.9
At Bats Per Home Run
32.4
24
Sacrifice Hit
25
28
Sacrifice Flies
32
Pitching
113
Team Games Played
113
28
Quality Starts
47
59
Wins
62
54
Losses
51
28
Saves
33
40
Holds
73
895
Hits
908
455
Earned runs
389
122
Home Runs
111
409
Walks
319
956
Strikeouts
965
8.6
Strikeouts Per 9 Innings
8.7
150.5
Pitches Per Start
139.2
1.30
Walks Plus Hits Per Inning Pitched
1.22
4.08
Earned Run Average
3.49
54
Losses
51
1004.0
Innings pitched
1003.1
.522
Win Percentage
.549
48
Save Opportunities
43
.238
Opponent Batting Average
.240
.322
Opponent's On-base pct.
.304
.389
Opponent's Slugging pct.
.378
.711
Opponent's OPB Pct + SLG Pct
.682
3758
At Bats
3786
168
Doubles
175
17
Triples
7
68
Batters Hit
42
95
Stolen Bases
72
113
Games Played
113
0
Complete Games
0
7
Shutouts
11
45
Wild Pitches
23
474
Runs Batted In
402
8
Balks
2
1004.0
Innings pitched
1003.1
8.6
Strikeouts Per 9 Innings
8.7
29
Caught Stealing
15
113
Games Started
113
0.0
Wins Above Replacement
0.0
1
Is Qualified
1
494
Runs
416
455
Earned Runs
389
1463
Total Bases
1430
Fielding
113
Team Games Played
113
1004
Full Innings
1003
4002
Total Chances
4043
3012
Putouts
3010
927
Assists
980
63
Errors
53
173
Double Plays
196
0.984
Fielding Percentage
0.987
35.3
Range Factor
35.8
0.0
Zone Rating
0.0
113
Games Played
113
0
Games Started
0
0.0
Defensive Wins Above Replacement
0.0
1
Qualified
1