

White Sox vs Royals Live Score (24 Sep, 2026)
Game Information
Stage
STD
Season
2026
First Pitch
Thu, Sep 24, 2:10 pm
Venue
Kauffman Stadium
Location
Kansas City, Missouri
Venue Type
Outdoor
Broadcast
MLB.TV
Attendance
15,592
Live Situation
1Balls
2Strikes
0Outs
—Pitcher
—At Bat
Pitch Sequence
1
STRIKE LOOKING
Four-seam FB
91 MPH
2
STRIKE FOUL
Four-seam FB
92 MPH
3
BALL
Changeup
79 MPH
4
STRIKE FOUL
Changeup
79 MPH
5
BALL IN PLAY
Changeup
79 MPH
Injury Report

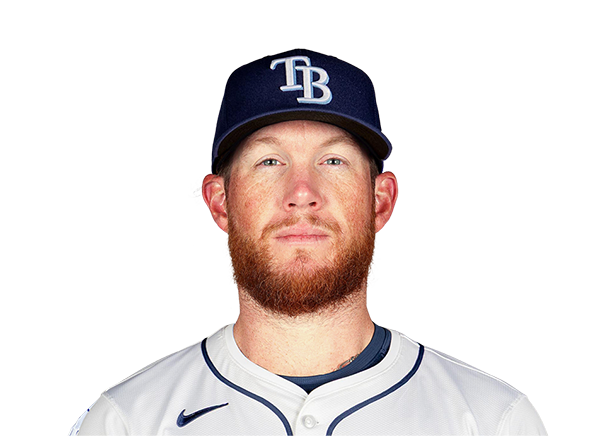
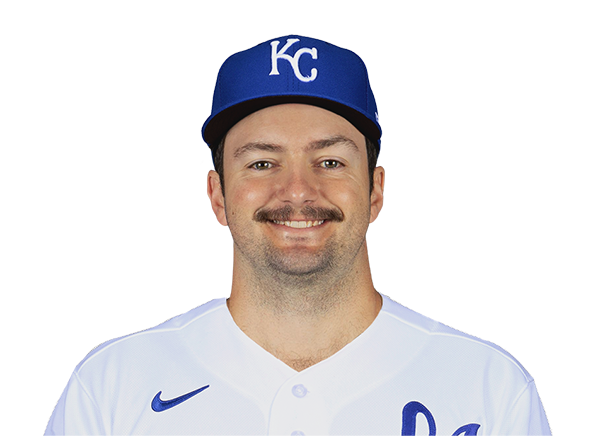
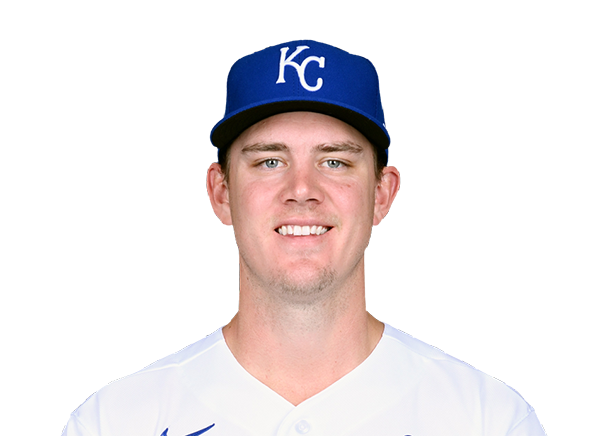
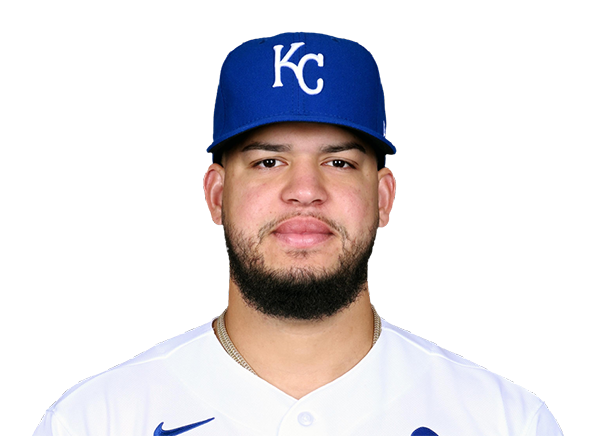
Team Stats
 CHW
KC


9
Runs
1
12
Hits
7
0
Errors
2
1
Home Runs
1
6
Walks
1
12
Strikeouts
10
Player Box Score
Chicago White Sox
| Player | H-AB | AB | R | H | RBI | HR | BB | K | #P | AVG | OBP | SLG |
|---|---|---|---|---|---|---|---|---|---|---|---|---|
 Sam Antonacci | 2-5 | 5 | 3 | 2 | 0 | 0 | 1 | 0 | 24 | .271 | .365 | .390 |
 Kyle Teel | 2-2 | 2 | 3 | 2 | 1 | 1 | 1 | 0 | 23 | .196 | .333 | .357 |
 Miguel Vargas | 2-5 | 5 | 2 | 2 | 2 | 0 | 1 | 3 | 25 | .252 | .363 | .479 |
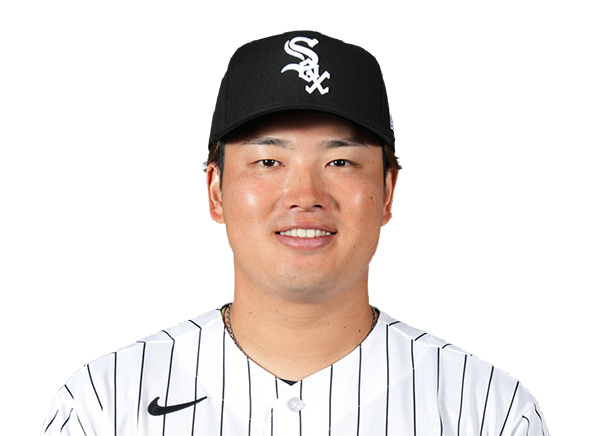 Munetaka Murakami | 1-4 | 4 | 0 | 1 | 1 | 0 | 1 | 2 | 25 | .204 | .348 | .467 |
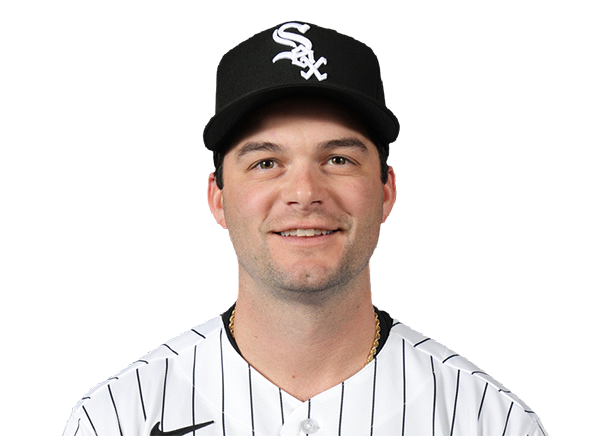 Andrew Benintendi | 0-2 | 2 | 0 | 0 | 2 | 0 | 2 | 2 | 17 | .241 | .302 | .410 |
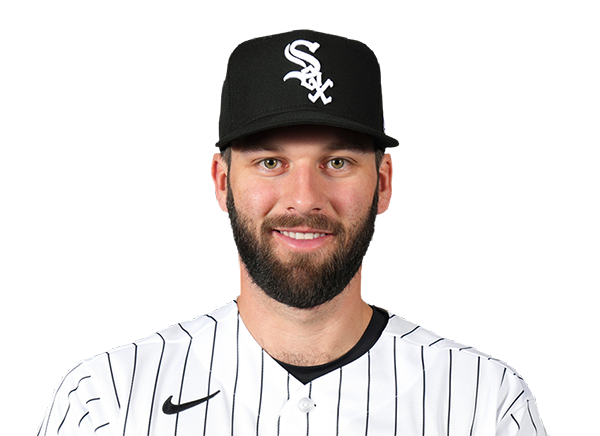 Tristan Peters | 1-5 | 5 | 0 | 1 | 2 | 0 | 0 | 1 | 18 | .269 | .341 | .444 |
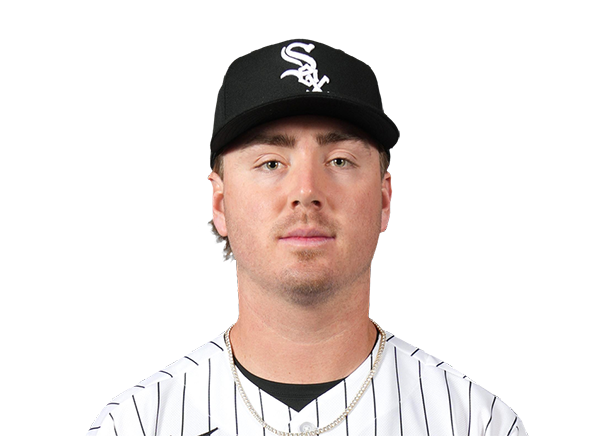 Chase Meidroth | 2-3 | 3 | 0 | 2 | 0 | 0 | 0 | 1 | 14 | .275 | .350 | .413 |
 Brenton Doyle | 0-2 | 2 | 0 | 0 | 0 | 0 | 0 | 1 | 7 | .230 | .273 | .333 |
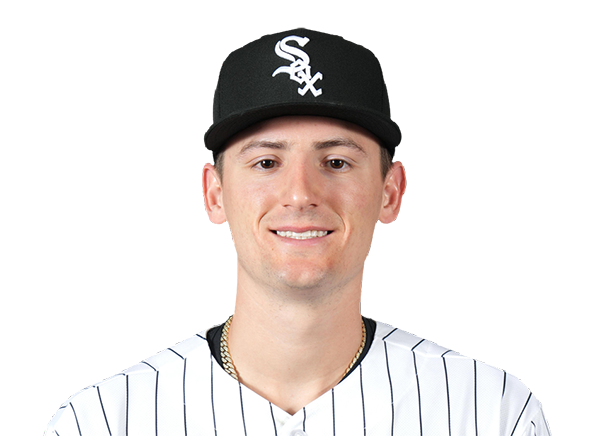 Colson Montgomery | 0-4 | 4 | 0 | 0 | 0 | 0 | 0 | 1 | 10 | .200 | .286 | .410 |
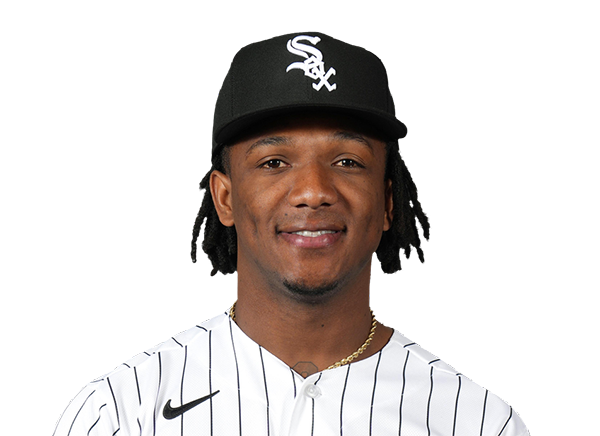 Luisangel Acuna | 0-1 | 1 | 0 | 0 | 0 | 0 | 0 | 0 | 1 | .224 | .258 | .259 |
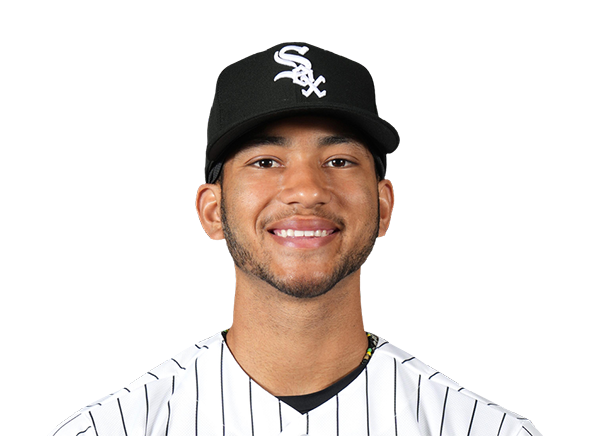 Braden Montgomery | 2-5 | 5 | 1 | 2 | 0 | 0 | 0 | 1 | 16 | .222 | .311 | .349 |
Kansas City Royals
| Player | H-AB | AB | R | H | RBI | HR | BB | K | #P | AVG | OBP | SLG |
|---|---|---|---|---|---|---|---|---|---|---|---|---|
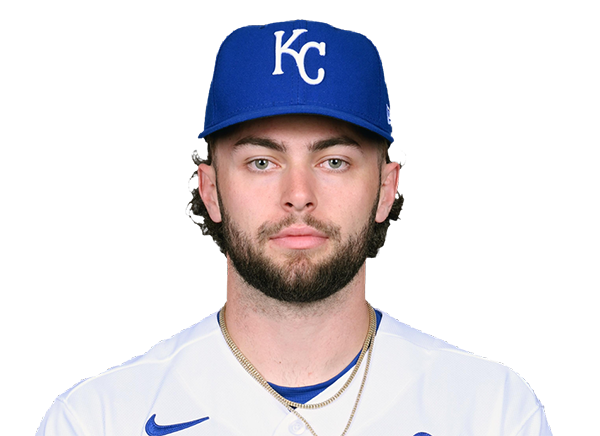 Carter Jensen | 0-4 | 4 | 0 | 0 | 0 | 0 | 0 | 2 | 21 | .235 | .320 | .451 |
 Luke Maile | 0-0 | 0 | 0 | 0 | 0 | 0 | 0 | 0 | 0 | .171 | .244 | .293 |
 Bobby Witt Jr. | 1-4 | 4 | 0 | 1 | 0 | 0 | 0 | 0 | 14 | .282 | .360 | .443 |
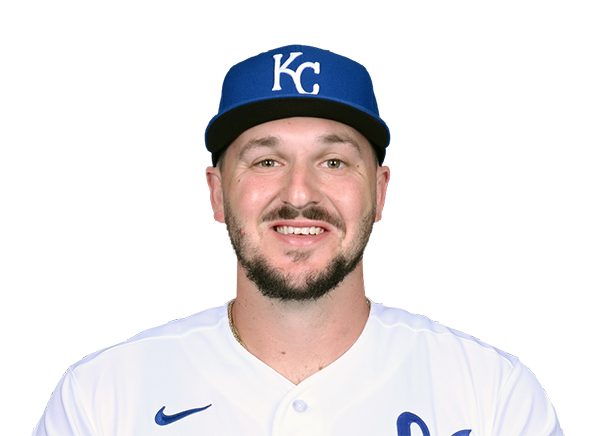 Vinnie Pasquantino | 0-4 | 4 | 0 | 0 | 0 | 0 | 0 | 0 | 16 | .246 | .329 | .415 |
 Salvador Perez | 1-3 | 3 | 1 | 1 | 1 | 1 | 1 | 1 | 17 | .228 | .272 | .378 |
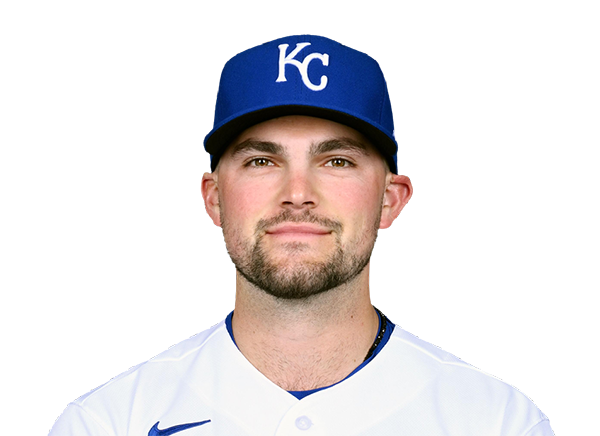 Michael Massey | 0-4 | 4 | 0 | 0 | 0 | 0 | 0 | 1 | 13 | .273 | .305 | .432 |
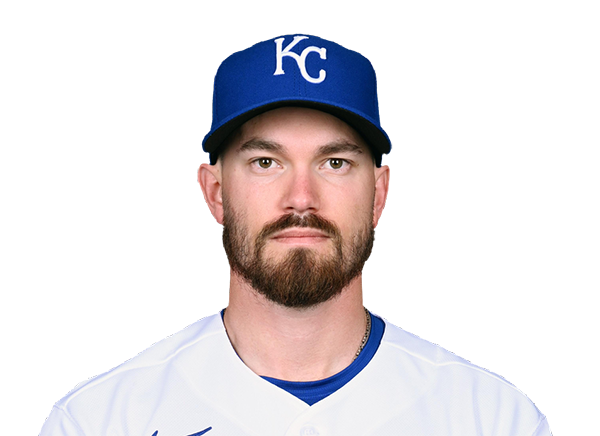 Nick Loftin | 1-4 | 4 | 0 | 1 | 0 | 0 | 0 | 2 | 17 | .240 | .322 | .388 |
 John Rave | 2-4 | 4 | 0 | 2 | 0 | 0 | 0 | 1 | 16 | .230 | .311 | .437 |
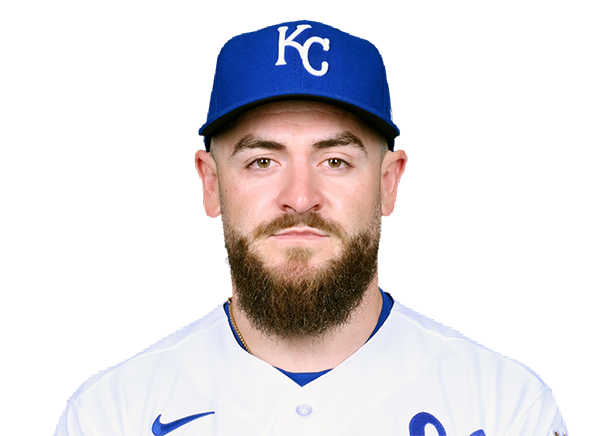 Kyle Isbel | 2-3 | 3 | 0 | 2 | 0 | 0 | 0 | 1 | 8 | .220 | .264 | .321 |
 Isaac Collins | 0-3 | 3 | 0 | 0 | 0 | 0 | 0 | 2 | 12 | .214 | .321 | .324 |
Chicago White Sox
| Player | IP | H | R | ER | BB | K | HR | PC-ST | ERA | PC |
|---|---|---|---|---|---|---|---|---|---|---|
 David Sandlin | 6.0 | 5 | 1 | 1 | 0 | 7 | 1 | 85-59 | 5.58 | 85 |
 Huascar Brazoban | 1.0 | 1 | 0 | 0 | 0 | 2 | 0 | 16-12 | 3.02 | 16 |
 Tyler Davis | 1.0 | 0 | 0 | 0 | 0 | 1 | 0 | 15-11 | 3.41 | 15 |
 Trevor Richards | 1.0 | 1 | 0 | 0 | 1 | 0 | 0 | 18-12 | 3.73 | 18 |
Kansas City Royals
| Player | IP | H | R | ER | BB | K | HR | PC-ST | ERA | PC |
|---|---|---|---|---|---|---|---|---|---|---|
 Randy Dobnak | 1.1 | 6 | 6 | 4 | 1 | 1 | 0 | 42-27 | 3.51 | 42 |
 Anthony Gose | 1.2 | 1 | 0 | 0 | 0 | 3 | 0 | 28-19 | 0.00 | 28 |
 Alex Lange | 1.0 | 2 | 2 | 2 | 2 | 1 | 1 | 20-10 | 6.18 | 20 |
 Jose Cuas | 2.0 | 1 | 1 | 1 | 3 | 2 | 0 | 42-21 | 2.42 | 42 |
 Spencer Bivens | 2.0 | 1 | 0 | 0 | 0 | 4 | 0 | 32-24 | 10.29 | 32 |
 Nolan Hoffman | 1.0 | 1 | 0 | 0 | 0 | 1 | 0 | 16-8 | 3.21 | 16 |
H2H / Season Series
KC1–9
CHW
KC5–4
CHW
KC11–14
CHW
CHW4–5
KC
CHW2–1
KC
CHW22–1
KC
CHW6–2
KC
CHW6–5
KC
CHW6–5
KC
KC5–6
CHW
Last 5 Games
| Date | Opponent | Result |
|---|---|---|
| Sep 24 | @ KC | W9–1 |
| Sep 23 | @ KC | L4–5 |
| Sep 22 | @ KC | W14–11 |
| Sep 20 |  vs DET | W8–1 |
| Sep 19 | vs DET | W3–1 |
| Date | Opponent | Result |
|---|---|---|
| Sep 24 | vs CHW | L1–9 |
| Sep 23 | vs CHW | W5–4 |
| Sep 22 | vs CHW | L11–14 |
| Sep 20 |  @ PIT | L3–4 |
| Sep 19 | @ PIT | L5–6 |
Standings
American League
| Team | W | L | PCT | GB | DIFF | STRK |
|---|---|---|---|---|---|---|
1 Rays | 96 | 63 | .604 | - | +77 | L2 |
2 Guardians | 83 | 76 | .522 | 13 | +3 | W1 |
3 Astros | 79 | 80 | .497 | 17 | -51 | W1 |
4 Yankees | 92 | 67 | .579 | 4 | +143 | W2 |
5 Red Sox | 85 | 74 | .535 | 11 | +79 | L1 |
| 6White Sox | 82 | 77 | .516 | 14 | +52 | W1 |
7 Rangers | 79 | 80 | .497 | 17 | -40 | W1 |
8 Orioles | 78 | 81 | .491 | 18 | -26 | W3 |
9 Blue Jays | 77 | 82 | .484 | 19 | -47 | L3 |
10 Twins | 75 | 84 | .472 | 21 | -64 | W2 |
| 11Tigers | 74 | 85 | .465 | 22 | +71 | L2 |
12 Mariners | 74 | 85 | .465 | 22 | -64 | L1 |
| 13Royals | 68 | 91 | .428 | 28 | -112 | L1 |
14 Athletics | 63 | 96 | .396 | 33 | -219 | L1 |
15 Angels | 61 | 98 | .384 | 35 | -91 | W1 |
National League
| Team | W | L | PCT | GB | DIFF | STRK |
|---|---|---|---|---|---|---|
1 Brewers | 100 | 59 | .629 | - | +207 | W2 |
2 Dodgers | 97 | 62 | .610 | 3 | +194 | L2 |
3 Braves | 93 | 66 | .585 | 7 | +116 | L1 |
4 Padres | 89 | 70 | .560 | 11 | +40 | W2 |
5 Cubs | 88 | 71 | .553 | 12 | +146 | W1 |
6 Phillies | 87 | 72 | .547 | 13 | +24 | L2 |
7 Diamondbacks | 85 | 74 | .535 | 15 | +10 | W5 |
| 8Pirates | 81 | 78 | .509 | 19 | +28 | W1 |
9 Marlins | 78 | 81 | .491 | 22 | +3 | L1 |
10 Cardinals | 77 | 82 | .484 | 23 | -22 | L1 |
11 Nationals | 75 | 84 | .472 | 25 | +9 | W2 |
12 Reds | 74 | 85 | .465 | 26 | -159 | W1 |
13 Mets | 73 | 86 | .459 | 27 | -35 | L1 |
14 Giants | 65 | 94 | .409 | 35 | -84 | L2 |
15 Rockies | 57 | 102 | .358 | 43 | -188 | L4 |
CHW
VS
KC
Pitchers
David Sandlin
Catchers
Kyle Teel
Infielders
Miguel Vargas
Munetaka Murakami
Chase Meidroth
Colson Montgomery
Outfielders
Sam Antonacci
Tristan Peters
Braden Montgomery
Designated Hitters
Andrew Benintendi
Pitchers
Randy Dobnak
Catchers
Carter Jensen
Infielders
Bobby Witt Jr.
Vinnie Pasquantino
Michael Massey
Nick Loftin
Outfielders
John Rave
Kyle Isbel
Isaac Collins
Designated Hitters
Salvador Perez
White Sox
VS
Royals
Batting
159
Team Games Played
159
5330
At Bats
5335
1256
Hits
1313
724
Runs Batted In
640
204
Home Runs
165
90
Stolen Bases
127
.236
Batting Average
.246
760
Runs
673
248
Doubles
285
18
Triples
19
2152
Total Bases
2131
584
Walks
503
1473
Strikeouts
1252
.321
On Base Percentage
.315
.404
Slugging Percentage
.399
.724
OBP Pct + SLG Pct
.715
159
Games Played
159
159
Games Started
159
100
Hit By Pitch
56
0.0
Wins Above Replacement
0.0
0.0
Offensive Wins Above Replacement
0.0
34
Caught Stealing
32
1
Is Qualified
1
717.1
Runs Created
688.7
4.6
Runs Created Per 27 Outs
4.4
.096
Walks Per Plate Appearance
.084
0.40
Walk To Strikeout Ratio
0.40
.168
Isolated Power
.153
.288
Secondary Average
.265
3.88
Pitches Per Plate Appearance
3.81
470
Extra Base Hits
469
6079
Plate Appearances
5968
26.1
At Bats Per Home Run
32.3
27
Sacrifice Hit
27
36
Sacrifice Flies
45
Pitching
159
Team Games Played
159
34
Quality Starts
61
82
Wins
68
77
Losses
91
40
Saves
37
61
Holds
83
1296
Hits
1392
649
Earned runs
735
175
Home Runs
201
564
Walks
564
1309
Strikeouts
1161
8.3
Strikeouts Per 9 Innings
7.5
150.4
Pitches Per Start
146.9
1.32
Walks Plus Hits Per Inning Pitched
1.40
4.13
Earned Run Average
4.73
77
Losses
91
1413.2
Innings pitched
1397.1
.516
Win Percentage
.428
70
Save Opportunities
63
.243
Opponent Batting Average
.260
.323
Opponent's On-base pct.
.337
.398
Opponent's Slugging pct.
.435
.721
Opponent's OPB Pct + SLG Pct
.772
5330
At Bats
5348
256
Doubles
287
22
Triples
22
90
Batters Hit
71
119
Stolen Bases
73
159
Games Played
159
0
Complete Games
2
9
Shutouts
8
70
Wild Pitches
52
681
Runs Batted In
751
9
Balks
3
1413.2
Innings pitched
1397.1
8.3
Strikeouts Per 9 Innings
7.5
41
Caught Stealing
35
159
Games Started
159
0.0
Wins Above Replacement
0.0
1
Is Qualified
1
708
Runs
785
649
Earned Runs
735
2121
Total Bases
2326
Fielding
159
Team Games Played
159
1414
Full Innings
1397
5613
Total Chances
5700
4241
Putouts
4192
1291
Assists
1435
81
Errors
73
248
Double Plays
285
0.986
Fielding Percentage
0.987
35.2
Range Factor
36.2
0.0
Zone Rating
0.0
159
Games Played
159
0
Games Started
0
0.0
Defensive Wins Above Replacement
0.0
1
Qualified
1