

White Sox vs Tigers Live Score (15 Aug, 2026)
Game Information
Stage
Standard
Season
2026
First Pitch
Sat, Aug 15, 1:10 pm
Venue
Comerica Park
Location
Detroit, Michigan
Attendance
33,119
Injury Report







Team Stats
 CHW
DET


Array
Runs
Array
12
Hits
7
0
Errors
0
—
Home Runs
—
—
Walks
—
—
Strikeouts
—
Standings
American League
| Team | W | L | PCT | GB | DIFF | STRK |
|---|---|---|---|---|---|---|
1 Rays | 76 | 53 | .589 | - | +42 | L3 |
| 2White Sox | 67 | 62 | .519 | 9 | +42 | L1 |
3 Astros | 65 | 65 | .500 | 11.5 | -43 | L1 |
4 Yankees | 73 | 56 | .566 | 3 | +95 | L1 |
5 Red Sox | 70 | 59 | .543 | 6 | +98 | W2 |
6 Rangers | 64 | 66 | .492 | 12.5 | -48 | L1 |
7 Guardians | 64 | 66 | .492 | 12.5 | -14 | W3 |
8 Blue Jays | 64 | 67 | .489 | 13 | -50 | W1 |
9 Twins | 63 | 67 | .485 | 13.5 | -47 | L2 |
10 Orioles | 63 | 67 | .485 | 13.5 | -33 | W2 |
11 Mariners | 62 | 68 | .477 | 14.5 | -44 | W2 |
| 12Tigers | 61 | 68 | .473 | 15 | +77 | L4 |
13 Royals | 57 | 74 | .435 | 20 | -95 | W7 |
14 Angels | 52 | 78 | .400 | 24.5 | -68 | W1 |
15 Athletics | 50 | 80 | .385 | 26.5 | -188 | W1 |
National League
| Team | W | L | PCT | GB | DIFF | STRK |
|---|---|---|---|---|---|---|
1 Brewers | 81 | 49 | .623 | - | +163 | W3 |
2 Dodgers | 79 | 51 | .608 | 2 | +147 | W5 |
3 Braves | 75 | 55 | .577 | 6 | +108 | L2 |
4 Cubs | 74 | 56 | .569 | 7 | +98 | L3 |
5 Phillies | 72 | 58 | .554 | 9 | +25 | W8 |
6 Padres | 70 | 60 | .538 | 11 | +9 | W2 |
7 Diamondbacks | 68 | 62 | .523 | 13 | +7 | L1 |
8 Marlins | 66 | 64 | .508 | 15 | +17 | W2 |
9 Cardinals | 66 | 65 | .504 | 15.5 | 0 | L2 |
10 Pirates | 63 | 68 | .481 | 18.5 | +29 | L2 |
11 Reds | 62 | 68 | .477 | 19 | -92 | W1 |
12 Nationals | 61 | 70 | .466 | 20.5 | +14 | L3 |
13 Mets | 59 | 71 | .454 | 22 | -39 | W1 |
14 Giants | 52 | 77 | .403 | 28.5 | -79 | L3 |
15 Rockies | 50 | 79 | .388 | 30.5 | -131 | L5 |
CHW
VS
DET
Pitchers
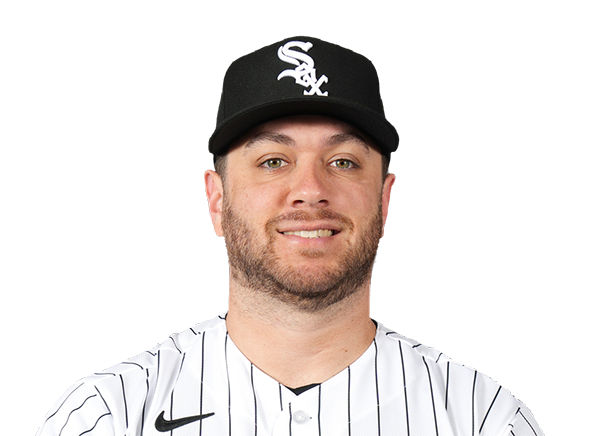
Anthony Kay
Catchers

Jake Rogers
Infielders
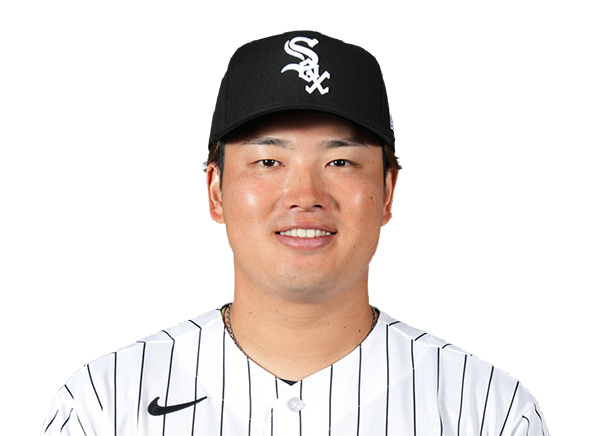
Munetaka Murakami
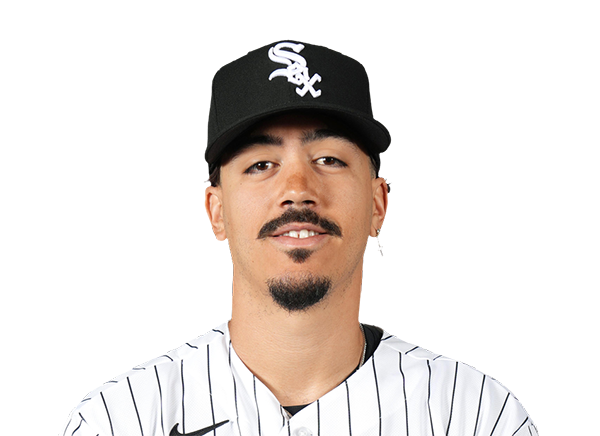
Miguel Vargas

Colson Montgomery
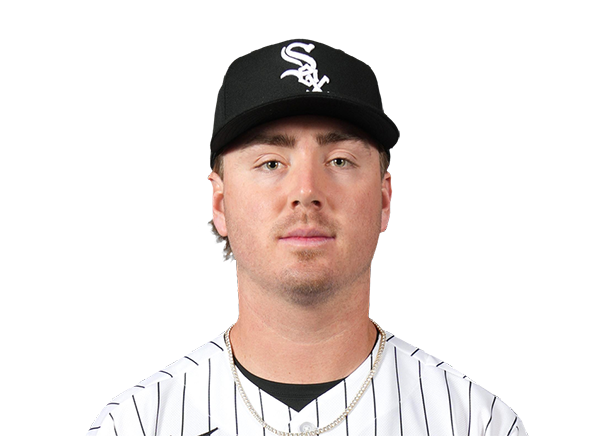
Chase Meidroth
Outfielders
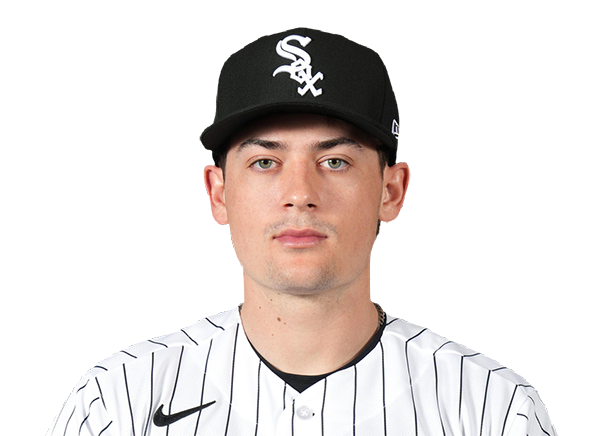
Sam Antonacci
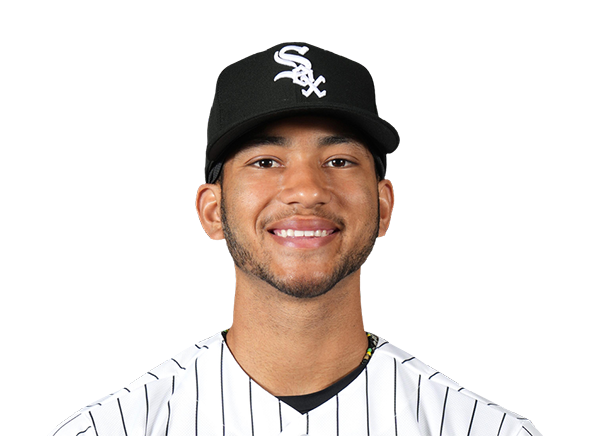
Braden Montgomery
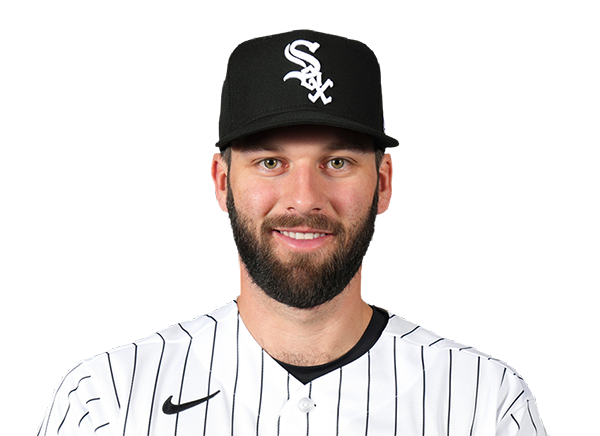
Tristan Peters
Designated Hitters
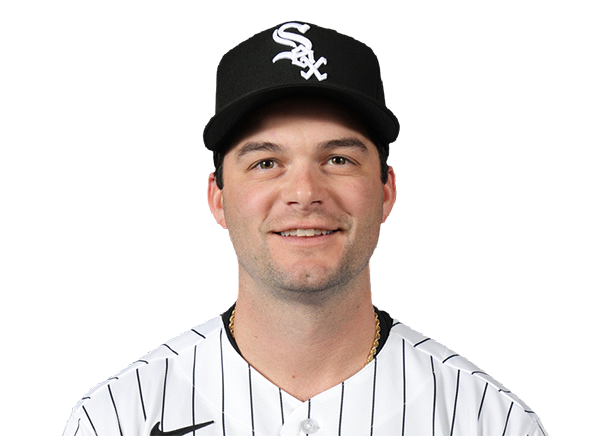
Andrew Benintendi
Pitchers

Troy Melton
Catchers
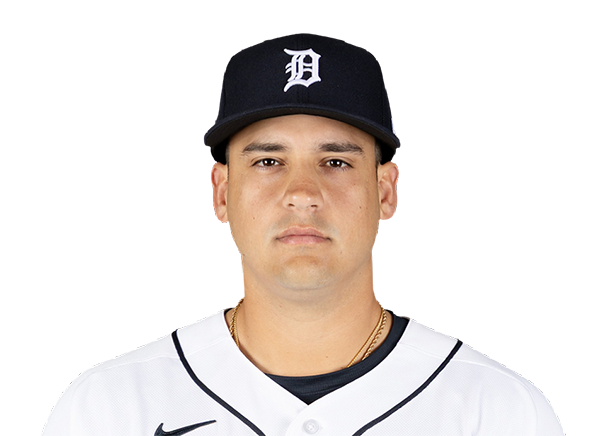
Eduardo Valencia
Infielders
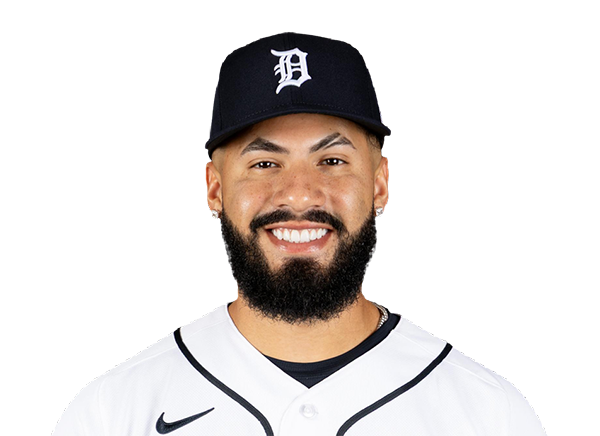
Gleyber Torres
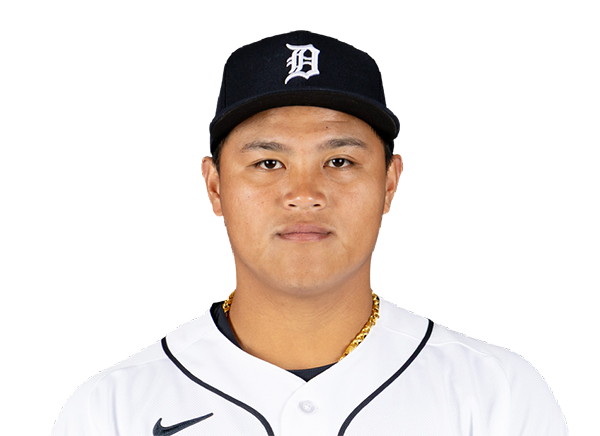
Hao-Yu Lee

Kevin McGonigle

Spencer Torkelson
Outfielders

Ben Malgeri
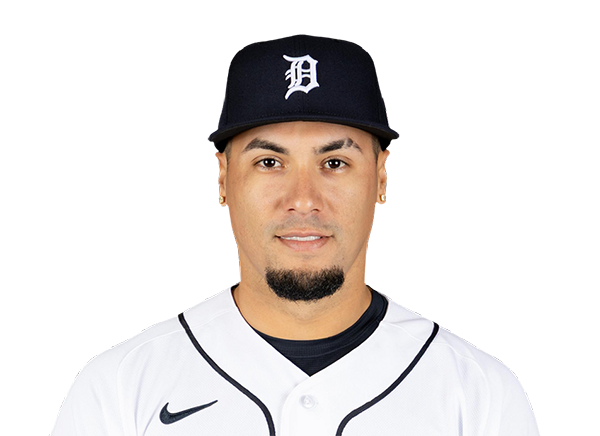
Javier Baez

Corey Julks
Designated Hitters

Dillon Dingler
White Sox
VS
Tigers
Batting
121
Team Games Played
122
4073
At Bats
4120
973
Hits
1001
556
Runs Batted In
530
161
Home Runs
148
69
Stolen Bases
36
.239
Batting Average
.243
583
Runs
557
191
Doubles
186
12
Triples
25
1671
Total Bases
1681
412
Walks
433
1102
Strikeouts
1050
.318
On Base Percentage
.319
.410
Slugging Percentage
.408
.728
OBP Pct + SLG Pct
.727
121
Games Played
122
121
Games Started
122
73
Hit By Pitch
47
0.0
Wins Above Replacement
0.0
0.0
Offensive Wins Above Replacement
0.0
30
Caught Stealing
18
1
Is Qualified
1
547.4
Runs Created
546.4
4.6
Runs Created Per 27 Outs
4.5
.089
Walks Per Plate Appearance
.093
0.37
Walk To Strikeout Ratio
0.41
.171
Isolated Power
.165
.282
Secondary Average
.275
3.85
Pitches Per Plate Appearance
3.93
364
Extra Base Hits
359
4613
Plate Appearances
4647
25.3
At Bats Per Home Run
27.8
24
Sacrifice Hit
6
29
Sacrifice Flies
36
Pitching
121
Team Games Played
122
31
Quality Starts
48
63
Wins
60
58
Losses
62
30
Saves
25
51
Holds
55
964
Hits
933
493
Earned runs
423
133
Home Runs
120
438
Walks
373
1024
Strikeouts
1000
8.5
Strikeouts Per 9 Innings
8.3
150.7
Pitches Per Start
141.7
1.30
Walks Plus Hits Per Inning Pitched
1.21
4.11
Earned Run Average
3.52
58
Losses
62
1080.1
Innings pitched
1081.2
.521
Win Percentage
.492
53
Save Opportunities
51
.238
Opponent Batting Average
.231
.322
Opponent's On-base pct.
.302
.390
Opponent's Slugging pct.
.373
.712
Opponent's OPB Pct + SLG Pct
.675
4043
At Bats
4047
179
Doubles
179
18
Triples
18
75
Batters Hit
53
99
Stolen Bases
69
121
Games Played
122
0
Complete Games
0
8
Shutouts
14
52
Wild Pitches
27
518
Runs Batted In
450
8
Balks
3
1080.1
Innings pitched
1081.2
8.5
Strikeouts Per 9 Innings
8.3
33
Caught Stealing
24
121
Games Started
122
0.0
Wins Above Replacement
0.0
1
Is Qualified
1
539
Runs
471
493
Earned Runs
423
1578
Total Bases
1508
Fielding
121
Team Games Played
122
1080
Full Innings
1082
4298
Total Chances
4369
3241
Putouts
3245
991
Assists
1070
66
Errors
54
191
Double Plays
186
0.985
Fielding Percentage
0.988
35.3
Range Factor
35.9
0.0
Zone Rating
0.0
121
Games Played
122
0
Games Started
0
0.0
Defensive Wins Above Replacement
0.0
1
Qualified
1