

White Sox vs Twins Live Score (30 Aug, 2026)
Game Information
Stage
STD
Season
2026
First Pitch
Sun, Aug 30, 2:10 pm
Venue
Target Field
Location
Minneapolis, Minnesota
Venue Type
Outdoor
Broadcast
MLB.TV
Attendance
26,225
Live Situation
3Balls
2Strikes
0Outs
—Pitcher
—At Bat
Pitch Sequence
1
BALL
Four-seam FB
95 MPH
2
STRIKE SWINGING
Four-seam FB
95 MPH
3
BALL
Four-seam FB
95 MPH
4
STRIKE LOOKING
Four-seam FB
95 MPH
5
BALL
Slider
87 MPH
6
STRIKE FOUL
Four-seam FB
95 MPH
7
BALL IN PLAY
Four-seam FB
96 MPH
Injury Report
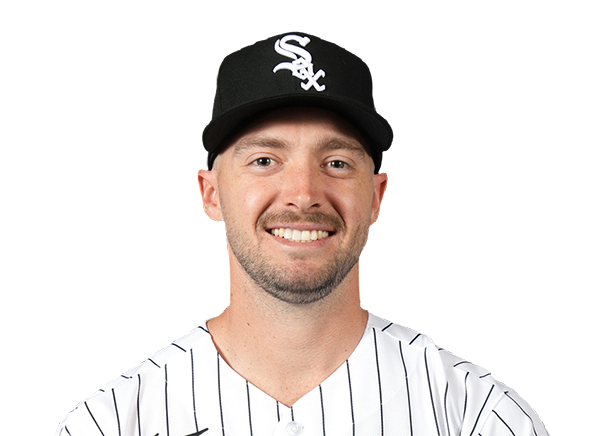
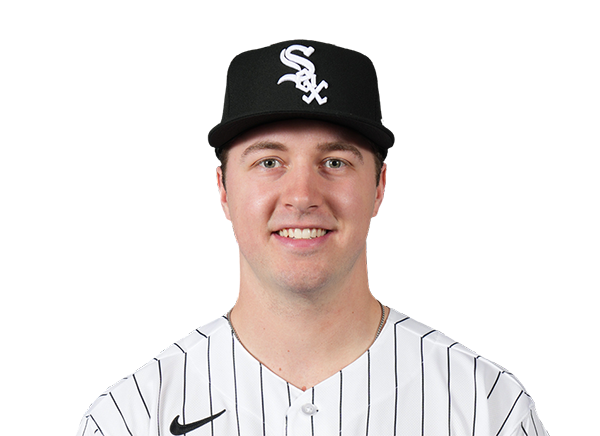
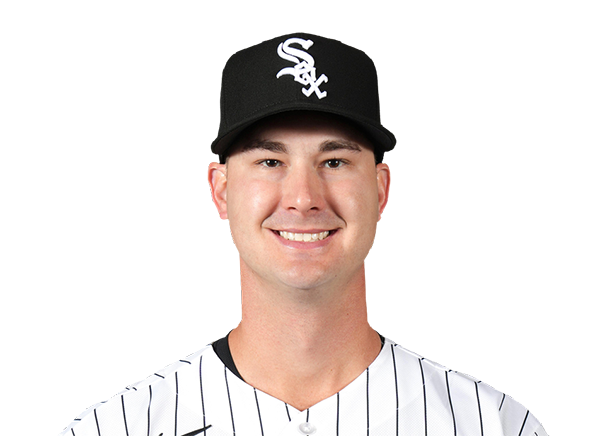

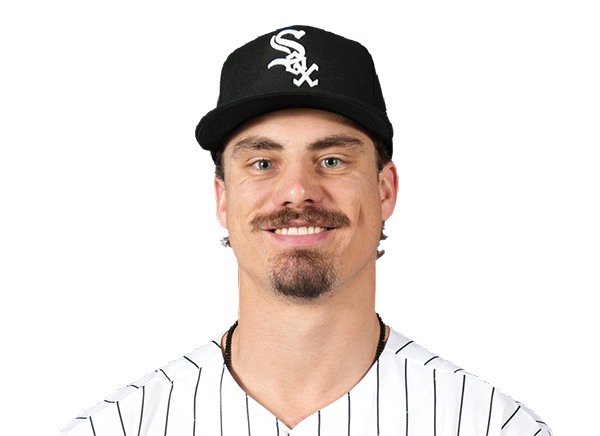
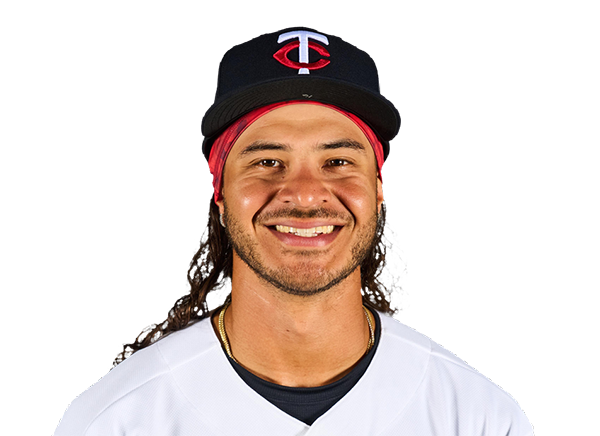
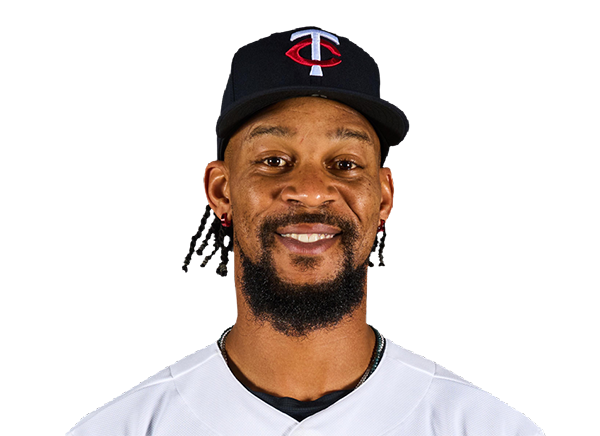
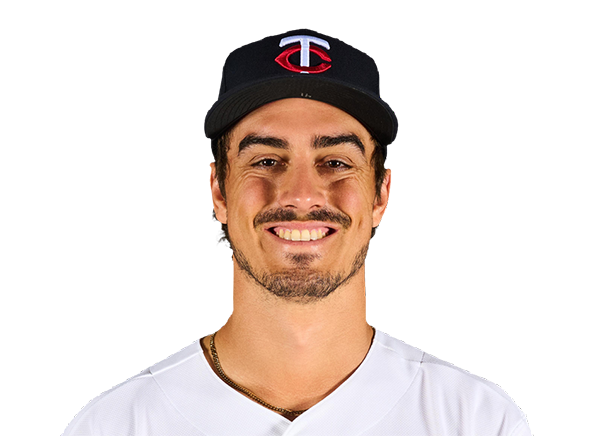
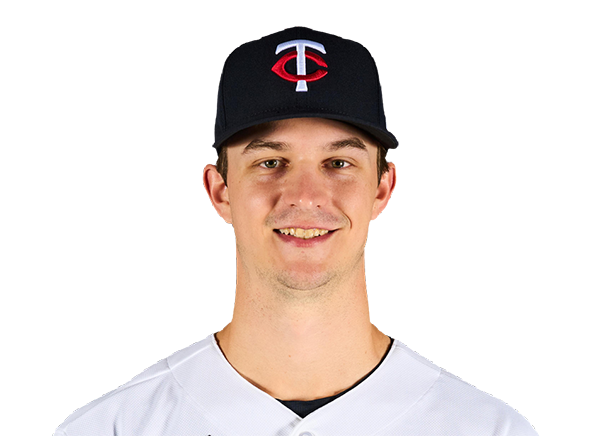
Team Stats
 CHW
MIN


1
Runs
5
6
Hits
9
0
Errors
0
0
Home Runs
1
0
Walks
2
5
Strikeouts
3
Player Box Score
Chicago White Sox
| Player | H-AB | AB | R | H | RBI | HR | BB | K | #P | AVG | OBP | SLG |
|---|---|---|---|---|---|---|---|---|---|---|---|---|
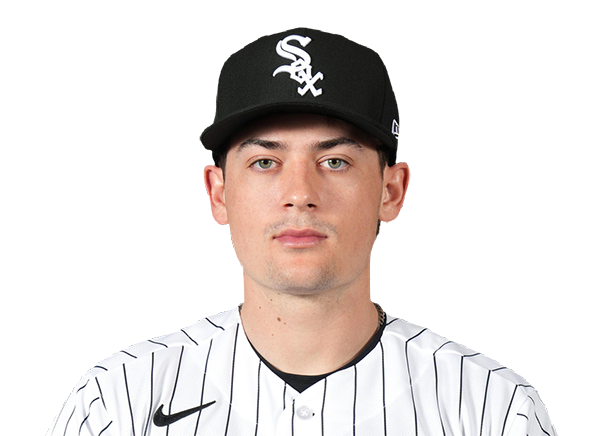 Sam Antonacci | 2-4 | 4 | 1 | 2 | 0 | 0 | 0 | 0 | 16 | .269 | .365 | .394 |
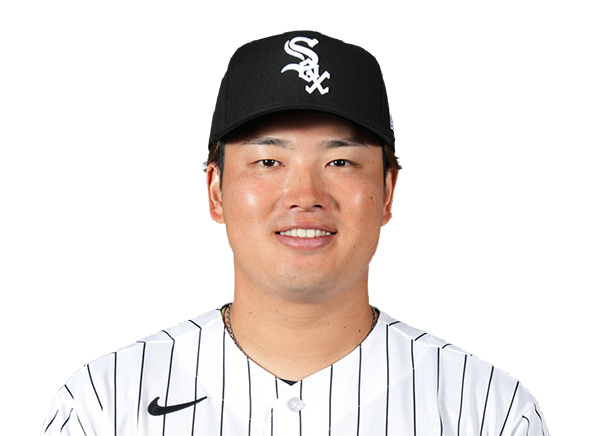 Munetaka Murakami | 0-4 | 4 | 0 | 0 | 0 | 0 | 0 | 1 | 15 | .218 | .357 | .497 |
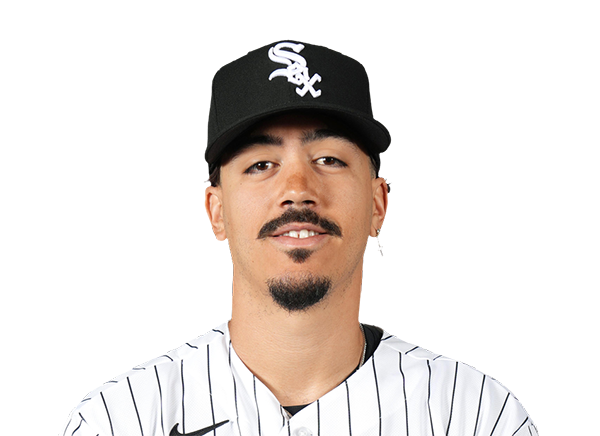 Miguel Vargas | 1-4 | 4 | 0 | 1 | 0 | 0 | 0 | 2 | 20 | .249 | .363 | .490 |
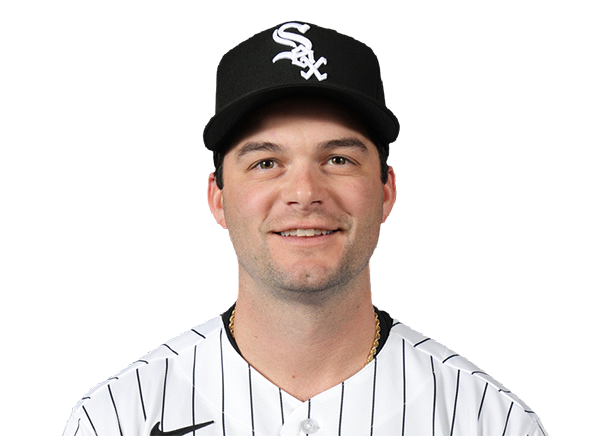 Andrew Benintendi | 0-4 | 4 | 0 | 0 | 0 | 0 | 0 | 0 | 10 | .249 | .309 | .433 |
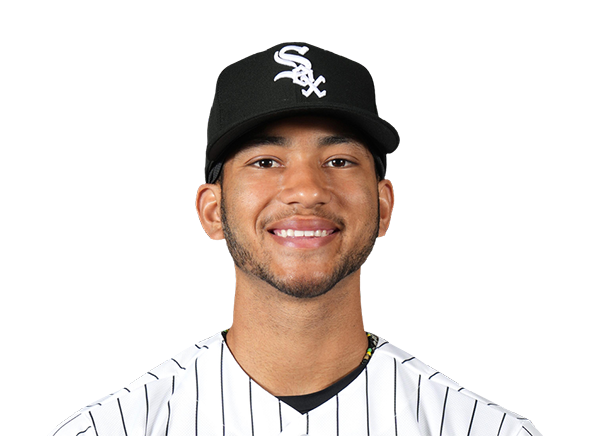 Braden Montgomery | 1-4 | 4 | 0 | 1 | 1 | 0 | 0 | 0 | 15 | .229 | .318 | .361 |
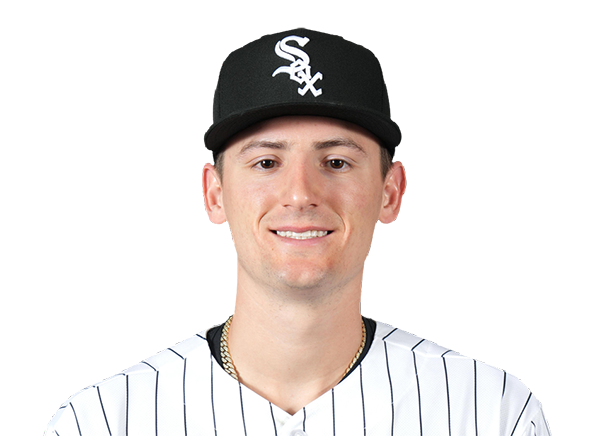 Colson Montgomery | 0-4 | 4 | 0 | 0 | 0 | 0 | 0 | 1 | 18 | .211 | .289 | .426 |
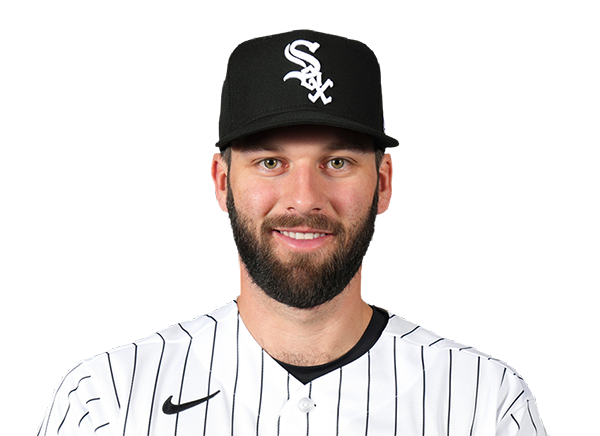 Tristan Peters | 1-3 | 3 | 0 | 1 | 0 | 0 | 0 | 0 | 4 | .280 | .344 | .467 |
 Brenton Doyle | 0-3 | 3 | 0 | 0 | 0 | 0 | 0 | 1 | 5 | .216 | .268 | .305 |
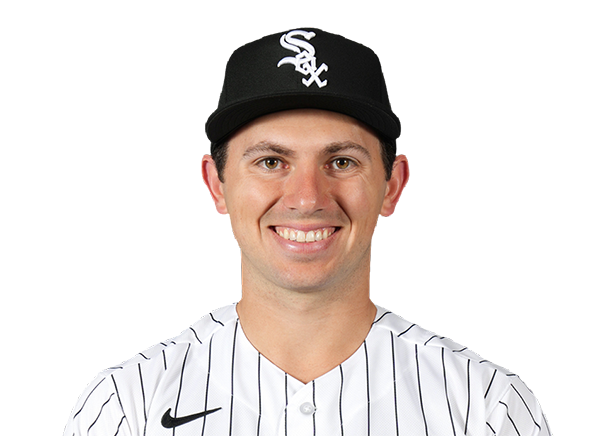 Drew Romo | 1-3 | 3 | 0 | 1 | 0 | 0 | 0 | 0 | 13 | .145 | .232 | .295 |
Minnesota Twins
| Player | H-AB | AB | R | H | RBI | HR | BB | K | #P | AVG | OBP | SLG |
|---|---|---|---|---|---|---|---|---|---|---|---|---|
 Luke Keaschall | 2-3 | 3 | 1 | 2 | 1 | 1 | 1 | 0 | 18 | .274 | .364 | .390 |
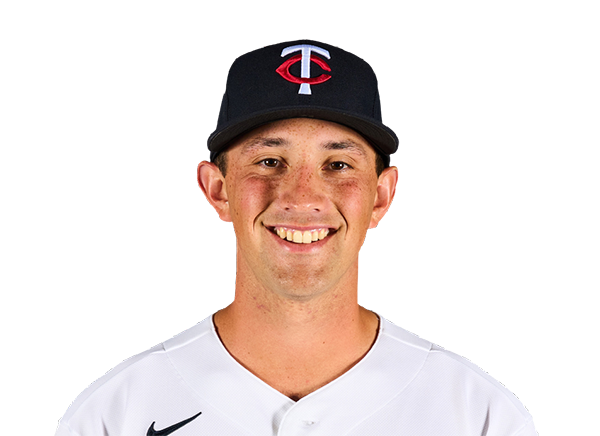 Brooks Lee | 2-4 | 4 | 1 | 2 | 0 | 0 | 0 | 0 | 9 | .248 | .300 | .439 |
 Kody Clemens | 0-4 | 4 | 0 | 0 | 0 | 0 | 0 | 1 | 22 | .236 | .293 | .459 |
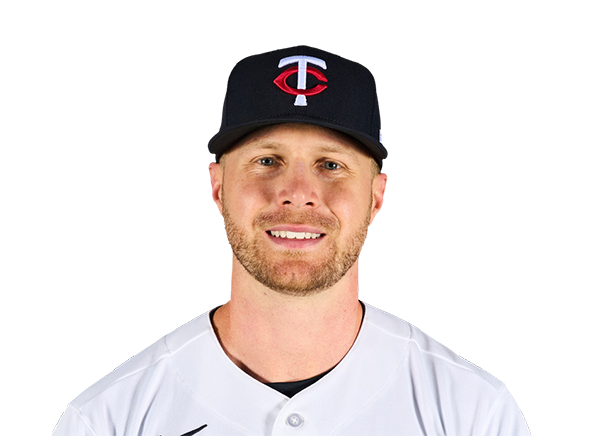 Ryan Jeffers | 1-3 | 3 | 2 | 1 | 0 | 0 | 1 | 0 | 13 | .270 | .375 | .464 |
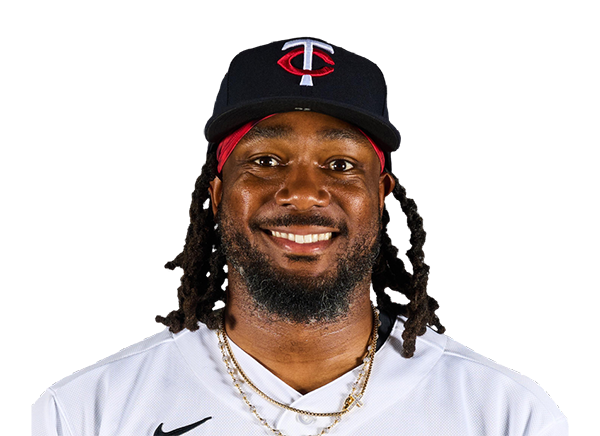 Josh Bell | 2-4 | 4 | 1 | 2 | 2 | 0 | 0 | 0 | 20 | .255 | .318 | .421 |
 Trevor Larnach | 1-4 | 4 | 0 | 1 | 2 | 0 | 0 | 1 | 13 | .266 | .348 | .424 |
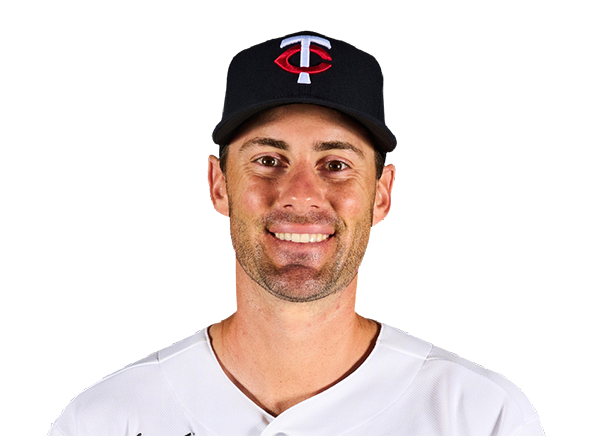 Ryan Kreidler | 0-0 | 0 | 0 | 0 | 0 | 0 | 0 | 0 | 0 | .225 | .280 | .378 |
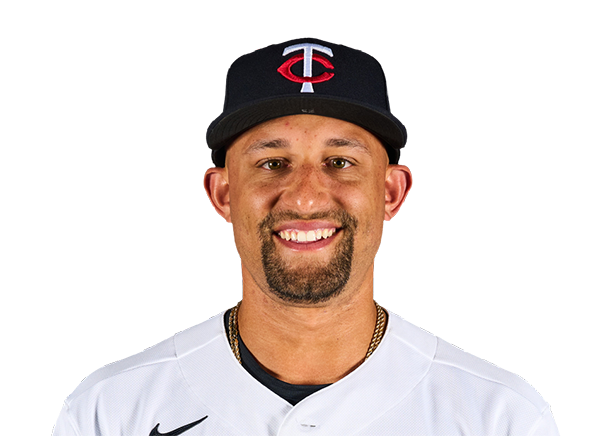 Royce Lewis | 0-3 | 3 | 0 | 0 | 0 | 0 | 0 | 0 | 16 | .233 | .299 | .396 |
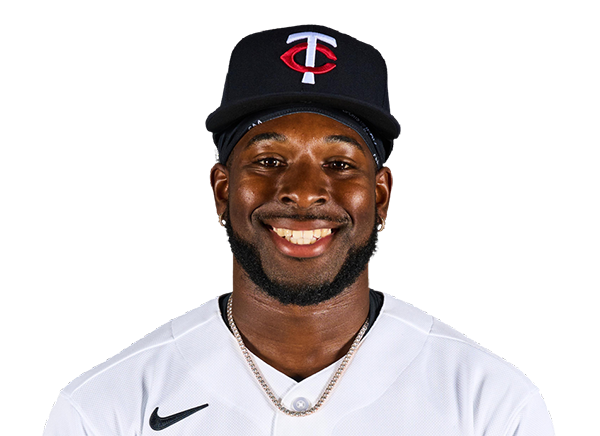 Kaelen Culpepper | 1-3 | 3 | 0 | 1 | 0 | 0 | 0 | 1 | 11 | .313 | .365 | .478 |
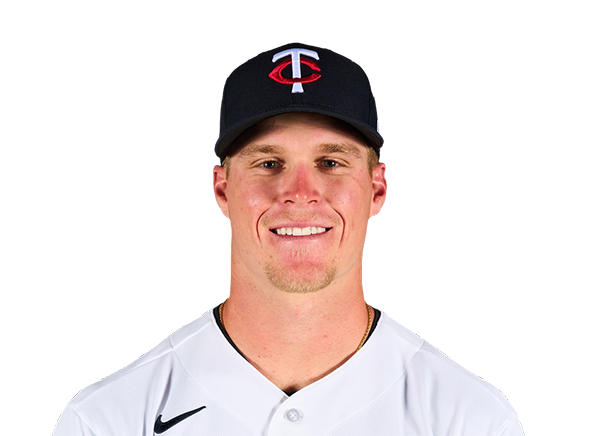 Walker Jenkins | 0-3 | 3 | 0 | 0 | 0 | 0 | 0 | 0 | 10 | .222 | .300 | .333 |
Chicago White Sox
| Player | IP | H | R | ER | BB | K | HR | PC-ST | ERA | PC |
|---|---|---|---|---|---|---|---|---|---|---|
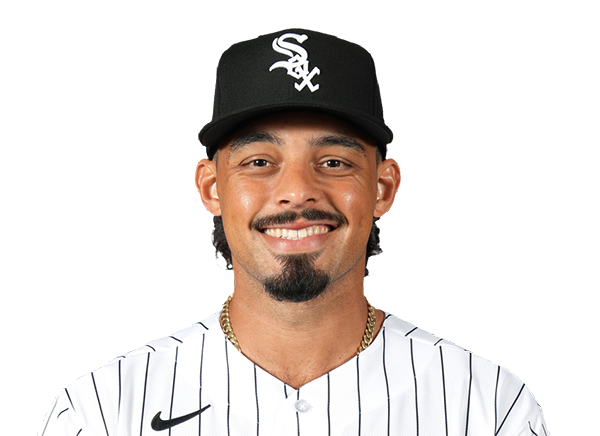 Jordan Hicks | 0.2 | 1 | 3 | 3 | 2 | 1 | 0 | 25-12 | 4.43 | 25 |
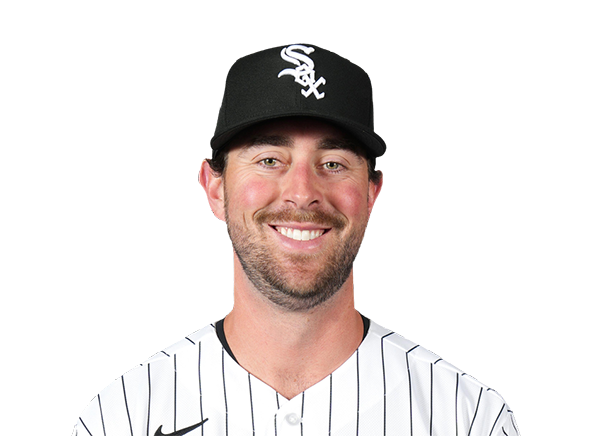 Tyler Gilbert | 2.1 | 5 | 1 | 1 | 0 | 1 | 0 | 40-26 | 12.00 | 40 |
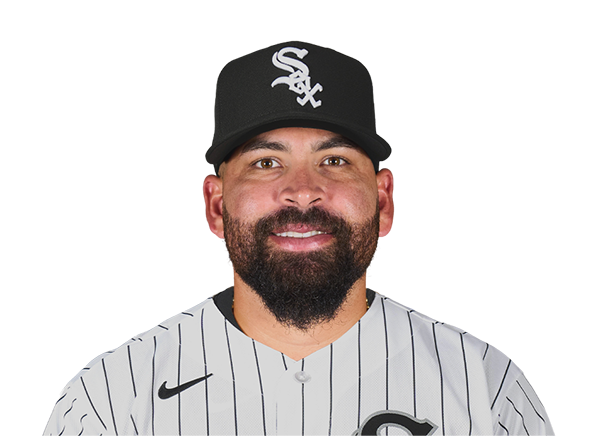 Jose Urquidy | 5.0 | 3 | 1 | 1 | 0 | 1 | 1 | 67-46 | 5.63 | 67 |
Minnesota Twins
| Player | IP | H | R | ER | BB | K | HR | PC-ST | ERA | PC |
|---|---|---|---|---|---|---|---|---|---|---|
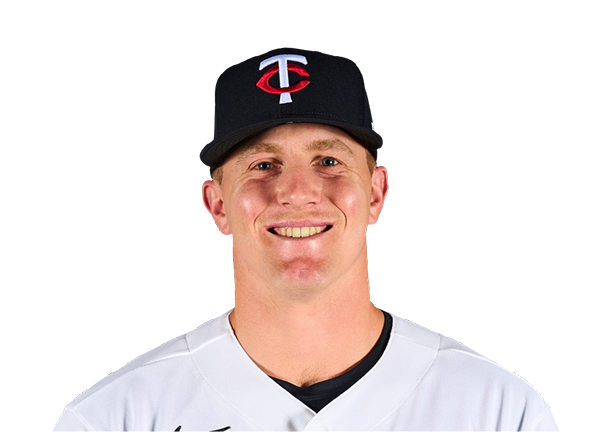 Zebby Matthews | 8.1 | 5 | 1 | 1 | 0 | 5 | 0 | 103-67 | 4.58 | 103 |
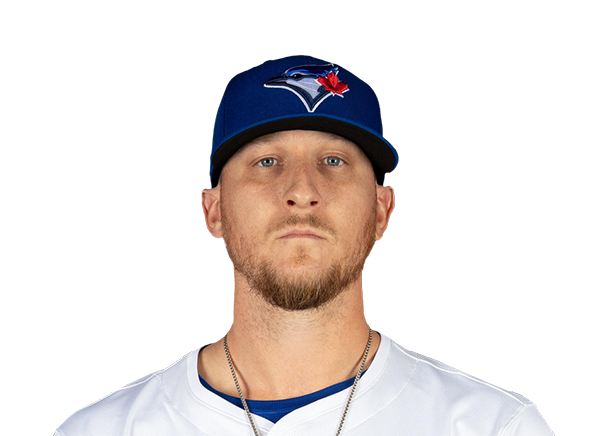 Jeff Hoffman | 0.2 | 1 | 0 | 0 | 0 | 0 | 0 | 13-9 | 3.97 | 13 |
H2H / Season Series
MIN5–1
CHW
MIN2–3
CHW
MIN4–7
CHW
MIN0–8
CHW
MIN6–4
CHW
MIN9–6
CHW
CHW6–2
MIN
CHW15–2
MIN
CHW3–5
MIN
CHW3–1
MIN
Last 5 Games
| Date | Opponent | Result |
|---|---|---|
| Aug 30 | @ MIN | L1–5 |
| Aug 29 | @ MIN | W3–2 |
| Aug 28 | @ MIN | W7–4 |
| Aug 26 |  vs TEX | W10–4 |
| Aug 25 | vs TEX | W11–7 |
| Date | Opponent | Result |
|---|---|---|
| Aug 30 | vs CHW | W5–1 |
| Aug 29 | vs CHW | L2–3 |
| Aug 28 | vs CHW | L4–7 |
| Aug 26 |  @ ATH | L4–7 |
| Aug 25 | @ ATH | L2–4 |
Standings
American League
| Team | W | L | PCT | GB | DIFF | STRK |
|---|---|---|---|---|---|---|
1 Rays | 81 | 54 | .600 | - | +53 | W3 |
| 2White Sox | 72 | 63 | .533 | 9 | +48 | W4 |
3 Astros | 68 | 68 | .500 | 13.5 | -46 | L1 |
4 Yankees | 77 | 59 | .566 | 4.5 | +102 | W1 |
5 Red Sox | 74 | 62 | .544 | 7.5 | +99 | L1 |
6 Guardians | 68 | 68 | .500 | 13.5 | -12 | L2 |
7 Orioles | 67 | 69 | .493 | 14.5 | -21 | W2 |
8 Blue Jays | 67 | 70 | .489 | 15 | -57 | W2 |
| 9Rangers | 66 | 70 | .485 | 15.5 | -54 | L4 |
10 Mariners | 64 | 72 | .471 | 17.5 | -65 | L3 |
| 11Twins | 64 | 72 | .471 | 17.5 | -60 | L4 |
12 Tigers | 63 | 72 | .467 | 18 | +70 | W1 |
13 Royals | 62 | 75 | .453 | 20 | -73 | W3 |
| 14Athletics | 53 | 83 | .390 | 28.5 | -188 | L2 |
15 Angels | 52 | 84 | .382 | 29.5 | -79 | L6 |
National League
| Team | W | L | PCT | GB | DIFF | STRK |
|---|---|---|---|---|---|---|
1 Brewers | 85 | 51 | .625 | - | +180 | W4 |
2 Braves | 81 | 55 | .596 | 4 | +116 | W6 |
3 Dodgers | 81 | 55 | .596 | 4 | +148 | L1 |
4 Cubs | 77 | 59 | .566 | 8 | +129 | W1 |
5 Phillies | 76 | 60 | .559 | 9 | +27 | W3 |
6 Diamondbacks | 73 | 65 | .529 | 13 | +5 | L1 |
7 Padres | 72 | 64 | .529 | 13 | +11 | L2 |
8 Marlins | 68 | 68 | .500 | 17 | +11 | L2 |
9 Cardinals | 68 | 69 | .496 | 17.5 | -14 | L1 |
10 Pirates | 66 | 71 | .482 | 19.5 | +25 | W1 |
11 Nationals | 65 | 73 | .471 | 21 | +20 | W3 |
12 Reds | 64 | 72 | .471 | 21 | -110 | L1 |
13 Mets | 61 | 75 | .449 | 24 | -50 | W1 |
14 Giants | 56 | 81 | .409 | 29.5 | -74 | W1 |
15 Rockies | 52 | 84 | .382 | 33 | -141 | L3 |
CHW
VS
MIN
Pitchers
Jordan Hicks
Catchers
Drew Romo
Infielders
Sam Antonacci
Munetaka Murakami
Miguel Vargas
Colson Montgomery
Outfielders
Braden Montgomery
Tristan Peters
Brenton Doyle
Designated Hitters
Andrew Benintendi
Pitchers
Zebby Matthews
Catchers
Ryan Jeffers
Infielders
Brooks Lee
Kody Clemens
Royce Lewis
Kaelen Culpepper
Outfielders
Luke Keaschall
Trevor Larnach
Walker Jenkins
Designated Hitters
Josh Bell
White Sox
VS
Twins
Batting
136
Team Games Played
137
4574
At Bats
4613
1089
Hits
1134
621
Runs Batted In
598
180
Home Runs
158
74
Stolen Bases
79
.238
Batting Average
.246
652
Runs
626
216
Doubles
224
13
Triples
19
1871
Total Bases
1870
481
Walks
437
1236
Strikeouts
1089
.319
On Base Percentage
.318
.409
Slugging Percentage
.405
.728
OBP Pct + SLG Pct
.724
136
Games Played
137
136
Games Started
137
76
Hit By Pitch
73
0.0
Wins Above Replacement
0.0
0.0
Offensive Wins Above Replacement
0.0
33
Caught Stealing
32
1
Is Qualified
1
614.8
Runs Created
604.9
4.6
Runs Created Per 27 Outs
4.5
.093
Walks Per Plate Appearance
.085
0.39
Walk To Strikeout Ratio
0.40
.171
Isolated Power
.160
.285
Secondary Average
.264
3.87
Pitches Per Plate Appearance
3.85
409
Extra Base Hits
401
5189
Plate Appearances
5171
25.4
At Bats Per Home Run
29.2
26
Sacrifice Hit
8
30
Sacrifice Flies
39
Pitching
136
Team Games Played
137
32
Quality Starts
45
72
Wins
65
64
Losses
72
37
Saves
38
55
Holds
89
1100
Hits
1169
560
Earned runs
624
155
Home Runs
156
493
Walks
497
1137
Strikeouts
1131
8.4
Strikeouts Per 9 Innings
8.4
151.3
Pitches Per Start
149.5
1.31
Walks Plus Hits Per Inning Pitched
1.38
4.15
Earned Run Average
4.65
64
Losses
72
1214.0
Innings pitched
1206.2
.529
Win Percentage
.474
63
Save Opportunities
54
.241
Opponent Batting Average
.252
.323
Opponent's On-base pct.
.329
.398
Opponent's Slugging pct.
.413
.721
Opponent's OPB Pct + SLG Pct
.742
4562
At Bats
4636
211
Doubles
241
19
Triples
18
79
Batters Hit
56
105
Stolen Bases
111
136
Games Played
137
0
Complete Games
1
9
Shutouts
3
61
Wild Pitches
37
585
Runs Batted In
650
9
Balks
6
1214.0
Innings pitched
1206.2
8.4
Strikeouts Per 9 Innings
8.4
38
Caught Stealing
20
136
Games Started
137
0.0
Wins Above Replacement
0.0
1
Is Qualified
1
608
Runs
682
560
Earned Runs
624
1814
Total Bases
1914
Fielding
136
Team Games Played
137
1214
Full Innings
1207
4822
Total Chances
4733
3642
Putouts
3620
1110
Assists
1050
70
Errors
63
216
Double Plays
224
0.985
Fielding Percentage
0.987
35.2
Range Factor
34.8
0.0
Zone Rating
0.0
136
Games Played
137
0
Games Started
0
0.0
Defensive Wins Above Replacement
0.0
1
Qualified
1