

Yankees vs Angels Live Score (1 Sep, 2026)
Game Information
Stage
STD
Season
2026
First Pitch
Mon, Aug 31, 9:38 pm
Venue
Angel Stadium
Location
Anaheim, California
Venue Type
Outdoor
Broadcast
MLB.TV
Attendance
37,613
Live Situation
0Balls
3Strikes
0Outs
—Pitcher
—At Bat
Pitch Sequence
1
STRIKE LOOKING
Sinker
89 MPH
2
STRIKE SWINGING
Sweeper
79 MPH
3
STRIKE SWINGING
Sweeper
78 MPH
Injury Report

Team Stats
 NYY
LAA

1
Runs
10
6
Hits
12
3
Errors
0
1
Home Runs
0
0
Walks
4
10
Strikeouts
10
Player Box Score
New York Yankees
| Player | H-AB | AB | R | H | RBI | HR | BB | K | #P | AVG | OBP | SLG |
|---|---|---|---|---|---|---|---|---|---|---|---|---|
 Ben Rice |
0-4 | 4 | 0 | 0 | 0 | 0 | 0 | 0 | 11 | .252 | .347 | .522 |
 Cody Bellinger |
2-4 | 4 | 0 | 2 | 0 | 0 | 0 | 0 | 20 | .259 | .344 | .416 |
 Luis Garcia Jr. |
0-4 | 4 | 0 | 0 | 0 | 0 | 0 | 2 | 14 | .285 | .318 | .549 |
 Amed Rosario |
2-4 | 4 | 0 | 2 | 0 | 0 | 0 | 1 | 17 | .239 | .284 | .423 |
 Trent Grisham |
0-4 | 4 | 0 | 0 | 0 | 0 | 0 | 2 | 14 | .209 | .307 | .397 |
 Jazz Chisholm Jr. |
1-3 | 3 | 0 | 1 | 0 | 0 | 0 | 1 | 8 | .228 | .308 | .400 |
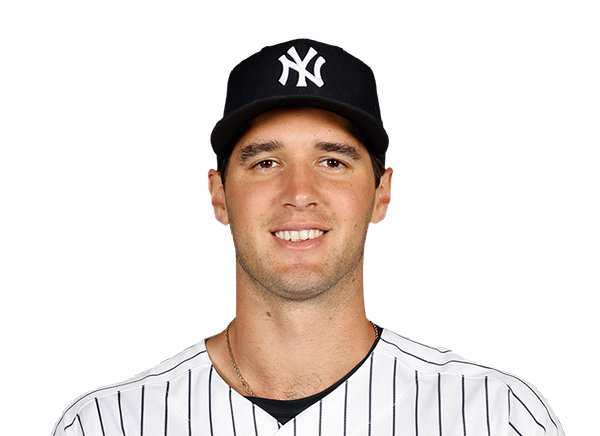 Spencer Jones |
1-3 | 3 | 1 | 1 | 1 | 1 | 0 | 1 | 16 | .238 | .308 | .431 |
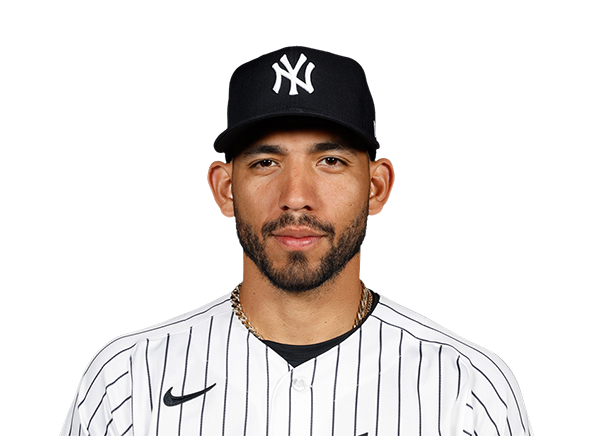 Jose Caballero |
0-3 | 3 | 0 | 0 | 0 | 0 | 0 | 2 | 11 | .239 | .294 | .378 |
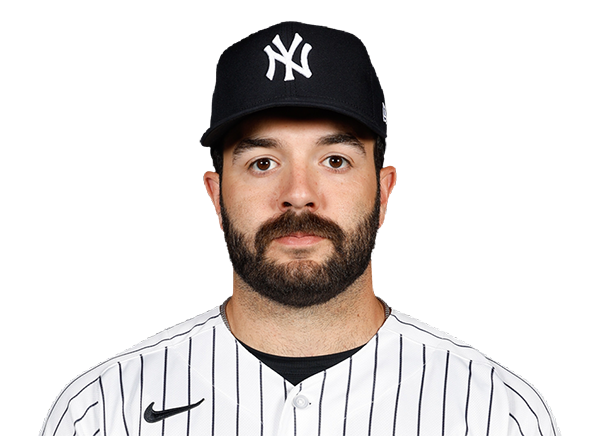 Austin Wells |
0-3 | 3 | 0 | 0 | 0 | 0 | 0 | 1 | 7 | .182 | .275 | .312 |
Los Angeles Angels
| Player | H-AB | AB | R | H | RBI | HR | BB | K | #P | AVG | OBP | SLG |
|---|---|---|---|---|---|---|---|---|---|---|---|---|
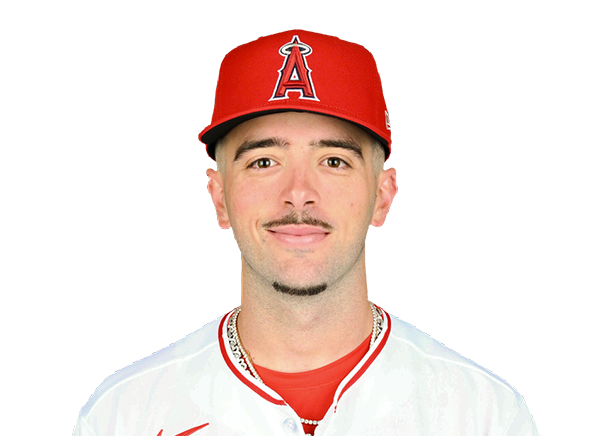 Zach Neto |
1-4 | 4 | 2 | 1 | 1 | 0 | 1 | 2 | 24 | .236 | .318 | .432 |
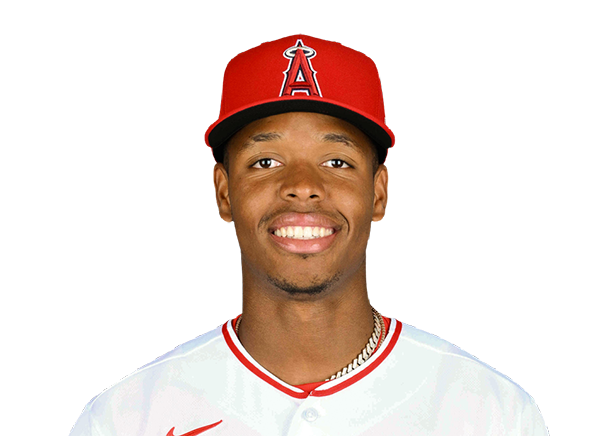 Denzer Guzman |
0-0 | 0 | 0 | 0 | 0 | 0 | 0 | 0 | 0 | .218 | .263 | .341 |
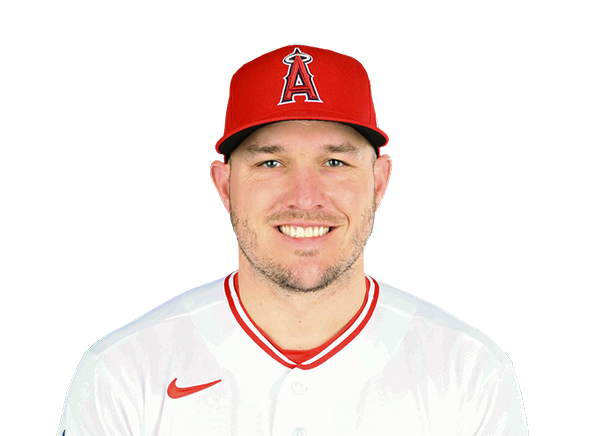 Mike Trout |
2-5 | 5 | 1 | 2 | 2 | 0 | 0 | 1 | 21 | .241 | .379 | .428 |
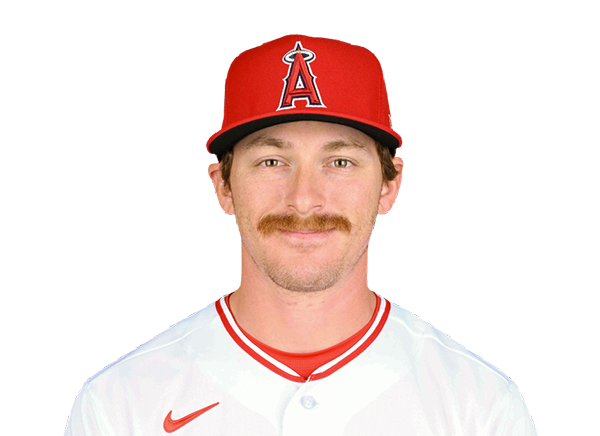 Wade Meckler |
2-3 | 3 | 0 | 2 | 0 | 0 | 2 | 1 | 30 | .294 | .371 | .385 |
 Jose Siri |
0-0 | 0 | 1 | 0 | 0 | 0 | 0 | 0 | 0 | .231 | .292 | .402 |
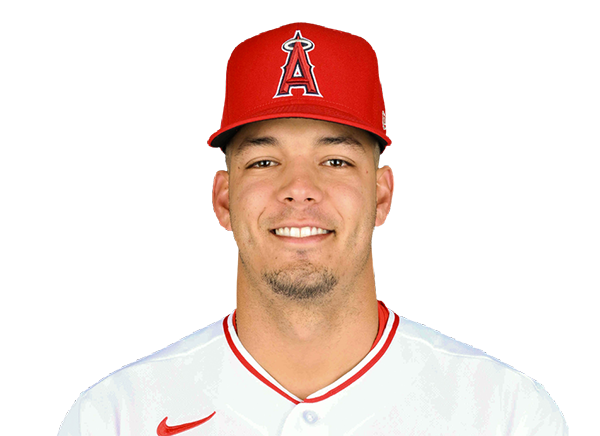 Vaughn Grissom |
3-5 | 5 | 2 | 3 | 4 | 0 | 0 | 0 | 18 | .249 | .311 | .389 |
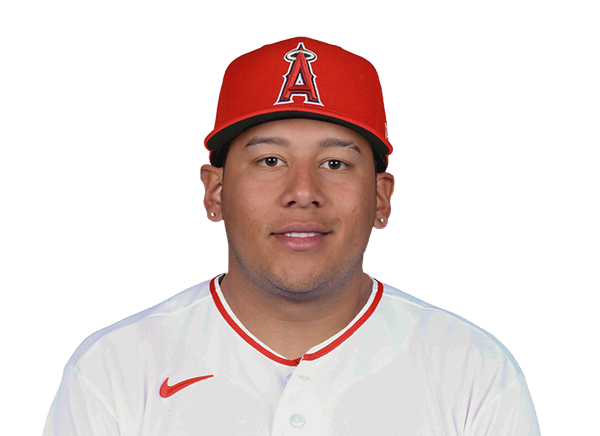 Moises Ballesteros |
0-5 | 5 | 0 | 0 | 0 | 0 | 0 | 3 | 17 | .206 | .271 | .315 |
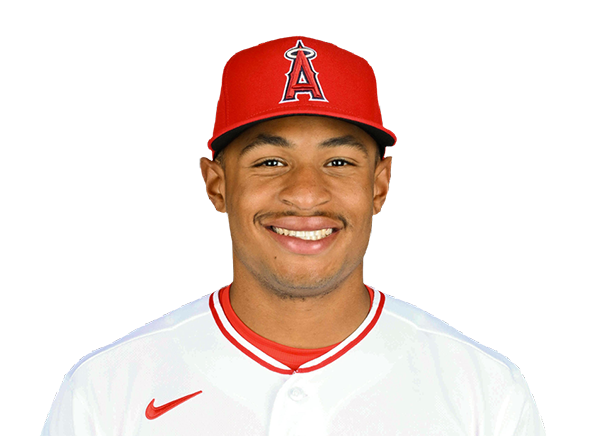 Christian Moore |
2-5 | 5 | 1 | 2 | 2 | 0 | 0 | 1 | 22 | .189 | .267 | .283 |
 Josh Lowe |
1-4 | 4 | 0 | 1 | 0 | 0 | 1 | 1 | 22 | .211 | .273 | .352 |
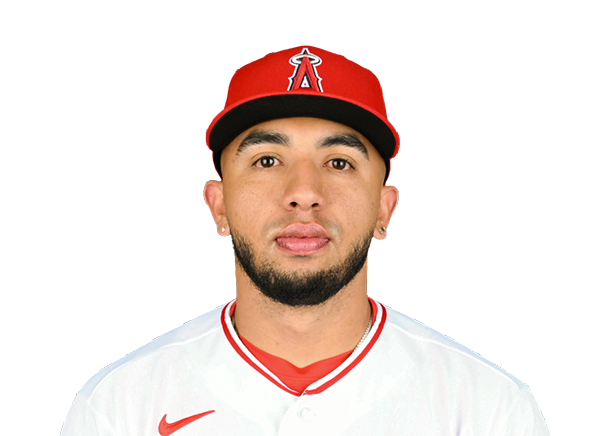 Oswald Peraza |
0-3 | 3 | 1 | 0 | 0 | 0 | 0 | 1 | 18 | .225 | .282 | .344 |
 Tyler Heineman |
1-3 | 3 | 2 | 1 | 0 | 0 | 0 | 0 | 17 | .174 | .226 | .228 |
New York Yankees
| Player | IP | H | R | ER | BB | K | HR | PC-ST | ERA | PC |
|---|---|---|---|---|---|---|---|---|---|---|
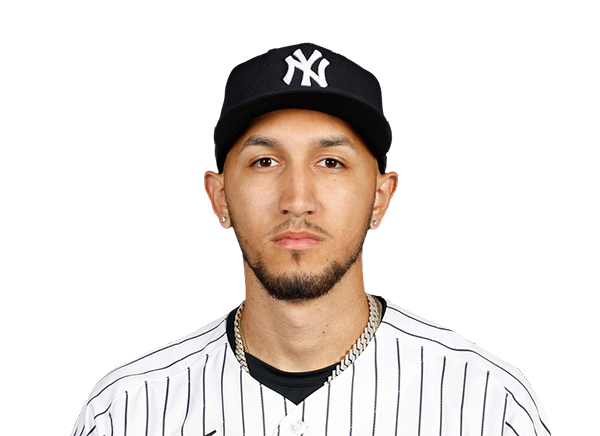 Elmer Rodriguez |
3.2 | 4 | 4 | 4 | 3 | 5 | 0 | 91-51 | 5.40 | 91 |
 Michael Fulmer |
1.1 | 3 | 2 | 1 | 0 | 2 | 0 | 31-22 | 1.42 | 31 |
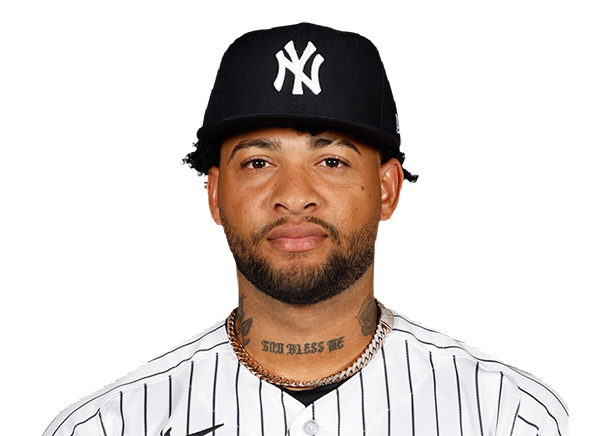 Luis Gil |
2.0 | 1 | 1 | 1 | 1 | 3 | 0 | 39-27 | 5.91 | 39 |
 David Bednar |
1.0 | 4 | 3 | 3 | 0 | 0 | 0 | 28-16 | 2.73 | 28 |
Los Angeles Angels
| Player | IP | H | R | ER | BB | K | HR | PC-ST | ERA | PC |
|---|---|---|---|---|---|---|---|---|---|---|
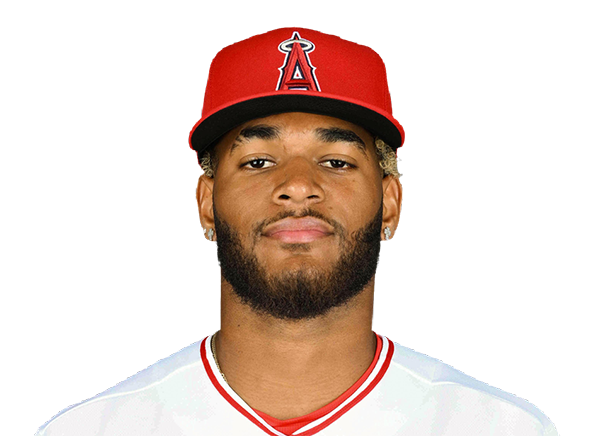 Walbert Urena |
7.0 | 5 | 1 | 1 | 0 | 8 | 1 | 95-68 | 2.85 | 95 |
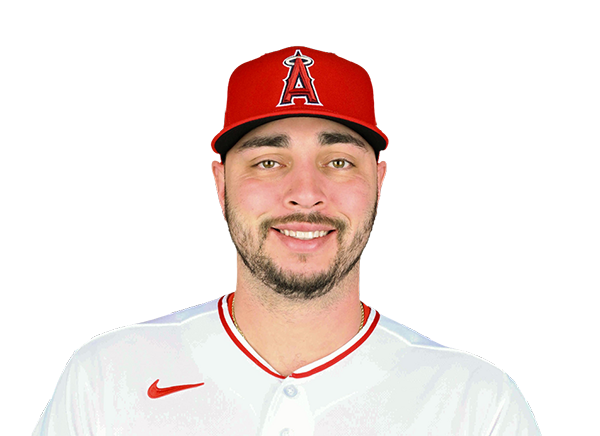 Tayler Saucedo |
1.0 | 0 | 0 | 0 | 0 | 0 | 0 | 8-6 | 3.68 | 8 |
 Blake Weiman |
1.0 | 1 | 0 | 0 | 0 | 2 | 0 | 15-13 | 2.70 | 15 |
H2H / Season Series
LAA10–1
NYY
NYY4–11
LAA
NYY5–4
LAA
NYY1–7
LAA
NYY11–10
LAA
Last 5 Games
| Date | Opponent | Result |
|---|---|---|
| Aug 31 | @ LAA | L1–10 |
| Aug 30 |  vs BOS | W16–1 |
| Aug 29 | vs BOS | W9–2 |
| Aug 29 | vs BOS | L0–6 |
| Aug 28 | vs BOS | W1–0 |
| Date | Opponent | Result |
|---|---|---|
| Aug 31 | vs NYY | W10–1 |
| Aug 30 |  vs PHI | L2–5 |
| Aug 29 | vs PHI | L2–4 |
| Aug 28 | vs PHI | L3–5 |
| Aug 26 |  vs CLE | L3–4 |
Standings
American League
| Team | W | L | PCT | GB | DIFF | STRK |
|---|---|---|---|---|---|---|
1 Rays | 82 | 55 | .599 | - | +53 | L1 |
2 White Sox | 72 | 65 | .526 | 10 | +41 | L2 |
3 Astros | 70 | 68 | .507 | 12.5 | -40 | W2 |
| 4Yankees | 78 | 60 | .565 | 4.5 | +108 | L1 |
| 5Red Sox | 75 | 63 | .543 | 7.5 | +85 | W1 |
| 6Guardians | 69 | 68 | .504 | 13 | -2 | W1 |
7 Orioles | 69 | 69 | .500 | 13.5 | -17 | W4 |
8 Rangers | 68 | 70 | .493 | 14.5 | -44 | W2 |
9 Blue Jays | 68 | 70 | .493 | 14.5 | -50 | W3 |
10 Twins | 66 | 72 | .478 | 16.5 | -46 | W2 |
11 Mariners | 64 | 74 | .464 | 18.5 | -73 | L5 |
12 Tigers | 63 | 74 | .460 | 19 | +55 | L2 |
13 Royals | 62 | 76 | .449 | 20.5 | -83 | L1 |
14 Athletics | 53 | 85 | .384 | 29.5 | -198 | L4 |
| 15Angels | 53 | 85 | .384 | 29.5 | -73 | W1 |
National League
| Team | W | L | PCT | GB | DIFF | STRK |
|---|---|---|---|---|---|---|
1 Brewers | 85 | 53 | .616 | - | +163 | L2 |
2 Dodgers | 82 | 55 | .599 | 2.5 | +153 | W1 |
3 Braves | 82 | 56 | .594 | 3 | +113 | L1 |
4 Cubs | 78 | 60 | .565 | 7 | +141 | W1 |
| 5Phillies | 78 | 60 | .565 | 7 | +31 | W5 |
6 Padres | 73 | 65 | .529 | 12 | +15 | W1 |
7 Diamondbacks | 73 | 66 | .525 | 12.5 | +4 | L2 |
8 Marlins | 69 | 69 | .500 | 16 | +12 | L1 |
9 Cardinals | 68 | 70 | .493 | 17 | -15 | L2 |
10 Pirates | 67 | 71 | .486 | 18 | +26 | W2 |
11 Nationals | 66 | 74 | .471 | 20 | +19 | W1 |
12 Reds | 65 | 73 | .471 | 20 | -113 | L1 |
13 Mets | 62 | 76 | .449 | 23 | -52 | W1 |
14 Giants | 57 | 81 | .413 | 28 | -70 | W2 |
15 Rockies | 52 | 86 | .377 | 33 | -143 | L5 |
NYY
VS
LAA
Pitchers
Elmer Rodriguez
Catchers
Austin Wells
Infielders
Luis Garcia Jr.
Amed Rosario
Jazz Chisholm Jr.
Jose Caballero
Outfielders
Cody Bellinger
Trent Grisham
Spencer Jones
Designated Hitters
Ben Rice
Pitchers
Walbert Urena
Catchers
Tyler Heineman
Infielders
Zach Neto
Vaughn Grissom
Christian Moore
Oswald Peraza
Outfielders
Mike Trout
Wade Meckler
Josh Lowe
Designated Hitters
Moises Ballesteros
Yankees
VS
Angels
Batting
138
Team Games Played
138
4553
At Bats
4610
1057
Hits
1081
595
Runs Batted In
541
190
Home Runs
133
135
Stolen Bases
76
.232
Batting Average
.234
623
Runs
565
199
Doubles
209
17
Triples
12
1860
Total Bases
1713
497
Walks
432
1265
Strikeouts
1301
.310
On Base Percentage
.310
.409
Slugging Percentage
.372
.719
OBP Pct + SLG Pct
.682
138
Games Played
138
138
Games Started
138
35
Hit By Pitch
84
0.0
Wins Above Replacement
0.0
0.0
Offensive Wins Above Replacement
0.0
43
Caught Stealing
22
1
Is Qualified
1
593.9
Runs Created
536.7
4.4
Runs Created Per 27 Outs
3.9
.097
Walks Per Plate Appearance
.083
0.39
Walk To Strikeout Ratio
0.33
.176
Isolated Power
.137
.306
Secondary Average
.243
3.99
Pitches Per Plate Appearance
3.92
406
Extra Base Hits
354
5132
Plate Appearances
5181
24.0
At Bats Per Home Run
34.7
8
Sacrifice Hit
25
35
Sacrifice Flies
27
Pitching
138
Team Games Played
138
55
Quality Starts
44
78
Wins
53
60
Losses
85
40
Saves
21
77
Holds
77
1034
Hits
1073
446
Earned runs
576
135
Home Runs
144
420
Walks
564
1235
Strikeouts
1231
9.0
Strikeouts Per 9 Innings
9.1
145.1
Pitches Per Start
152.6
1.18
Walks Plus Hits Per Inning Pitched
1.34
3.26
Earned Run Average
4.25
60
Losses
85
1232.2
Innings pitched
1219.0
.565
Win Percentage
.384
66
Save Opportunities
46
.225
Opponent Batting Average
.235
.296
Opponent's On-base pct.
.325
.365
Opponent's Slugging pct.
.378
.661
Opponent's OPB Pct + SLG Pct
.703
4592
At Bats
4575
198
Doubles
191
19
Triples
17
54
Batters Hit
70
62
Stolen Bases
93
138
Games Played
138
0
Complete Games
0
13
Shutouts
11
32
Wild Pitches
57
491
Runs Batted In
606
3
Balks
3
1232.2
Innings pitched
1219.0
9.0
Strikeouts Per 9 Innings
9.1
18
Caught Stealing
28
138
Games Started
138
0.0
Wins Above Replacement
0.0
1
Is Qualified
1
515
Runs
638
446
Earned Runs
576
1675
Total Bases
1730
Fielding
138
Team Games Played
138
1233
Full Innings
1219
4978
Total Chances
4887
3698
Putouts
3657
1199
Assists
1151
81
Errors
79
199
Double Plays
209
0.984
Fielding Percentage
0.984
35.8
Range Factor
35.5
0.0
Zone Rating
0.0
138
Games Played
138
0
Games Started
0
0.0
Defensive Wins Above Replacement
0.0
1
Qualified
1