

Yankees vs Blue Jays Live Score (14 Aug, 2026)
Game Information
Stage
Standard
Season
2026
First Pitch
Fri, Aug 14, 7:15 pm
Venue
Rogers Centre
Location
Toronto, Ontario
Attendance
42,816
Inning Scores
Home Runs
Ben Rice
32 HR
.256 AVG
76 RBI

Kazuma Okamoto
24 HR
.226 AVG
71 RBI

Batting Average
Cody Bellinger
.259 AVG
.350 OBP
.420 SLG

Ernie Clement
.280 AVG
.306 OBP
.403 SLG

Runs Batted In
Ben Rice
76 RBI
32 HR
.256 AVG
Kazuma Okamoto
71 RBI
24 HR
.226 AVG
Earned Run Average
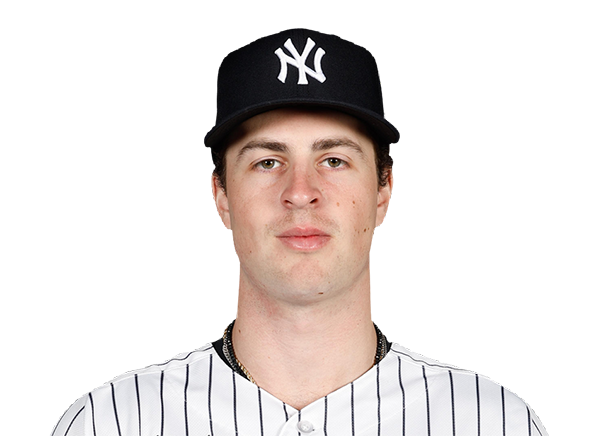
Cam Schlittler
2.21 ERA
10 W
182 K
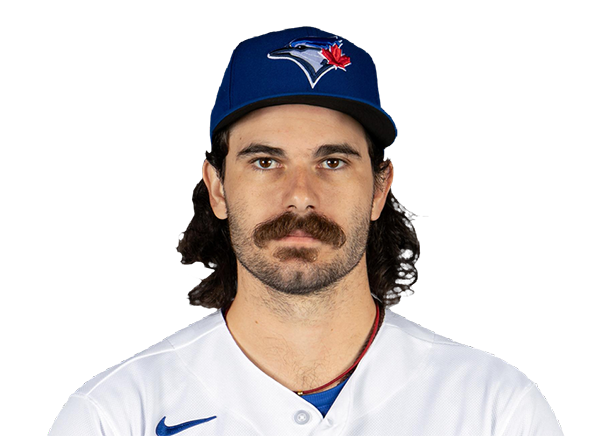
Dylan Cease
2.40 ERA
7 W
191 K
Wins
Cam Schlittler
10 W
2.21 ERA
182 K
Dylan Cease
7 W
2.40 ERA
191 K
Strikeouts
Cam Schlittler
182 K
10 W
2.21 ERA
Dylan Cease
191 K
7 W
2.40 ERA
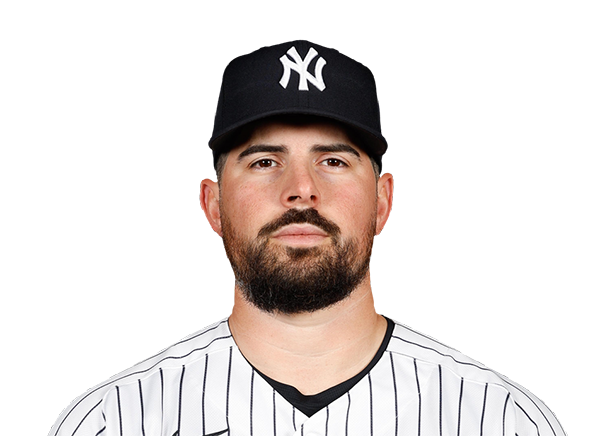
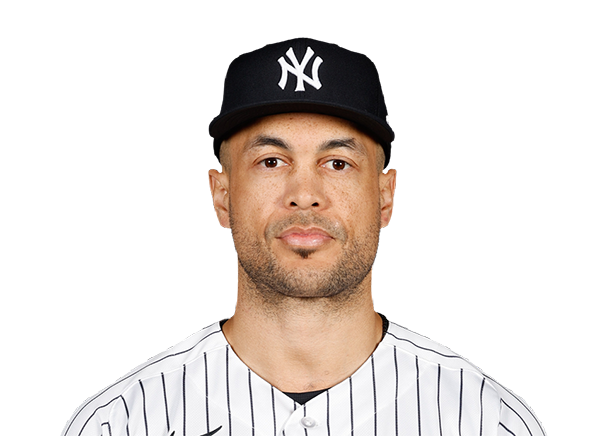
Injury Report

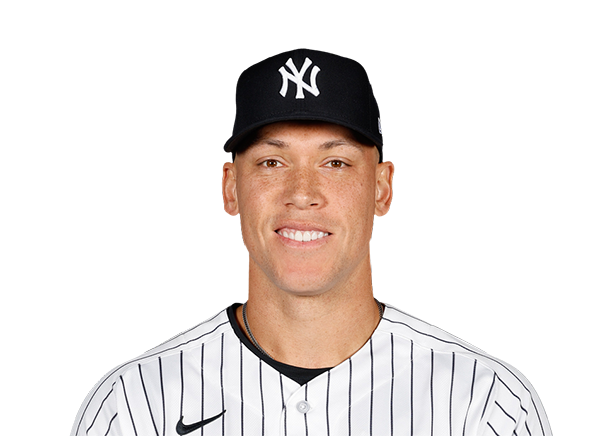
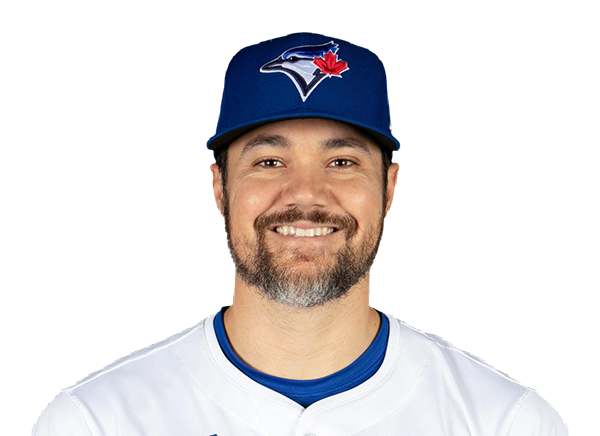



Team Stats
 NYY
TOR

Array
Runs
Array
5
Hits
8
2
Errors
0
—
Home Runs
—
—
Walks
—
—
Strikeouts
—
Standings
American League
| Team | W | L | PCT | GB | DIFF | STRK |
|---|---|---|---|---|---|---|
1 Rays | 76 | 52 | .594 | - | +43 | L2 |
2 White Sox | 67 | 61 | .523 | 9 | +47 | W1 |
3 Astros | 65 | 64 | .504 | 11.5 | -42 | W1 |
| 4Yankees | 73 | 56 | .566 | 3.5 | +95 | L1 |
5 Red Sox | 69 | 59 | .539 | 7 | +97 | W1 |
6 Rangers | 64 | 65 | .496 | 12.5 | -45 | W2 |
| 7Blue Jays | 64 | 67 | .489 | 13.5 | -50 | W1 |
8 Twins | 63 | 66 | .488 | 13.5 | -45 | L1 |
9 Guardians | 63 | 66 | .488 | 13.5 | -15 | W2 |
10 Orioles | 62 | 67 | .481 | 14.5 | -34 | W1 |
11 Tigers | 61 | 67 | .477 | 15 | +79 | L3 |
12 Mariners | 61 | 68 | .473 | 15.5 | -45 | W1 |
13 Royals | 56 | 74 | .431 | 21 | -97 | W6 |
14 Angels | 51 | 78 | .395 | 25.5 | -71 | L1 |
15 Athletics | 49 | 80 | .380 | 27.5 | -189 | L5 |
National League
| Team | W | L | PCT | GB | DIFF | STRK |
|---|---|---|---|---|---|---|
1 Brewers | 81 | 49 | .623 | - | +163 | W3 |
2 Dodgers | 78 | 51 | .605 | 2.5 | +146 | W4 |
3 Braves | 75 | 55 | .577 | 6 | +108 | L2 |
4 Cubs | 74 | 55 | .574 | 6.5 | +99 | L2 |
5 Phillies | 72 | 58 | .554 | 9 | +25 | W8 |
6 Padres | 69 | 60 | .535 | 11.5 | +7 | W1 |
7 Diamondbacks | 68 | 61 | .527 | 12.5 | +13 | W2 |
8 Marlins | 66 | 64 | .508 | 15 | +17 | W2 |
9 Cardinals | 66 | 65 | .504 | 15.5 | 0 | L2 |
10 Pirates | 63 | 67 | .485 | 18 | +30 | L1 |
11 Reds | 61 | 68 | .473 | 19.5 | -98 | L2 |
12 Nationals | 61 | 70 | .466 | 20.5 | +14 | L3 |
13 Mets | 58 | 71 | .450 | 22.5 | -44 | L1 |
14 Giants | 52 | 76 | .406 | 28 | -78 | L2 |
15 Rockies | 50 | 78 | .391 | 30 | -130 | L4 |
NYY
VS
TOR
Pitchers
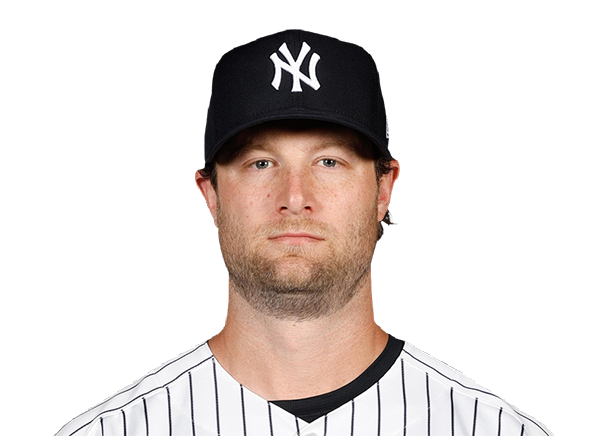
Gerrit Cole
Catchers
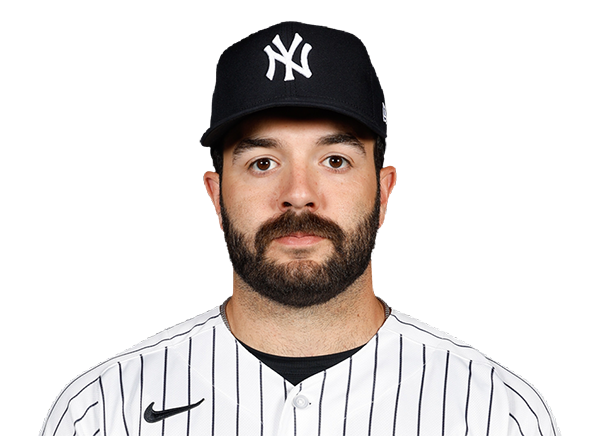
Austin Wells
Infielders
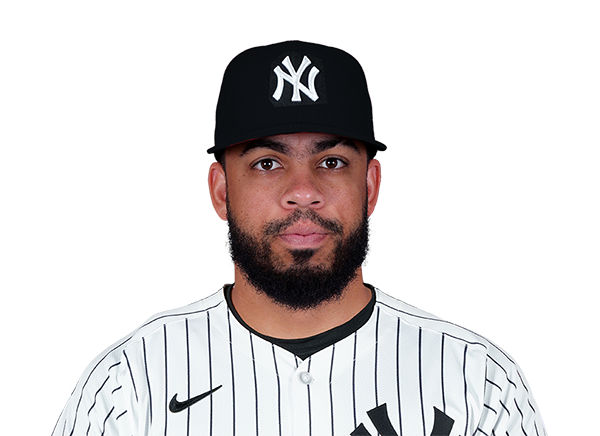
Luis Garcia Jr.

Jazz Chisholm Jr.
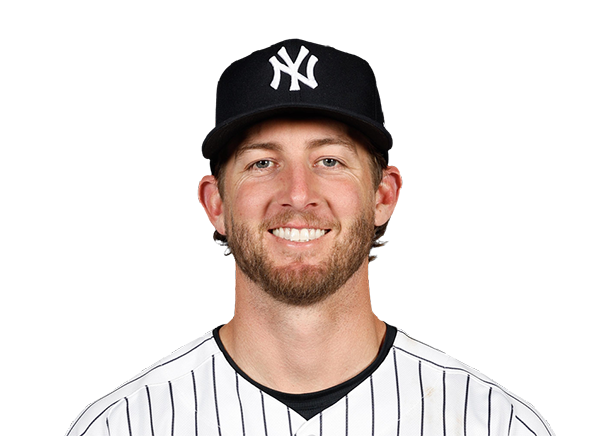
Ryan McMahon
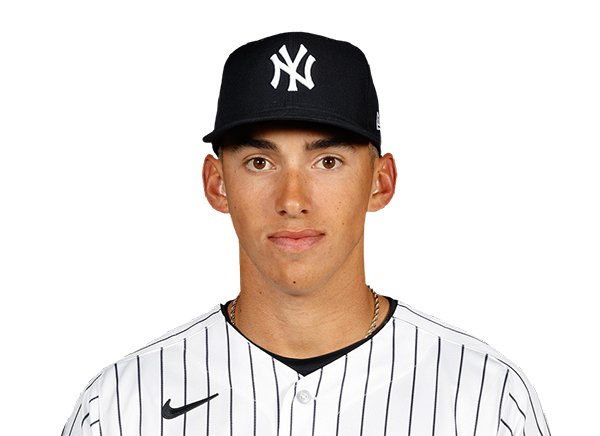
George Lombard Jr.
Outfielders
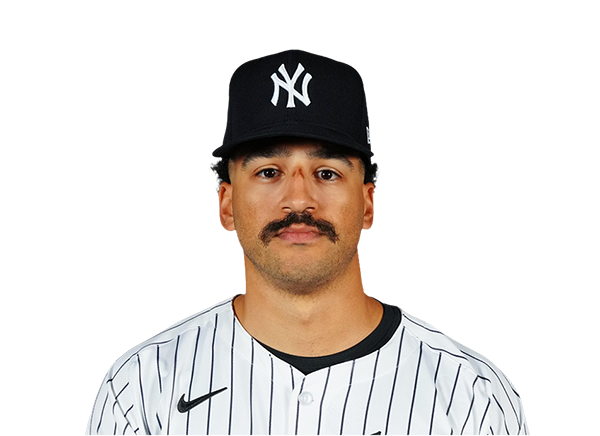
Trent Grisham
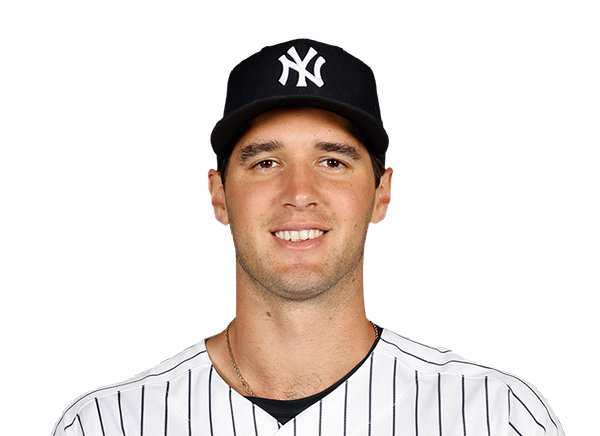
Spencer Jones
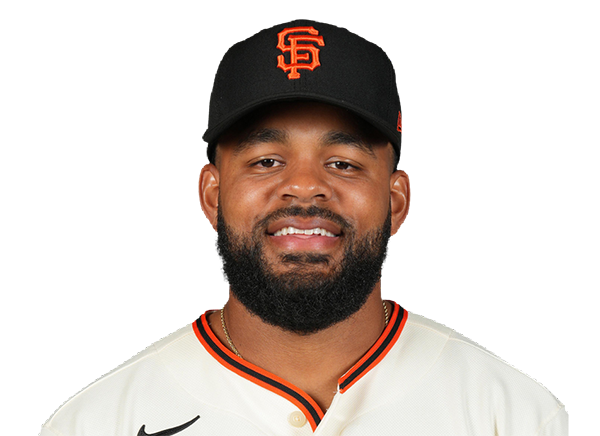
Heliot Ramos
Designated Hitters
Ben Rice
Pitchers
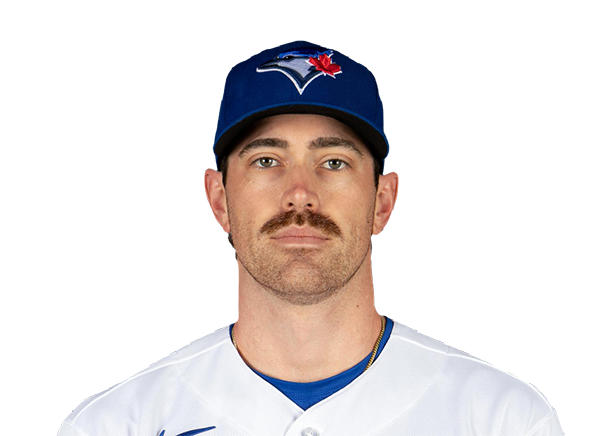
Shane Bieber
Catchers
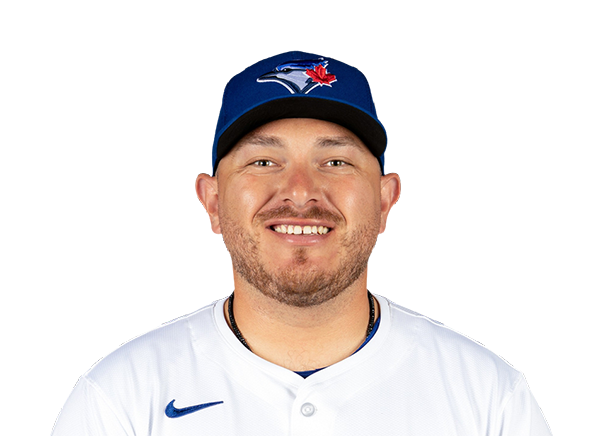
Alejandro Kirk
Infielders
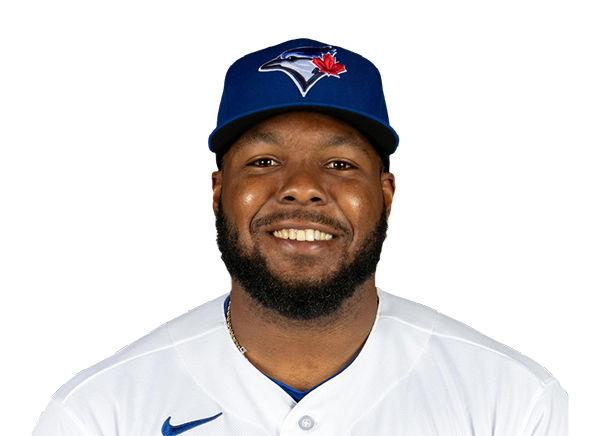
Vladimir Guerrero Jr.
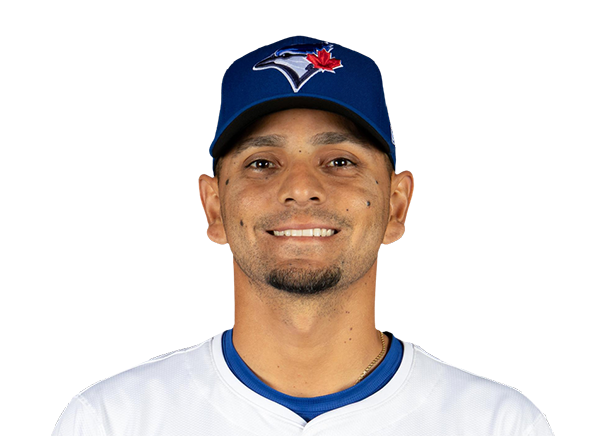
Andres Gimenez
Kazuma Okamoto
Ernie Clement
Outfielders
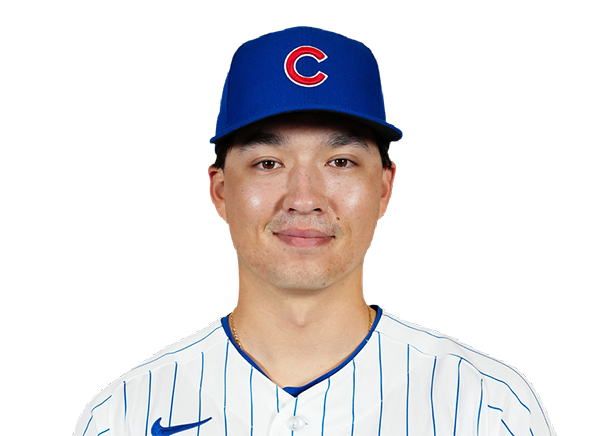
Brett Bateman

Nathan Lukes
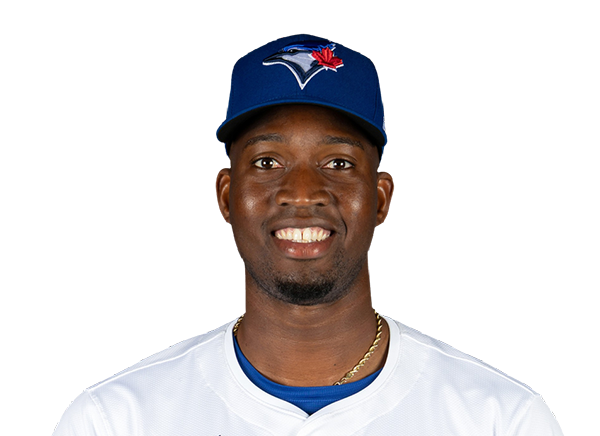
Jesus Sanchez
Designated Hitters
George Springer
Yankees
VS
Blue Jays
Batting
122
Team Games Played
124
4036
At Bats
4166
930
Hits
1008
520
Runs Batted In
463
170
Home Runs
116
115
Stolen Bases
59
.230
Batting Average
.242
546
Runs
485
186
Doubles
192
15
Triples
7
1656
Total Bases
1562
444
Walks
339
1114
Strikeouts
902
.309
On Base Percentage
.303
.410
Slugging Percentage
.375
.719
OBP Pct + SLG Pct
.678
122
Games Played
124
122
Games Started
124
28
Hit By Pitch
45
0.0
Wins Above Replacement
0.0
0.0
Offensive Wins Above Replacement
0.0
37
Caught Stealing
14
1
Is Qualified
1
525.8
Runs Created
475.8
4.4
Runs Created Per 27 Outs
3.9
.098
Walks Per Plate Appearance
.074
0.40
Walk To Strikeout Ratio
0.38
.180
Isolated Power
.133
.309
Secondary Average
.225
3.99
Pitches Per Plate Appearance
3.80
371
Extra Base Hits
315
4545
Plate Appearances
4607
23.7
At Bats Per Home Run
35.9
6
Sacrifice Hit
17
27
Sacrifice Flies
37
Pitching
122
Team Games Played
124
49
Quality Starts
37
68
Wins
60
54
Losses
64
34
Saves
42
65
Holds
82
908
Hits
996
396
Earned runs
489
122
Home Runs
130
373
Walks
458
1099
Strikeouts
1078
9.1
Strikeouts Per 9 Innings
8.8
144.2
Pitches Per Start
149.7
1.18
Walks Plus Hits Per Inning Pitched
1.32
3.27
Earned Run Average
3.99
54
Losses
64
1089.2
Innings pitched
1104.1
.557
Win Percentage
.484
55
Save Opportunities
57
.224
Opponent Batting Average
.240
.295
Opponent's On-base pct.
.317
.364
Opponent's Slugging pct.
.379
.659
Opponent's OPB Pct + SLG Pct
.696
4049
At Bats
4150
170
Doubles
169
15
Triples
9
45
Batters Hit
30
59
Stolen Bases
116
122
Games Played
124
0
Complete Games
1
12
Shutouts
8
27
Wild Pitches
38
439
Runs Batted In
517
3
Balks
5
1089.2
Innings pitched
1104.1
9.1
Strikeouts Per 9 Innings
8.8
18
Caught Stealing
37
122
Games Started
124
0.0
Wins Above Replacement
0.0
1
Is Qualified
1
459
Runs
544
396
Earned Runs
489
1474
Total Bases
1573
Fielding
122
Team Games Played
124
1090
Full Innings
1104
4414
Total Chances
4454
3269
Putouts
3313
1080
Assists
1063
65
Errors
78
186
Double Plays
192
0.985
Fielding Percentage
0.982
35.9
Range Factor
35.7
0.0
Zone Rating
0.0
122
Games Played
124
0
Games Started
0
0.0
Defensive Wins Above Replacement
0.0
1
Qualified
1