

Yankees vs Diamondbacks Live Score (19 Sep, 2026)
Game Information
Stage
STD
Season
2026
First Pitch
Fri, Sep 18, 9:40 pm
Venue
Chase Field
Location
Phoenix, Arizona
Venue Type
Indoor
Broadcast
MLB.TV
Attendance
41,910
Live Situation
1Balls
3Strikes
0Outs
—Pitcher
—At Bat
Pitch Sequence
1
STRIKE LOOKING
Slider
86 MPH
2
BALL
Changeup
90 MPH
3
STRIKE LOOKING
Changeup
89 MPH
4
STRIKE SWINGING
Four-seam FB
97 MPH
Injury Report

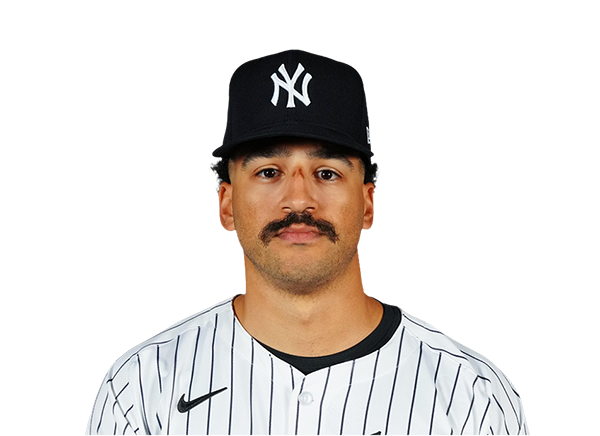
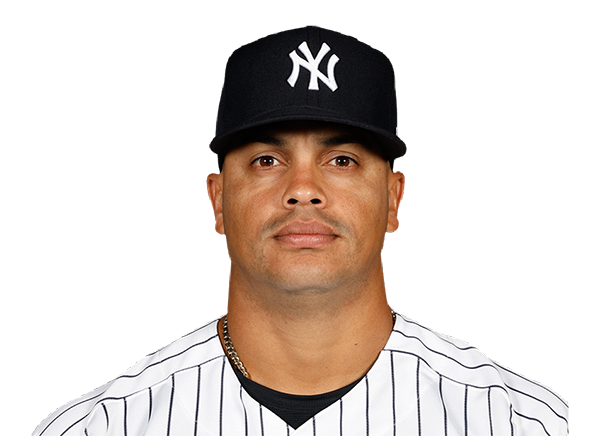
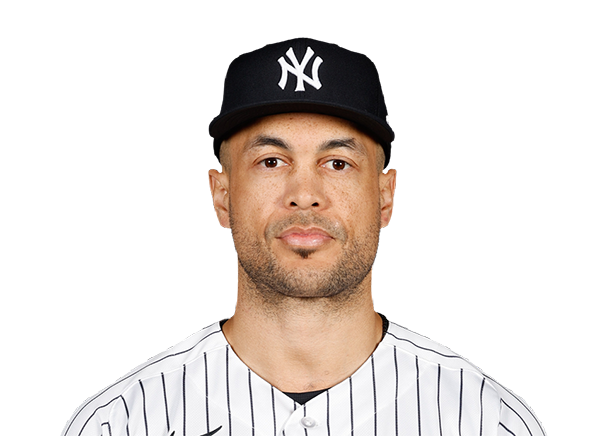
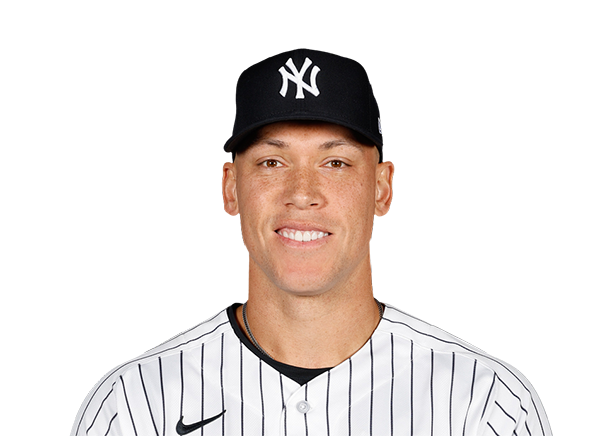




Team Stats
 NYY
ARI


9
Runs
2
8
Hits
7
0
Errors
2
2
Home Runs
1
6
Walks
1
7
Strikeouts
11
Player Box Score
New York Yankees
| Player | H-AB | AB | R | H | RBI | HR | BB | K | #P | AVG | OBP | SLG |
|---|---|---|---|---|---|---|---|---|---|---|---|---|
 Paul Goldschmidt | 1-4 | 4 | 2 | 1 | 0 | 0 | 1 | 0 | 24 | .253 | .316 | .455 |
 Cody Bellinger | 1-5 | 5 | 1 | 1 | 0 | 0 | 0 | 0 | 17 | .273 | .348 | .440 |
 Heliot Ramos | 0-3 | 3 | 2 | 0 | 0 | 0 | 2 | 1 | 26 | .241 | .306 | .397 |
 Ben Rice | 2-3 | 3 | 2 | 2 | 2 | 1 | 2 | 0 | 26 | .264 | .363 | .534 |
 Amed Rosario | 1-3 | 3 | 1 | 1 | 1 | 0 | 0 | 0 | 9 | .235 | .278 | .410 |
 Ryan McMahon | 0-2 | 2 | 0 | 0 | 1 | 0 | 0 | 1 | 10 | .208 | .274 | .344 |
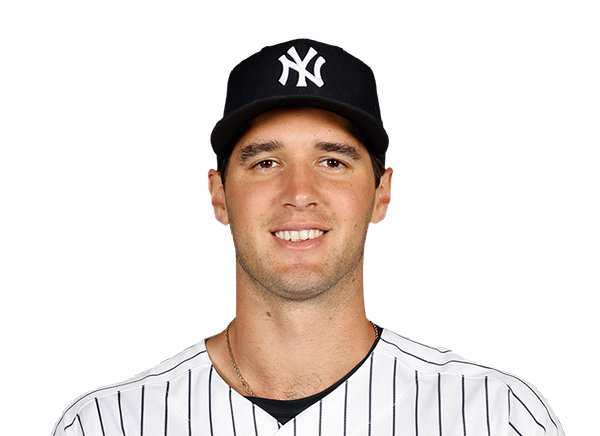 Spencer Jones | 0-4 | 4 | 0 | 0 | 1 | 0 | 0 | 2 | 23 | .248 | .318 | .433 |
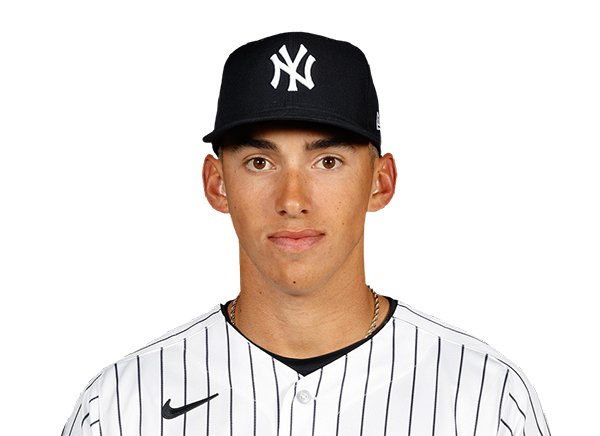 George Lombard Jr. | 2-4 | 4 | 1 | 2 | 3 | 1 | 0 | 0 | 7 | .234 | .292 | .371 |
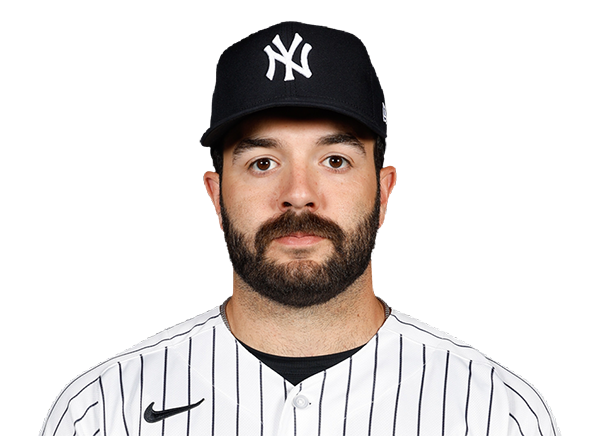 Austin Wells | 1-3 | 3 | 0 | 1 | 0 | 0 | 1 | 1 | 17 | .180 | .279 | .314 |
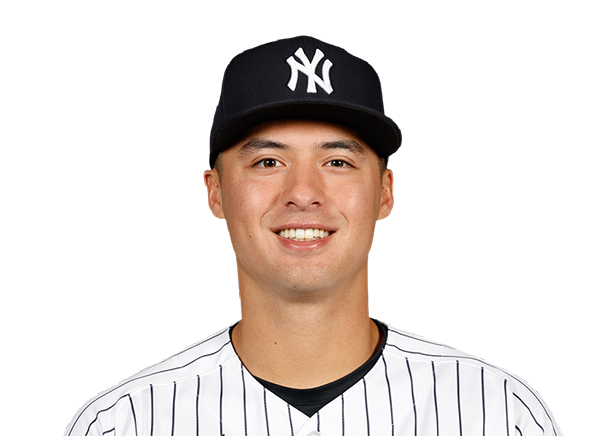 Anthony Volpe | 0-4 | 4 | 0 | 0 | 0 | 0 | 0 | 2 | 15 | .247 | .327 | .343 |
Arizona Diamondbacks
| Player | H-AB | AB | R | H | RBI | HR | BB | K | #P | AVG | OBP | SLG |
|---|---|---|---|---|---|---|---|---|---|---|---|---|
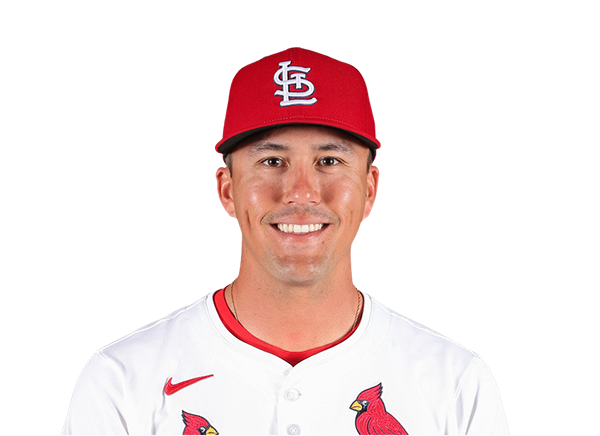 Lars Nootbaar | 0-4 | 4 | 0 | 0 | 0 | 0 | 0 | 2 | 15 | .235 | .339 | .373 |
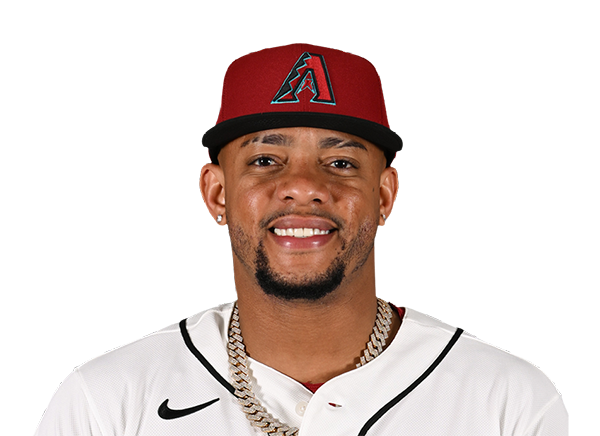 Ketel Marte | 0-4 | 4 | 0 | 0 | 0 | 0 | 0 | 1 | 18 | .249 | .314 | .439 |
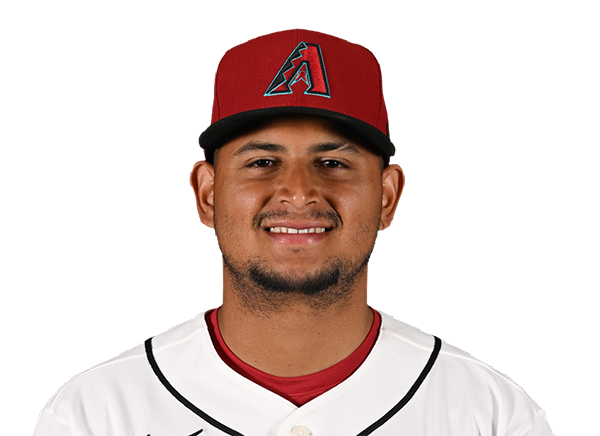 Gabriel Moreno | 0-4 | 4 | 0 | 0 | 0 | 0 | 0 | 1 | 11 | .304 | .382 | .481 |
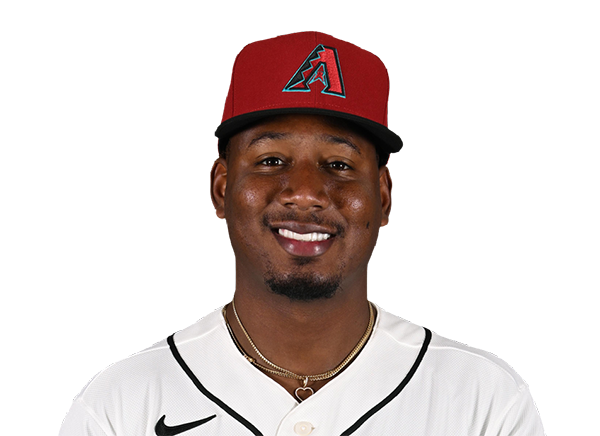 Geraldo Perdomo | 2-3 | 3 | 1 | 2 | 0 | 0 | 1 | 0 | 22 | .254 | .363 | .363 |
 Pavin Smith | 0-2 | 2 | 0 | 0 | 0 | 0 | 0 | 1 | 10 | .163 | .243 | .250 |
 Ildemaro Vargas | 0-2 | 2 | 0 | 0 | 0 | 0 | 0 | 1 | 9 | .251 | .293 | .378 |
 Nolan Arenado | 2-4 | 4 | 0 | 2 | 0 | 0 | 0 | 0 | 14 | .245 | .321 | .450 |
 Corbin Carroll | 2-4 | 4 | 1 | 2 | 2 | 1 | 0 | 0 | 16 | .240 | .331 | .473 |
 Jesus Sanchez | 1-2 | 2 | 0 | 1 | 0 | 0 | 0 | 1 | 5 | .261 | .317 | .413 |
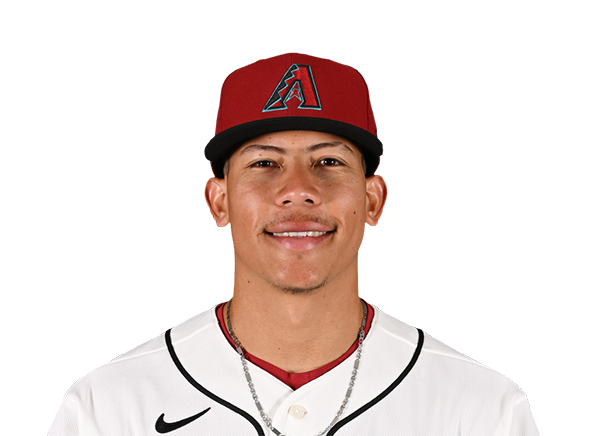 Jose Fernandez | 0-2 | 2 | 0 | 0 | 0 | 0 | 0 | 2 | 10 | .260 | .303 | .352 |
 Tim Tawa | 0-3 | 3 | 0 | 0 | 0 | 0 | 0 | 2 | 17 | .239 | .298 | .394 |
New York Yankees
| Player | IP | H | R | ER | BB | K | HR | PC-ST | ERA | PC |
|---|---|---|---|---|---|---|---|---|---|---|
 Gerrit Cole | 6.0 | 4 | 2 | 2 | 0 | 6 | 1 | 90-62 | 3.63 | 90 |
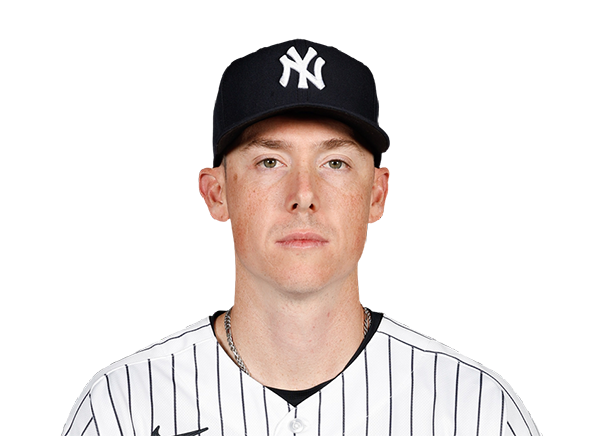 Ryan Yarbrough | 1.1 | 2 | 0 | 0 | 0 | 2 | 0 | 26-17 | 3.60 | 26 |
 Michael Fulmer | 0.2 | 0 | 0 | 0 | 0 | 1 | 0 | 8-6 | 1.59 | 8 |
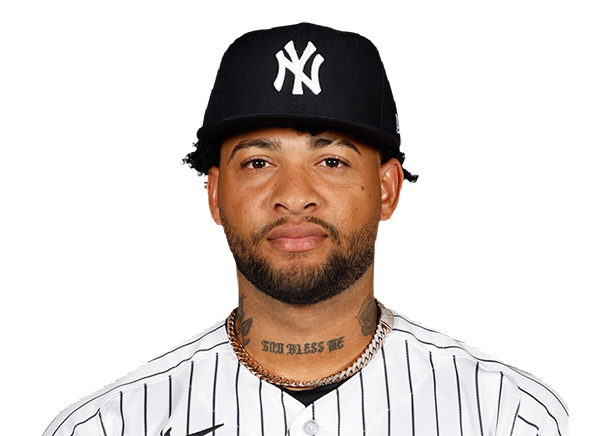 Luis Gil | 1.0 | 1 | 0 | 0 | 1 | 2 | 0 | 23-15 | 5.18 | 23 |
Arizona Diamondbacks
| Player | IP | H | R | ER | BB | K | HR | PC-ST | ERA | PC |
|---|---|---|---|---|---|---|---|---|---|---|
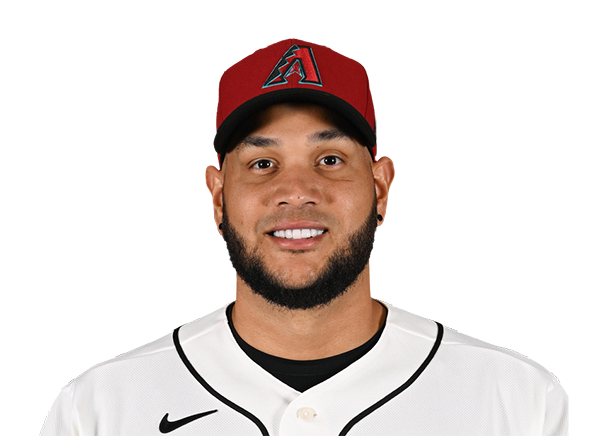 Eduardo Rodriguez | 5.1 | 5 | 7 | 7 | 4 | 5 | 2 | 103-66 | 2.89 | 103 |
 Taylor Clarke | 0.2 | 1 | 0 | 0 | 0 | 0 | 0 | 3-3 | 2.69 | 3 |
 Zac Gallen | 3.0 | 2 | 2 | 1 | 2 | 2 | 0 | 68-41 | 6.12 | 68 |
H2H / Season Series
ARI2–9
NYY
Last 5 Games
| Date | Opponent | Result |
|---|---|---|
| Sep 18 | @ ARI | W9–2 |
| Sep 16 |  @ MIN | L4–5 |
| Sep 15 | @ MIN | W8–1 |
| Sep 14 | @ MIN | W8–3 |
| Sep 13 |  vs NYM | W2–0 |
| Date | Opponent | Result |
|---|---|---|
| Sep 18 | vs NYY | L2–9 |
| Sep 16 |  vs MIA | L3–4 |
| Sep 15 | vs MIA | L2–4 |
| Sep 14 | vs MIA | W8–7 |
| Sep 13 |  vs TEX | L6–7 |
Standings
American League
| Team | W | L | PCT | GB | DIFF | STRK |
|---|---|---|---|---|---|---|
1 Rays | 93 | 60 | .608 | - | +78 | L1 |
2 Guardians | 79 | 75 | .513 | 14.5 | -5 | W3 |
3 Astros | 77 | 77 | .500 | 16.5 | -54 | L1 |
| 4Yankees | 89 | 64 | .582 | 4 | +143 | W1 |
5 Red Sox | 84 | 70 | .545 | 9.5 | +85 | W2 |
6 White Sox | 78 | 76 | .506 | 15.5 | +33 | L1 |
| 7Rangers | 77 | 77 | .500 | 16.5 | -33 | W1 |
8 Blue Jays | 76 | 78 | .494 | 17.5 | -43 | L1 |
9 Orioles | 75 | 79 | .487 | 18.5 | -27 | L1 |
10 Tigers | 73 | 81 | .474 | 20.5 | +77 | W1 |
11 Mariners | 72 | 82 | .468 | 21.5 | -55 | W2 |
| 12Twins | 72 | 82 | .468 | 21.5 | -71 | W1 |
13 Royals | 67 | 87 | .435 | 26.5 | -100 | L2 |
14 Athletics | 61 | 93 | .396 | 32.5 | -216 | L4 |
15 Angels | 59 | 95 | .383 | 34.5 | -80 | L1 |
National League
| Team | W | L | PCT | GB | DIFF | STRK |
|---|---|---|---|---|---|---|
1 Brewers | 96 | 58 | .623 | - | +198 | W1 |
2 Dodgers | 94 | 60 | .610 | 2 | +185 | W2 |
3 Braves | 90 | 64 | .584 | 6 | +115 | W1 |
4 Phillies | 85 | 69 | .552 | 11 | +31 | L1 |
5 Cubs | 85 | 69 | .552 | 11 | +141 | L1 |
6 Padres | 85 | 69 | .552 | 11 | +36 | W3 |
| 7Diamondbacks | 80 | 74 | .519 | 16 | -7 | L3 |
8 Pirates | 77 | 77 | .500 | 19 | +27 | W2 |
| 9Marlins | 76 | 78 | .494 | 20 | +2 | L1 |
10 Cardinals | 75 | 79 | .487 | 21 | -22 | L3 |
11 Nationals | 72 | 82 | .468 | 24 | +11 | W1 |
12 Reds | 72 | 82 | .468 | 24 | -152 | W1 |
| 13Mets | 70 | 84 | .455 | 26 | -43 | W1 |
14 Giants | 64 | 90 | .416 | 32 | -76 | L1 |
15 Rockies | 56 | 98 | .364 | 40 | -178 | L3 |
NYY
VS
ARI
Pitchers
Gerrit Cole
Catchers
Austin Wells
Infielders
Paul Goldschmidt
Amed Rosario
George Lombard Jr.
Anthony Volpe
Outfielders
Cody Bellinger
Heliot Ramos
Spencer Jones
Designated Hitters
Ben Rice
Pitchers
Eduardo Rodriguez
Catchers
Gabriel Moreno
Infielders
Ketel Marte
Geraldo Perdomo
Pavin Smith
Nolan Arenado
Outfielders
Lars Nootbaar
Corbin Carroll
Tim Tawa
Designated Hitters
Jesus Sanchez
Yankees
VS
Diamondbacks
Batting
153
Team Games Played
154
5073
At Bats
5170
1193
Hits
1258
674
Runs Batted In
649
211
Home Runs
155
146
Stolen Bases
101
.235
Batting Average
.243
706
Runs
680
216
Doubles
257
18
Triples
36
2078
Total Bases
2052
549
Walks
511
1401
Strikeouts
1139
.312
On Base Percentage
.315
.410
Slugging Percentage
.397
.722
OBP Pct + SLG Pct
.712
153
Games Played
154
153
Games Started
154
37
Hit By Pitch
55
0.0
Wins Above Replacement
0.0
0.0
Offensive Wins Above Replacement
0.0
48
Caught Stealing
24
1
Is Qualified
1
665.3
Runs Created
667.1
4.4
Runs Created Per 27 Outs
4.4
.096
Walks Per Plate Appearance
.088
0.39
Walk To Strikeout Ratio
0.45
.174
Isolated Power
.154
.302
Secondary Average
.267
3.98
Pitches Per Plate Appearance
3.94
445
Extra Base Hits
448
5713
Plate Appearances
5829
24.0
At Bats Per Home Run
33.4
10
Sacrifice Hit
40
39
Sacrifice Flies
50
Pitching
153
Team Games Played
154
63
Quality Starts
53
89
Wins
80
64
Losses
74
44
Saves
37
86
Holds
79
1133
Hits
1293
485
Earned runs
627
157
Home Runs
173
458
Walks
462
1374
Strikeouts
1080
9.0
Strikeouts Per 9 Innings
7.1
145.1
Pitches Per Start
142.1
1.16
Walks Plus Hits Per Inning Pitched
1.28
3.18
Earned Run Average
4.11
64
Losses
74
1371.0
Innings pitched
1372.0
.582
Win Percentage
.519
72
Save Opportunities
54
.223
Opponent Batting Average
.248
.292
Opponent's On-base pct.
.315
.366
Opponent's Slugging pct.
.409
.657
Opponent's OPB Pct + SLG Pct
.724
5091
At Bats
5207
209
Doubles
255
24
Triples
31
55
Batters Hit
63
69
Stolen Bases
93
153
Games Played
154
0
Complete Games
1
14
Shutouts
10
32
Wild Pitches
31
538
Runs Batted In
667
3
Balks
5
1371.0
Innings pitched
1372.0
9.0
Strikeouts Per 9 Innings
7.1
21
Caught Stealing
20
153
Games Started
154
0.0
Wins Above Replacement
0.0
1
Is Qualified
1
563
Runs
687
485
Earned Runs
627
1861
Total Bases
2129
Fielding
153
Team Games Played
154
1371
Full Innings
1372
5530
Total Chances
5504
4113
Putouts
4116
1327
Assists
1326
90
Errors
62
216
Double Plays
257
0.984
Fielding Percentage
0.989
35.7
Range Factor
35.7
0.0
Zone Rating
0.0
153
Games Played
154
0
Games Started
0
0.0
Defensive Wins Above Replacement
0.0
1
Qualified
1