

Yankees vs Padres Live Score (6 Sep, 2026)
Game Information
Stage
STD
Season
2026
First Pitch
Sun, Sep 6, 4:10 pm
Venue
Petco Park
Location
San Diego, California
Venue Type
Outdoor
Broadcast
MLB.TV
Attendance
41,061
Live Situation
3Balls
3Strikes
0Outs
—Pitcher
—At Bat
Pitch Sequence
1
BALL
Slider
88 MPH
2
STRIKE LOOKING
Slider
88 MPH
3
BALL
Slider
89 MPH
4
STRIKE LOOKING
Four-seam FB
100 MPH
5
STRIKE FOUL
Slider
88 MPH
6
BALL
Slider
89 MPH
7
STRIKE LOOKING
Slider
89 MPH
Injury Report
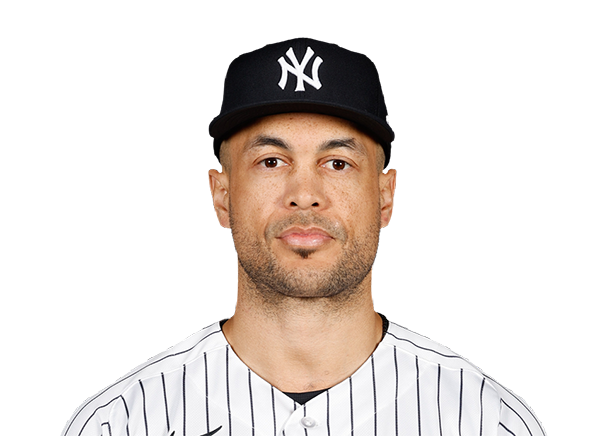
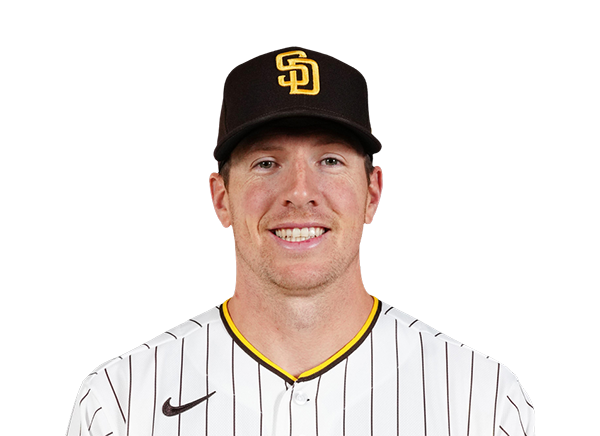

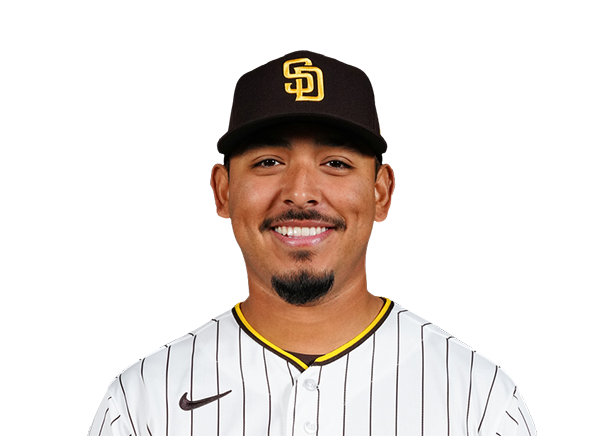


Team Stats
 NYY
SD


3
Runs
4
7
Hits
6
1
Errors
1
0
Home Runs
4
5
Walks
1
9
Strikeouts
3
Player Box Score
New York Yankees
| Player | H-AB | AB | R | H | RBI | HR | BB | K | #P | AVG | OBP | SLG |
|---|---|---|---|---|---|---|---|---|---|---|---|---|
 Ben Rice | 0-4 | 4 | 0 | 0 | 0 | 0 | 1 | 2 | 21 | .259 | .354 | .524 |
 Cody Bellinger | 1-4 | 4 | 1 | 1 | 0 | 0 | 0 | 0 | 11 | .264 | .344 | .412 |
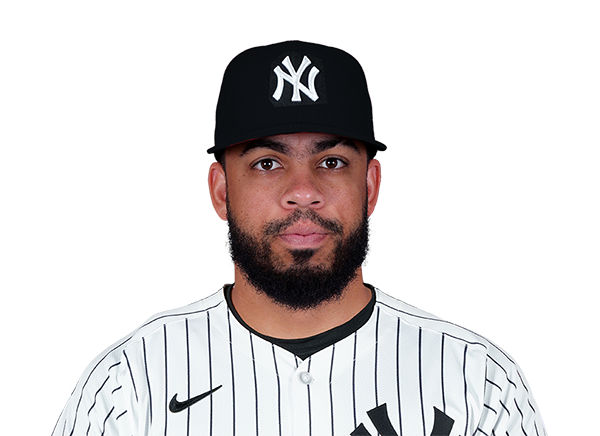 Luis Garcia Jr. | 1-3 | 3 | 0 | 1 | 0 | 0 | 0 | 1 | 7 | .284 | .317 | .542 |
 Paul Goldschmidt | 0-0 | 0 | 1 | 0 | 0 | 0 | 1 | 0 | 4 | .252 | .315 | .457 |
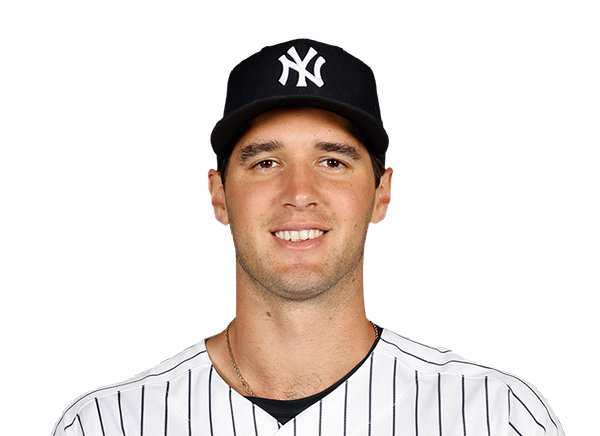 Spencer Jones | 1-3 | 3 | 1 | 1 | 1 | 0 | 1 | 1 | 25 | .246 | .320 | .447 |
 Jazz Chisholm Jr. | 1-3 | 3 | 0 | 1 | 0 | 0 | 0 | 0 | 14 | .230 | .310 | .403 |
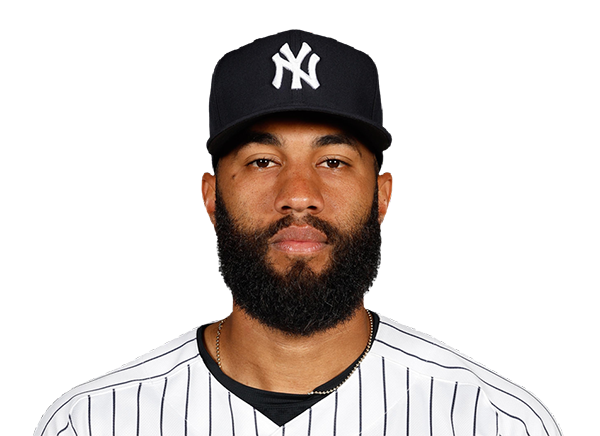 Amed Rosario | 1-1 | 1 | 0 | 1 | 1 | 0 | 0 | 0 | 2 | .238 | .282 | .419 |
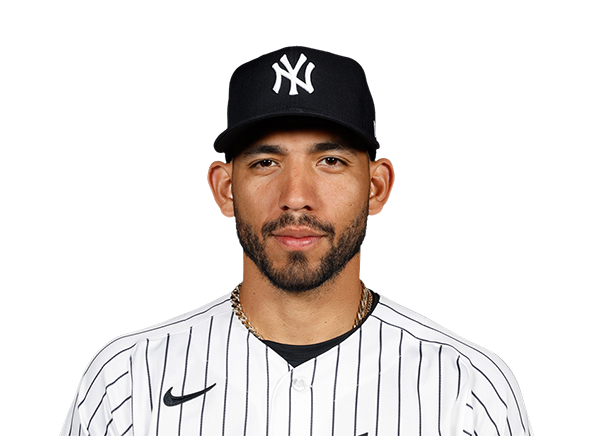 Jose Caballero | 0-0 | 0 | 0 | 0 | 0 | 0 | 0 | 0 | 0 | .235 | .292 | .369 |
 Jasson Dominguez | 1-4 | 4 | 0 | 1 | 0 | 0 | 0 | 0 | 12 | .229 | .269 | .376 |
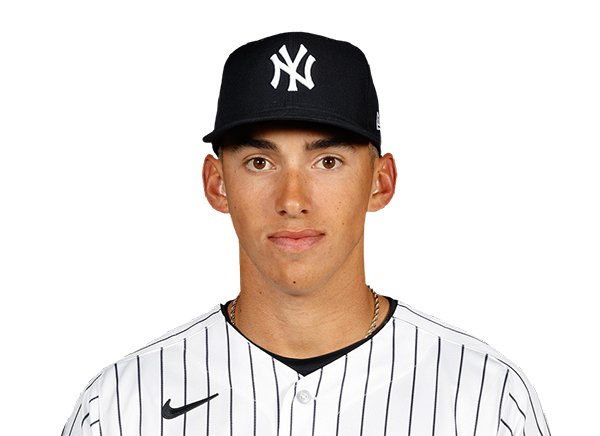 George Lombard Jr. | 1-4 | 4 | 0 | 1 | 0 | 0 | 0 | 2 | 16 | .236 | .293 | .348 |
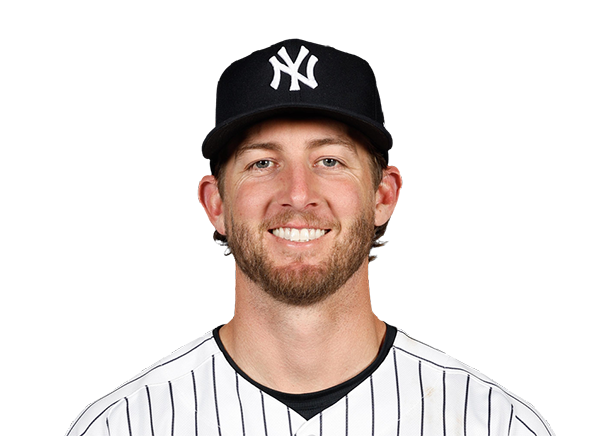 Ryan McMahon | 0-4 | 4 | 0 | 0 | 0 | 0 | 0 | 2 | 14 | .215 | .283 | .360 |
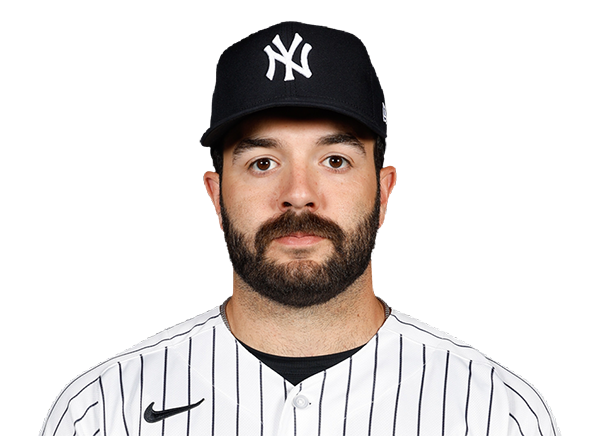 Austin Wells | 0-2 | 2 | 0 | 0 | 0 | 0 | 2 | 1 | 21 | .185 | .279 | .309 |
San Diego Padres
| Player | H-AB | AB | R | H | RBI | HR | BB | K | #P | AVG | OBP | SLG |
|---|---|---|---|---|---|---|---|---|---|---|---|---|
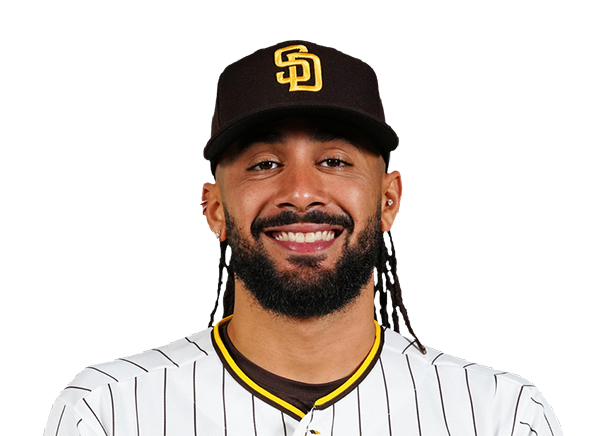 Fernando Tatis Jr. | 1-4 | 4 | 1 | 1 | 1 | 1 | 0 | 0 | 11 | .280 | .347 | .448 |
 Jake Cronenworth | 1-4 | 4 | 1 | 1 | 1 | 1 | 0 | 0 | 21 | .212 | .298 | .296 |
 Manny Machado | 1-3 | 3 | 1 | 1 | 1 | 1 | 1 | 0 | 14 | .221 | .310 | .414 |
 Ty France | 0-3 | 3 | 0 | 0 | 0 | 0 | 0 | 1 | 9 | .290 | .360 | .511 |
 Jackson Merrill | 0-3 | 3 | 0 | 0 | 0 | 0 | 0 | 0 | 9 | .237 | .290 | .411 |
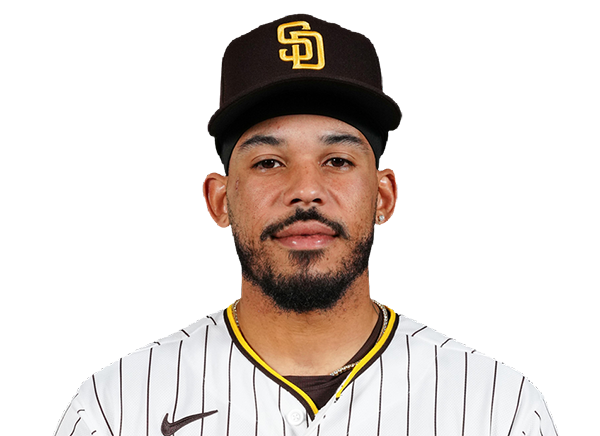 Luis Campusano | 2-3 | 3 | 1 | 2 | 1 | 1 | 0 | 0 | 10 | .285 | .385 | .479 |
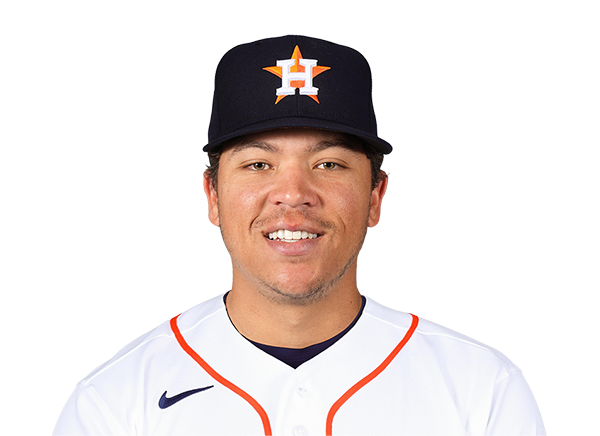 Dustin Harris | 1-3 | 3 | 0 | 1 | 0 | 0 | 0 | 1 | 10 | .292 | .365 | .354 |
 Jase Bowen | 0-0 | 0 | 0 | 0 | 0 | 0 | 0 | 0 | 0 | .167 | .205 | .286 |
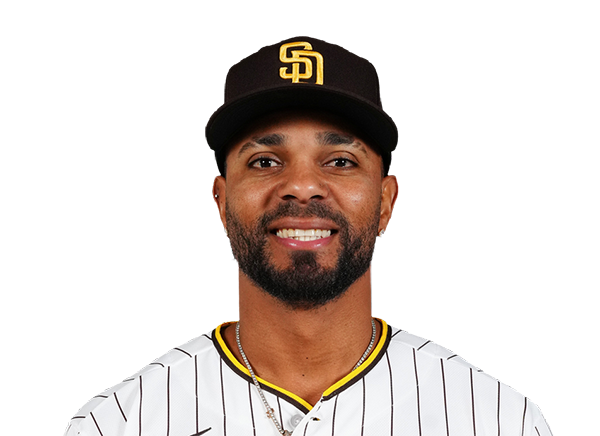 Xander Bogaerts | 0-3 | 3 | 0 | 0 | 0 | 0 | 0 | 0 | 7 | .218 | .318 | .320 |
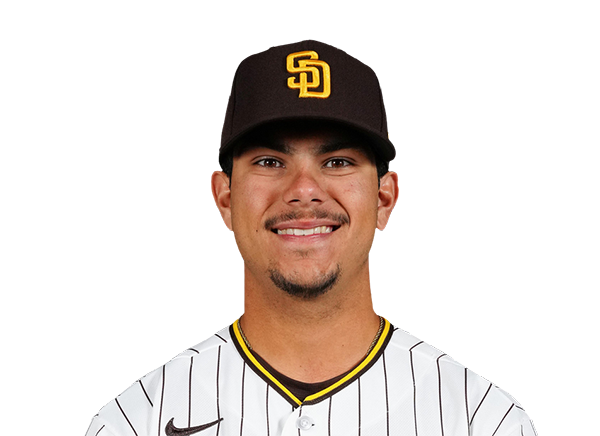 Ethan Salas | 0-3 | 3 | 0 | 0 | 0 | 0 | 0 | 1 | 13 | .000 | .000 | .000 |
New York Yankees
| Player | IP | H | R | ER | BB | K | HR | PC-ST | ERA | PC |
|---|---|---|---|---|---|---|---|---|---|---|
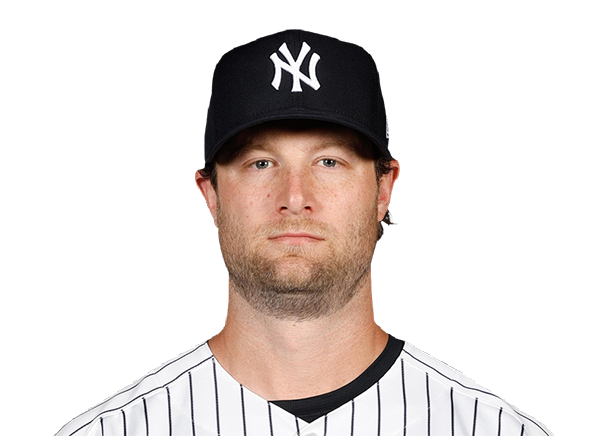 Gerrit Cole | 7.0 | 6 | 4 | 4 | 0 | 3 | 4 | 84-58 | 3.41 | 84 |
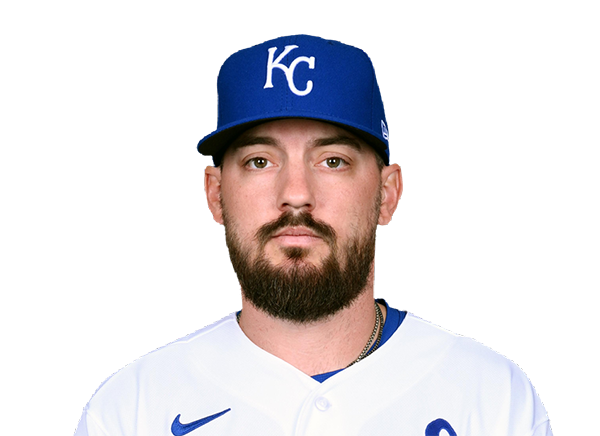 John Schreiber | 1.0 | 0 | 0 | 0 | 1 | 0 | 0 | 20-13 | 3.42 | 20 |
San Diego Padres
| Player | IP | H | R | ER | BB | K | HR | PC-ST | ERA | PC |
|---|---|---|---|---|---|---|---|---|---|---|
 Michael King | 6.0 | 4 | 0 | 0 | 3 | 3 | 0 | 96-54 | 3.00 | 96 |
 Bradgley Rodriguez | 1.0 | 0 | 0 | 0 | 0 | 2 | 0 | 11-9 | 1.96 | 11 |
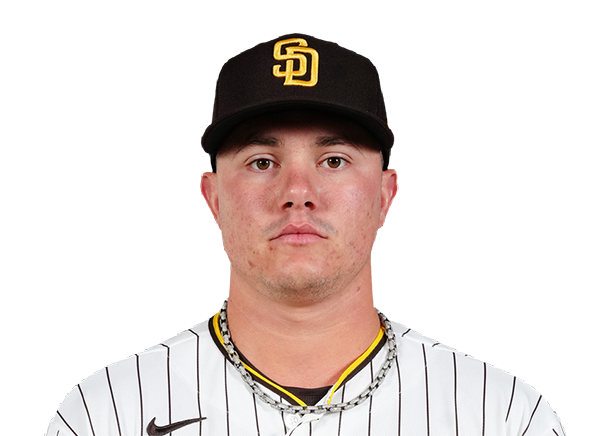 Adrian Morejon | 1.0 | 3 | 3 | 2 | 1 | 1 | 0 | 19-11 | 2.93 | 19 |
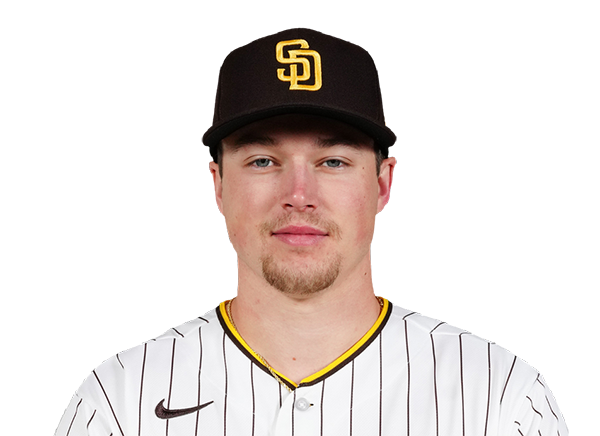 Mason Miller | 1.0 | 0 | 0 | 0 | 1 | 3 | 0 | 21-12 | 1.19 | 21 |
H2H / Season Series
SD4–3
NYY
SD1–5
NYY
SD3–2
NYY
Last 5 Games
| Date | Opponent | Result |
|---|---|---|
| Sep 6 | @ SD | L3–4 |
| Sep 5 | @ SD | W5–1 |
| Sep 4 | @ SD | L2–3 |
| Sep 2 |  @ LAA | W6–3 |
| Sep 1 | @ LAA | W7–3 |
| Date | Opponent | Result |
|---|---|---|
| Sep 6 | vs NYY | W4–3 |
| Sep 5 | vs NYY | L1–5 |
| Sep 4 | vs NYY | W3–2 |
| Sep 2 |  @ CIN | L3–7 |
| Sep 1 | @ CIN | L3–4 |
Standings
American League
| Team | W | L | PCT | GB | DIFF | STRK |
|---|---|---|---|---|---|---|
1 Rays | 85 | 58 | .594 | - | +47 | L1 |
2 White Sox | 75 | 68 | .524 | 10 | +49 | W1 |
3 Astros | 73 | 71 | .507 | 12.5 | -38 | L2 |
| 4Yankees | 81 | 62 | .566 | 4 | +117 | L1 |
5 Red Sox | 79 | 65 | .549 | 6.5 | +86 | W4 |
6 Guardians | 73 | 71 | .507 | 12.5 | -14 | W1 |
7 Blue Jays | 72 | 72 | .500 | 13.5 | -38 | L1 |
8 Rangers | 71 | 73 | .493 | 14.5 | -44 | W1 |
9 Orioles | 69 | 75 | .479 | 16.5 | -29 | L6 |
10 Twins | 68 | 75 | .476 | 17 | -48 | L1 |
11 Mariners | 67 | 77 | .465 | 18.5 | -71 | W1 |
12 Tigers | 65 | 78 | .455 | 20 | +50 | L1 |
13 Royals | 64 | 80 | .444 | 21.5 | -88 | W1 |
14 Athletics | 57 | 87 | .396 | 28.5 | -188 | L1 |
| 15Angels | 54 | 89 | .378 | 31 | -77 | L1 |
National League
| Team | W | L | PCT | GB | DIFF | STRK |
|---|---|---|---|---|---|---|
1 Brewers | 88 | 56 | .611 | - | +168 | L2 |
2 Dodgers | 86 | 57 | .601 | 1.5 | +152 | W4 |
3 Braves | 85 | 58 | .594 | 2.5 | +120 | W1 |
4 Cubs | 81 | 63 | .563 | 7 | +132 | L1 |
5 Phillies | 80 | 63 | .559 | 7.5 | +34 | L1 |
6 Diamondbacks | 76 | 68 | .528 | 12 | -1 | W2 |
| 7Padres | 75 | 68 | .524 | 12.5 | +8 | W1 |
8 Marlins | 72 | 72 | .500 | 16 | +15 | W1 |
9 Cardinals | 72 | 72 | .500 | 16 | -9 | W1 |
10 Pirates | 71 | 73 | .493 | 17 | +26 | W1 |
| 11Reds | 69 | 74 | .483 | 18.5 | -105 | W2 |
12 Nationals | 67 | 78 | .462 | 21.5 | +9 | L4 |
13 Mets | 65 | 78 | .455 | 22.5 | -48 | W1 |
14 Giants | 59 | 85 | .410 | 29 | -75 | L1 |
15 Rockies | 55 | 88 | .385 | 32.5 | -140 | L1 |
NYY
VS
SD
Pitchers
Gerrit Cole
Catchers
Austin Wells
Infielders
Luis Garcia Jr.
Jazz Chisholm Jr.
George Lombard Jr.
Ryan McMahon
Outfielders
Cody Bellinger
Spencer Jones
Jasson Dominguez
Designated Hitters
Ben Rice
Pitchers
Michael King
Catchers
Luis Campusano
Infielders
Jake Cronenworth
Manny Machado
Ty France
Xander Bogaerts
Outfielders
Fernando Tatis Jr.
Jackson Merrill
Dustin Harris
Designated Hitters
Ethan Salas
Yankees
VS
Padres
Batting
143
Team Games Played
143
4728
At Bats
4708
1104
Hits
1111
616
Runs Batted In
580
193
Home Runs
159
137
Stolen Bases
140
.234
Batting Average
.236
646
Runs
602
204
Doubles
204
17
Triples
14
1921
Total Bases
1820
516
Walks
494
1319
Strikeouts
1160
.311
On Base Percentage
.313
.406
Slugging Percentage
.387
.718
OBP Pct + SLG Pct
.700
143
Games Played
143
143
Games Started
143
36
Hit By Pitch
53
0.0
Wins Above Replacement
0.0
0.0
Offensive Wins Above Replacement
0.0
47
Caught Stealing
40
1
Is Qualified
1
614.0
Runs Created
581.7
4.4
Runs Created Per 27 Outs
4.1
.097
Walks Per Plate Appearance
.093
0.39
Walk To Strikeout Ratio
0.43
.173
Isolated Power
.151
.301
Secondary Average
.277
3.98
Pitches Per Plate Appearance
3.92
414
Extra Base Hits
377
5331
Plate Appearances
5318
24.5
At Bats Per Home Run
29.6
9
Sacrifice Hit
22
37
Sacrifice Flies
38
Pitching
143
Team Games Played
143
56
Quality Starts
33
81
Wins
75
62
Losses
68
40
Saves
41
80
Holds
87
1062
Hits
1146
458
Earned runs
550
143
Home Runs
156
430
Walks
489
1277
Strikeouts
1162
9.0
Strikeouts Per 9 Innings
8.3
144.7
Pitches Per Start
147.0
1.17
Walks Plus Hits Per Inning Pitched
1.29
3.23
Earned Run Average
3.91
62
Losses
68
1278.0
Innings pitched
1266.1
.566
Win Percentage
.524
67
Save Opportunities
59
.224
Opponent Batting Average
.241
.293
Opponent's On-base pct.
.318
.365
Opponent's Slugging pct.
.389
.658
Opponent's OPB Pct + SLG Pct
.707
4751
At Bats
4750
201
Doubles
201
20
Triples
16
54
Batters Hit
59
66
Stolen Bases
92
143
Games Played
143
0
Complete Games
0
13
Shutouts
11
32
Wild Pitches
38
505
Runs Batted In
572
3
Balks
4
1278.0
Innings pitched
1266.1
9.0
Strikeouts Per 9 Innings
8.3
19
Caught Stealing
48
143
Games Started
143
0.0
Wins Above Replacement
0.0
1
Is Qualified
1
529
Runs
594
458
Earned Runs
550
1732
Total Bases
1847
Fielding
143
Team Games Played
143
1278
Full Innings
1266
5156
Total Chances
5126
3834
Putouts
3799
1239
Assists
1266
83
Errors
61
204
Double Plays
204
0.984
Fielding Percentage
0.988
35.7
Range Factor
36.0
0.0
Zone Rating
0.0
143
Games Played
143
0
Games Started
0
0.0
Defensive Wins Above Replacement
0.0
1
Qualified
1