

Yankees vs Twins Live Score (15 Sep, 2026)
Game Information
Stage
STD
Season
2026
First Pitch
Tue, Sep 15, 7:40 pm
Venue
Target Field
Location
Minneapolis, Minnesota
Venue Type
Outdoor
Broadcast
MLB.TV
Attendance
27,882
Live Situation
0Balls
1Strikes
0Outs
—Pitcher
—At Bat
Pitch Sequence
1
STRIKE LOOKING
Changeup
76 MPH
2
BALL IN PLAY
Changeup
76 MPH
Injury Report
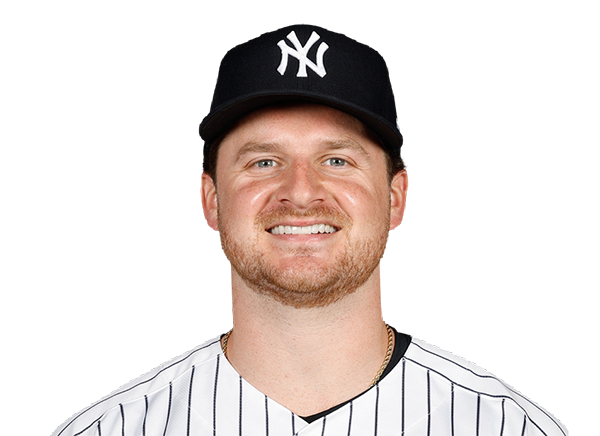
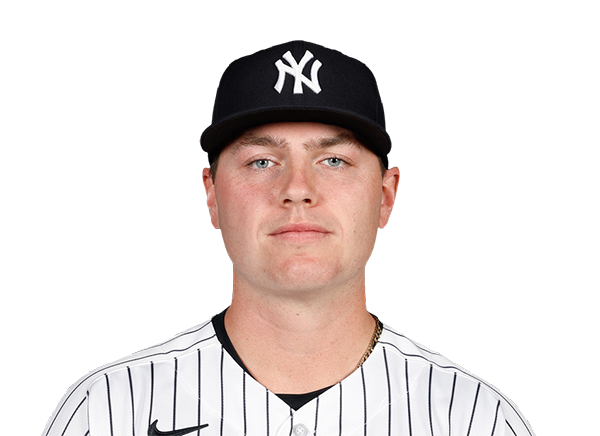
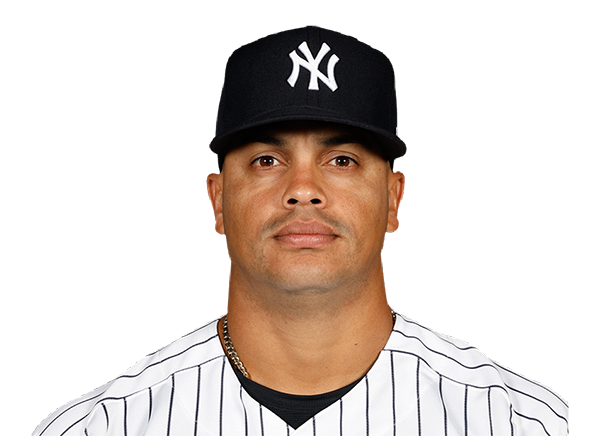
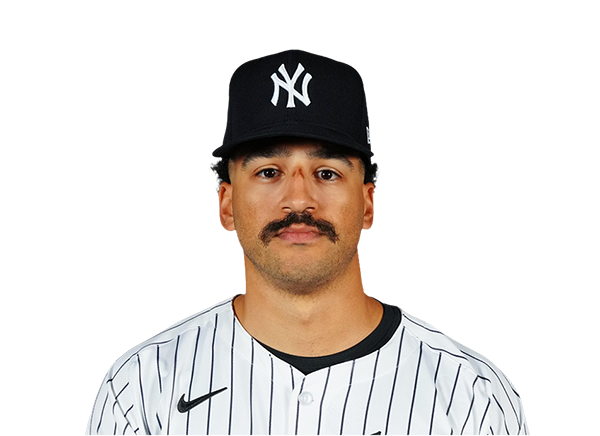

Team Stats
 NYY
MIN


8
Runs
1
14
Hits
7
0
Errors
1
2
Home Runs
0
4
Walks
0
6
Strikeouts
6
Player Box Score
New York Yankees
| Player | H-AB | AB | R | H | RBI | HR | BB | K | #P | AVG | OBP | SLG |
|---|---|---|---|---|---|---|---|---|---|---|---|---|
 Ben Rice | 1-6 | 6 | 2 | 1 | 0 | 0 | 0 | 1 | 35 | .262 | .357 | .525 |
 Cody Bellinger | 3-4 | 4 | 1 | 3 | 2 | 1 | 1 | 1 | 14 | .272 | .347 | .443 |
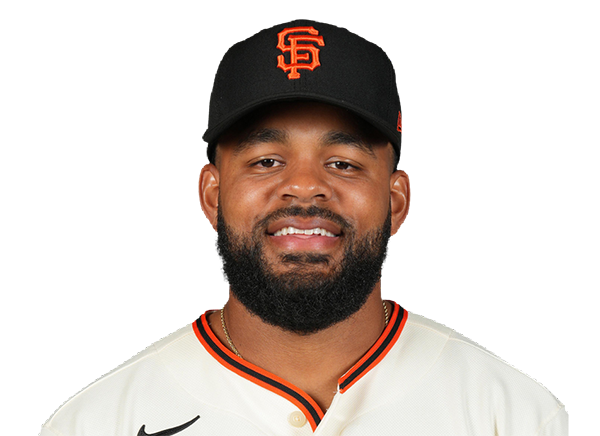 Heliot Ramos | 2-4 | 4 | 2 | 2 | 1 | 0 | 1 | 1 | 16 | .245 | .305 | .403 |
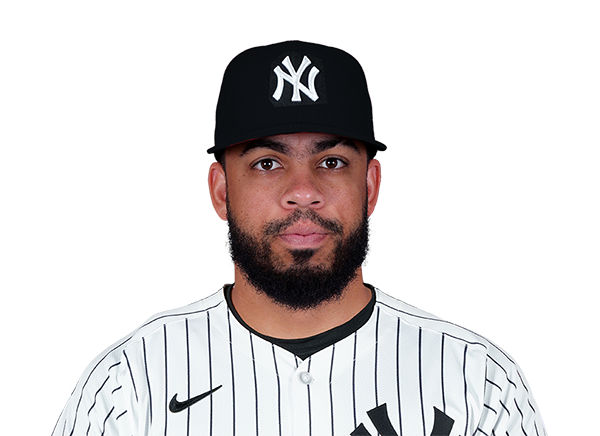 Luis Garcia Jr. | 1-5 | 5 | 1 | 1 | 0 | 0 | 0 | 1 | 18 | .286 | .317 | .543 |
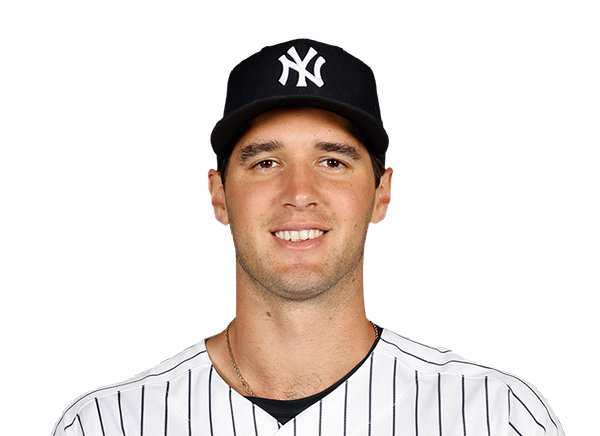 Spencer Jones | 1-5 | 5 | 1 | 1 | 3 | 1 | 0 | 0 | 18 | .259 | .331 | .452 |
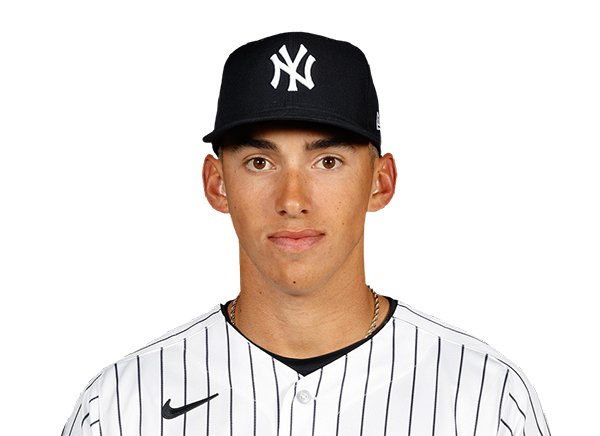 George Lombard Jr. | 2-4 | 4 | 1 | 2 | 1 | 0 | 1 | 0 | 24 | .228 | .291 | .351 |
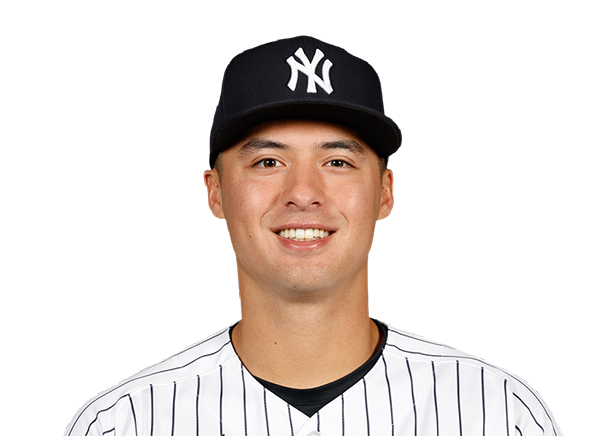 Anthony Volpe | 2-4 | 4 | 0 | 2 | 0 | 0 | 1 | 0 | 18 | .249 | .332 | .344 |
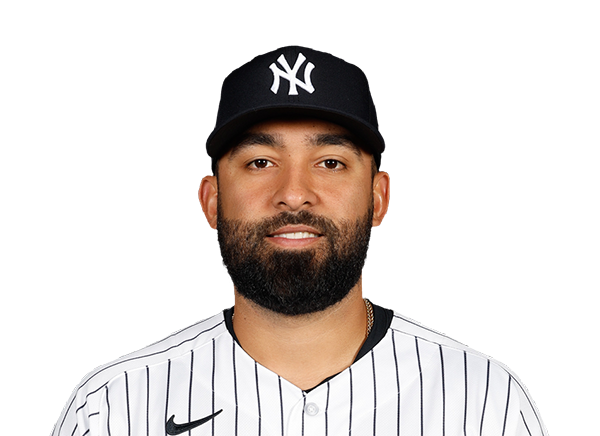 Ali Sanchez | 1-5 | 5 | 0 | 1 | 0 | 0 | 0 | 1 | 9 | .243 | .269 | .311 |
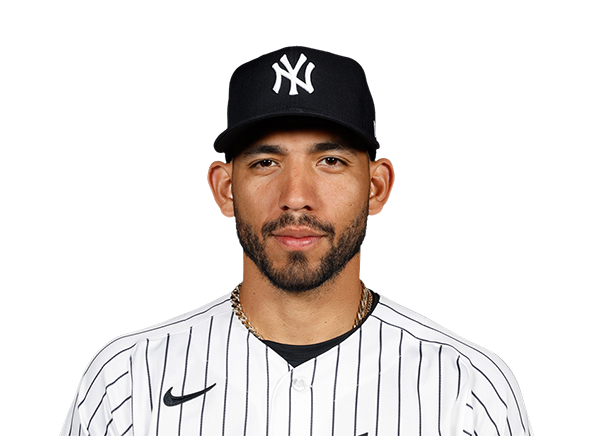 Jose Caballero | 1-5 | 5 | 0 | 1 | 1 | 0 | 0 | 1 | 27 | .234 | .291 | .374 |
Minnesota Twins
| Player | H-AB | AB | R | H | RBI | HR | BB | K | #P | AVG | OBP | SLG |
|---|---|---|---|---|---|---|---|---|---|---|---|---|
 Luke Keaschall | 3-4 | 4 | 0 | 3 | 0 | 0 | 0 | 0 | 19 | .276 | .370 | .387 |
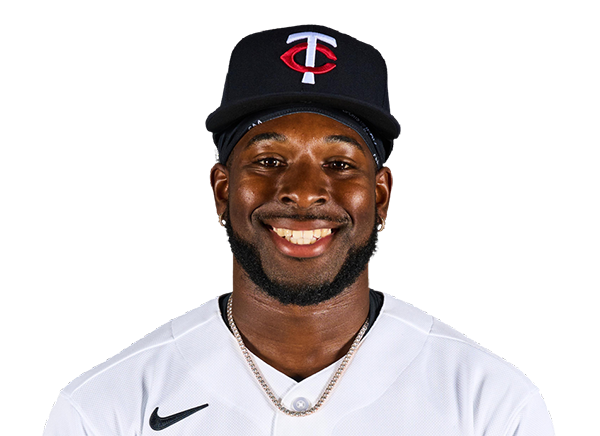 Kaelen Culpepper | 0-3 | 3 | 0 | 0 | 0 | 0 | 0 | 1 | 11 | .275 | .333 | .404 |
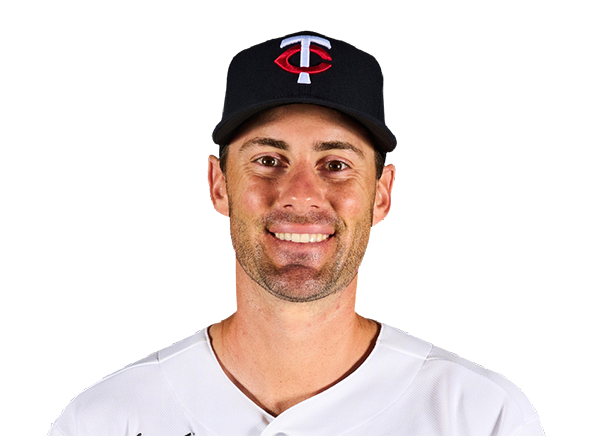 Ryan Kreidler | 0-1 | 1 | 0 | 0 | 0 | 0 | 0 | 0 | 3 | .217 | .278 | .363 |
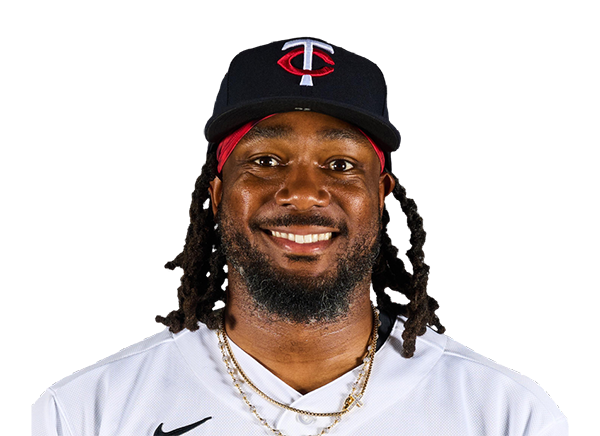 Josh Bell | 0-4 | 4 | 0 | 0 | 0 | 0 | 0 | 0 | 8 | .253 | .317 | .423 |
 Kody Clemens | 1-4 | 4 | 0 | 1 | 0 | 0 | 0 | 0 | 13 | .241 | .301 | .472 |
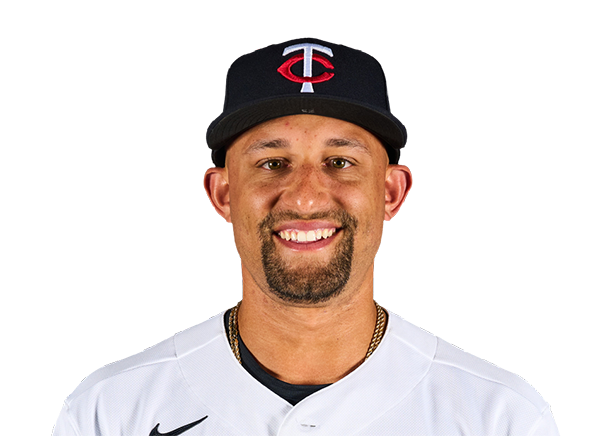 Royce Lewis | 1-4 | 4 | 1 | 1 | 0 | 0 | 0 | 0 | 8 | .230 | .296 | .390 |
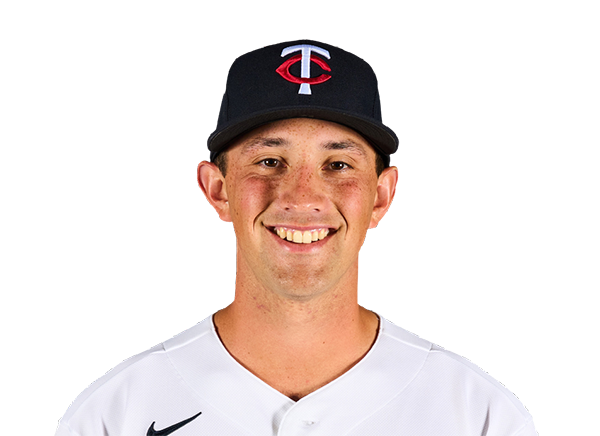 Brooks Lee | 0-3 | 3 | 0 | 0 | 0 | 0 | 0 | 2 | 18 | .245 | .295 | .426 |
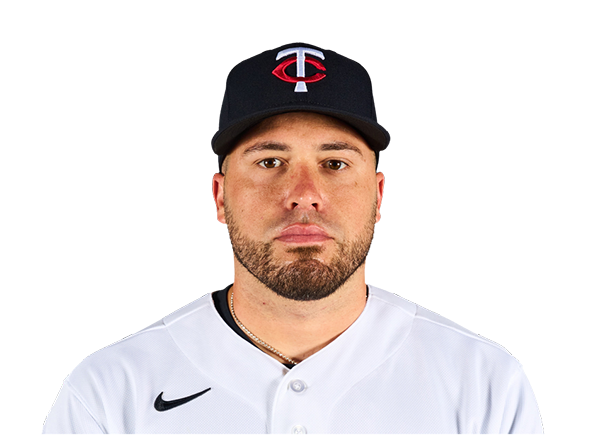 Victor Caratini | 0-3 | 3 | 0 | 0 | 0 | 0 | 0 | 2 | 11 | .218 | .313 | .316 |
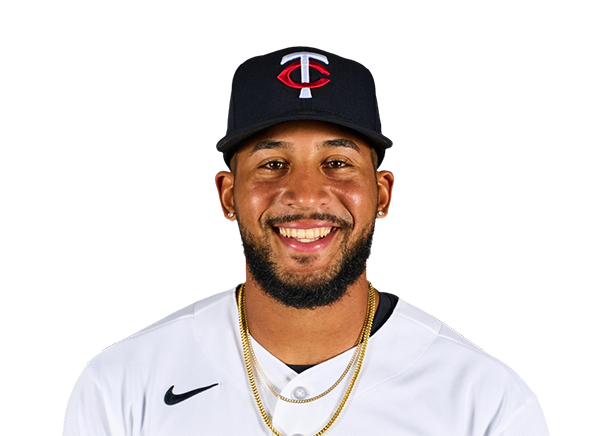 Emmanuel Rodriguez | 2-3 | 3 | 0 | 2 | 1 | 0 | 0 | 0 | 14 | .333 | .333 | .733 |
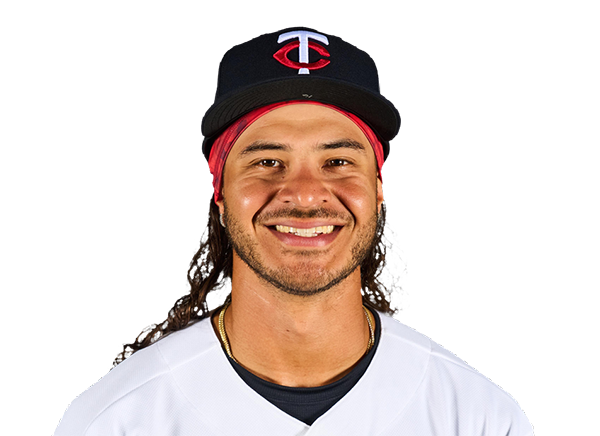 Austin Martin | 0-3 | 3 | 0 | 0 | 0 | 0 | 0 | 1 | 12 | .234 | .348 | .324 |
New York Yankees
| Player | IP | H | R | ER | BB | K | HR | PC-ST | ERA | PC |
|---|---|---|---|---|---|---|---|---|---|---|
 Max Fried | 7.0 | 6 | 1 | 1 | 0 | 6 | 0 | 88-58 | 2.63 | 88 |
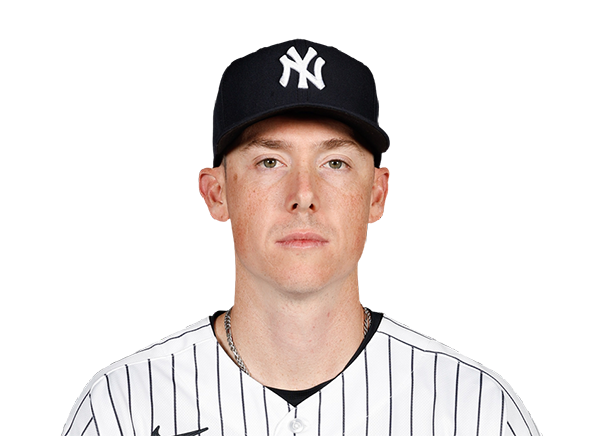 Ryan Yarbrough | 2.0 | 1 | 0 | 0 | 0 | 0 | 0 | 29-21 | 3.68 | 29 |
Minnesota Twins
| Player | IP | H | R | ER | BB | K | HR | PC-ST | ERA | PC |
|---|---|---|---|---|---|---|---|---|---|---|
 Bailey Ober | 5.1 | 9 | 3 | 3 | 2 | 3 | 1 | 101-69 | 4.32 | 101 |
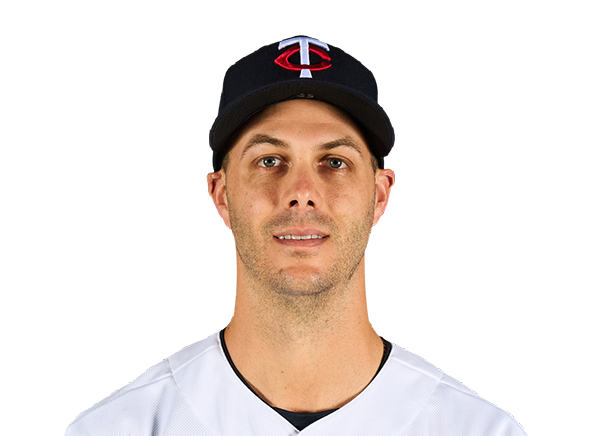 Taylor Rogers | 1.2 | 3 | 4 | 0 | 1 | 1 | 1 | 38-25 | 4.72 | 38 |
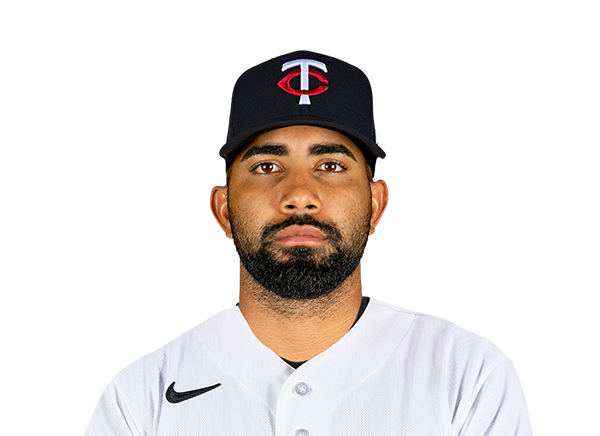 Yoendrys Gomez | 1.0 | 1 | 0 | 0 | 0 | 2 | 0 | 10-8 | 3.86 | 10 |
 Andrew Morris | 1.0 | 1 | 1 | 1 | 1 | 0 | 0 | 30-17 | 4.46 | 30 |
H2H / Season Series
MIN1–8
NYY
MIN3–8
NYY
NYY1–6
MIN
NYY4–11
MIN
NYY5–2
MIN
NYY0–15
MIN
MIN5–17
NYY
Last 5 Games
| Date | Opponent | Result |
|---|---|---|
| Sep 15 | @ MIN | W8–1 |
| Sep 14 | @ MIN | W8–3 |
| Sep 13 |  vs NYM | W2–0 |
| Sep 12 | vs NYM | L2–12 |
| Sep 11 | vs NYM | W6–4 |
| Date | Opponent | Result |
|---|---|---|
| Sep 15 | vs NYY | L1–8 |
| Sep 14 | vs NYY | L3–8 |
| Sep 13 |  vs CLE | L2–9 |
| Sep 12 | vs CLE | W4–3 |
| Sep 11 | vs CLE | L2–5 |
Standings
American League
| Team | W | L | PCT | GB | DIFF | STRK |
|---|---|---|---|---|---|---|
1 Rays | 91 | 59 | .607 | - | +70 | W4 |
2 White Sox | 77 | 74 | .510 | 14.5 | +37 | L1 |
3 Astros | 76 | 75 | .503 | 15.5 | -51 | W1 |
| 4Yankees | 88 | 63 | .583 | 3.5 | +137 | W3 |
5 Red Sox | 82 | 69 | .543 | 9.5 | +86 | L1 |
| 6Guardians | 77 | 75 | .507 | 15 | -10 | W1 |
7 Rangers | 75 | 76 | .497 | 16.5 | -42 | W3 |
8 Blue Jays | 75 | 77 | .493 | 17 | -41 | L2 |
9 Orioles | 74 | 78 | .487 | 18 | -32 | W2 |
10 Tigers | 72 | 79 | .477 | 19.5 | +80 | W6 |
| 11Twins | 70 | 81 | .464 | 21.5 | -74 | L3 |
12 Mariners | 70 | 82 | .461 | 22 | -61 | L3 |
13 Royals | 66 | 85 | .437 | 25.5 | -96 | L3 |
14 Athletics | 61 | 90 | .404 | 30.5 | -204 | L1 |
15 Angels | 58 | 93 | .384 | 33.5 | -73 | W2 |
National League
| Team | W | L | PCT | GB | DIFF | STRK |
|---|---|---|---|---|---|---|
1 Brewers | 94 | 57 | .623 | - | +199 | W1 |
2 Dodgers | 92 | 59 | .609 | 2 | +177 | W2 |
3 Braves | 89 | 63 | .586 | 5.5 | +115 | W1 |
4 Cubs | 84 | 68 | .553 | 10.5 | +139 | L1 |
5 Phillies | 83 | 68 | .550 | 11 | +28 | L1 |
6 Padres | 82 | 69 | .543 | 12 | +17 | L1 |
7 Diamondbacks | 80 | 72 | .526 | 14.5 | +1 | L1 |
8 Pirates | 75 | 76 | .497 | 19 | +22 | L1 |
9 Marlins | 75 | 77 | .493 | 19.5 | +7 | W1 |
10 Cardinals | 75 | 77 | .493 | 19.5 | -13 | L1 |
11 Nationals | 71 | 81 | .467 | 23.5 | +6 | W4 |
12 Reds | 70 | 81 | .464 | 24 | -152 | L2 |
| 13Mets | 69 | 82 | .457 | 25 | -37 | L3 |
14 Giants | 63 | 89 | .414 | 31.5 | -71 | W1 |
15 Rockies | 56 | 95 | .371 | 38 | -164 | W1 |
NYY
VS
MIN
Pitchers
Max Fried
Catchers
Ali Sanchez
Infielders
Luis Garcia Jr.
George Lombard Jr.
Anthony Volpe
Jose Caballero
Outfielders
Cody Bellinger
Heliot Ramos
Spencer Jones
Designated Hitters
Ben Rice
Pitchers
Bailey Ober
Catchers
Victor Caratini
Infielders
Kaelen Culpepper
Kody Clemens
Royce Lewis
Brooks Lee
Outfielders
Luke Keaschall
Emmanuel Rodriguez
Austin Martin
Designated Hitters
Josh Bell
Yankees
VS
Twins
Batting
151
Team Games Played
151
4992
At Bats
5078
1176
Hits
1236
662
Runs Batted In
657
209
Home Runs
175
144
Stolen Bases
84
.236
Batting Average
.243
693
Runs
687
215
Doubles
244
17
Triples
22
2052
Total Bases
2049
538
Walks
481
1377
Strikeouts
1201
.312
On Base Percentage
.317
.411
Slugging Percentage
.404
.723
OBP Pct + SLG Pct
.721
151
Games Played
151
151
Games Started
151
37
Hit By Pitch
89
0.0
Wins Above Replacement
0.0
0.0
Offensive Wins Above Replacement
0.0
48
Caught Stealing
33
1
Is Qualified
1
657.0
Runs Created
659.5
4.4
Runs Created Per 27 Outs
4.4
.096
Walks Per Plate Appearance
.084
0.39
Walk To Strikeout Ratio
0.40
.175
Isolated Power
.160
.302
Secondary Average
.265
3.98
Pitches Per Plate Appearance
3.86
441
Extra Base Hits
441
5620
Plate Appearances
5700
23.9
At Bats Per Home Run
29.0
10
Sacrifice Hit
9
38
Sacrifice Flies
42
Pitching
151
Team Games Played
151
61
Quality Starts
47
88
Wins
70
63
Losses
81
44
Saves
41
86
Holds
99
1116
Hits
1289
481
Earned runs
696
155
Home Runs
178
452
Walks
548
1352
Strikeouts
1261
9.0
Strikeouts Per 9 Innings
8.5
144.8
Pitches Per Start
149.9
1.16
Walks Plus Hits Per Inning Pitched
1.38
3.21
Earned Run Average
4.70
63
Losses
81
1350.0
Innings pitched
1331.2
.583
Win Percentage
.464
71
Save Opportunities
59
.222
Opponent Batting Average
.252
.292
Opponent's On-base pct.
.329
.366
Opponent's Slugging pct.
.416
.658
Opponent's OPB Pct + SLG Pct
.745
5017
At Bats
5124
207
Doubles
270
24
Triples
19
55
Batters Hit
65
67
Stolen Bases
126
151
Games Played
151
0
Complete Games
1
14
Shutouts
3
32
Wild Pitches
43
531
Runs Batted In
727
3
Balks
6
1350.0
Innings pitched
1331.2
9.0
Strikeouts Per 9 Innings
8.5
20
Caught Stealing
21
151
Games Started
151
0.0
Wins Above Replacement
0.0
1
Is Qualified
1
556
Runs
761
481
Earned Runs
696
1836
Total Bases
2131
Fielding
151
Team Games Played
151
1350
Full Innings
1332
5445
Total Chances
5210
4050
Putouts
3995
1306
Assists
1146
89
Errors
69
215
Double Plays
244
0.984
Fielding Percentage
0.987
35.7
Range Factor
34.7
0.0
Zone Rating
0.0
151
Games Played
151
0
Games Started
0
0.0
Defensive Wins Above Replacement
0.0
1
Qualified
1